HAL Id: hal-01247518
https://hal.archives-ouvertes.fr/hal-01247518
Submitted on 22 Dec 2015
HAL is a multi-disciplinary open access
archive for the deposit and dissemination of
sci-entific research documents, whether they are
pub-lished or not. The documents may come from
L’archive ouverte pluridisciplinaire HAL, est
destinée au dépôt et à la diffusion de documents
scientifiques de niveau recherche, publiés ou non,
émanant des établissements d’enseignement et de
under heterogeneous environmental constraints
Annalisa Minelli, Cyril Tissot, Mathias Rouan, Matthieu Le Tixerant
To cite this version:
Annalisa Minelli, Cyril Tissot, Mathias Rouan, Matthieu Le Tixerant. Multi-scale modelling for
simulating marine activities under heterogeneous environmental constraints . Spatial Analysis and
GEOmatics (SAGEO), Nov 2015, Hammamet, Tunisia. �hal-01247518�
Copyright © by the paper’s authors. Copying permitted for private and academic purposes. Proceedings of the Spatial Analysis and GEOmatics conference, SAGEO
2015.
Multi-scale modelling for simulating marine
activities under heterogeneous
environmental constraints
Annalisa Minelli
1, Cyril Tissot
1, Mathias Rouan
1, Matthieu Le
Tixerant
21. UMR 6554 LETG-Brest Géomer, Institut Universitaire Européen de la Mer, Place Nicolas Copernic, 29280 Plouzané, France
[email protected] [email protected] [email protected]
2. Terra Maris
Technopôle Brest-Iroise/Hameau d’entreprises, 29280 Plouzané, France [email protected]
ABSTRACT.This paper describes the concepts behind the implementation of a multi-agents model aimed to explore how marine activities respond to various environmental constraints. The methodology takes advantage on a responsive agent-based structure, and treats the environment as a set of forcing variables (biophysical, socio-economic and regulatory data). A first experiment in the Iroise Sea area shows a great potential in assessing the intensity and the variability of marine activities at different scales level. The whole methodology is presented in this paper in order to completely analyze the contributions and limitations concerning the SIMARIS prototype.
RESUME. Cette contribution décrit les concepts associés à la mise en œuvre d'un modèle multi-agents simulant le déroulement d'activités marines sous contraintes d'environnement. La méthodologie proposée se base sur un environnement de simulation permettant d’intégrer des données spatio-temporelles multi-sources et multi-échelles au sein d’un modèle à base d'agents contraints. Un premier prototype développé en mer d'Iroise montre les apports possibles de cette démarche pour évaluer la variabilité des activités de pêche à différentes niveaux scalaires.
KEYWORDS: multi-scale modelling, agent-based model, marine activities, spatio-temporal
Copyright © by the paper’s authors. Copying permitted for private and academic 1. Introduction
A review of the various scientific contributions concerning the modelling of human-environment interactions shows how difficult it is to integrate spatial and temporal dimensions into a multi agent based approach (Gould, 1987; Stonebraker, 1990; Allen, 1991; Muxart, 1992; Snodgrass, 1992; Cheylan, 1993; Claramunt, 1999; Parent, 1999; Legay, 2000; Pelekis, 2005; Tang, 2008). The main limitation results from the variability of these interactions. In fact, ecosystem dynamics are not always synchronised with the evolution of human activities, which respond to far more complex cycles that are particularly difficult to model. Although this human-environment “desynchronization” may seem obvious, most multi agent based models run in environments where all inputs and/or outputs are considered known and all the events hold the same rhythm.
MAS-based approaches are, therefore, inapplicable when the system encounters a situation unexpected by the model designer, i.e. when problem specification is incomplete or the environment undergoes changes affecting human activities. This limit is underlined by the complexity of multi-scale interaction between human activities and environment. This article proposes a new methodological approache that can simulate marine activities at different scales in order to take into account these complex interactions.
2. Conceptual framework
Our methodology is based on a cross-cutting approach focused on combining multi-agents model with multi-scale spatio-temporal databases with the aim to model interactions between human activities and their environment. This approach has a two-pronged goals: the simulation of the impact of human activity on a given environment and the assessment of the capacity of activities to adapt to environmental changes. Moreover in the paper we will point out how, using these modeling techniques, the representation of the interactions between activities and between activities and environment, is easily accomplished and the individuation of potential pressure zones (in terms of resources exploitation) and conflict zones (between activities) is possible.
2.1. Environmental Modelling
Environment modelling is a critical point in multi-agent models if it involves natural phenomena. In computing terms, the environment is considered as the support system component of simulations (Ferber and Müller, 1996). It thereby manages access to resources. In ecological modelling terms, it refers to the formalisation of how a natural environment operates, leading to the closest possible abstraction of reality (an interesting example could be find in Matthews et al., 2007). Computer modelling is restricted by natural environment features whereas ecological modelling is restricted by programming language structures and methods.
Multi-scale modelling for simulating marine activities 3
Copyright © by the paper’s authors. Copying permitted for private and academic purposes. Proceedings of the Spatial Analysis and GEOmatics conference, SAGEO
2015.
In agent-based systems, environmental modelling is an extremely important task yet paradoxically often disregarded (Weyns et al., 2007). According to Weyns et al. (2007), the environment represents a first-class abstraction.
MAS-related studies that give less importance to the environment focus mainly on the role, capacities, interactions and modelling of agents. In contrast, ecological modelling-related studies specifically involve the regulations and processes that govern ecosystems in order to study their impacts on ecosystem balance (Pereira et al., 2006; Pereira et al., 2009, Wang et al., 2008). Odell et al. (2002) define a MAS environment as the constraints under which agents exist.
In our approach, the environment consists of a set of spatial data. In particular, it includes constraints that influence the development of an activity, so it influences directly or indirectly almost all the decisions and/or actions taken by agents.
2.2 Integration of spatio-temporal variables
Time constitutes a core element in any dynamic modelling approach. The temporal dimension can be comprehended linearly (occurrences with chronological development) or discontinuously (cyclical or random occurrences) (Moellering, 1976; Muxart. et al., 1992; Peuquet, 2002; Edsall et al., 2005). For what concerns human activities, time is generally associated with a [given] state of the environment (landuse, landcover, resources etc.). In addition to exploring the chronological progression of environmental change, the analysis focuses on the space-to-time ratio. Concerning spatial data integration, recent models often ignore the interactions underlying geographical objects (Berjak et al., 2002, Jantz et al., 2005, Marceau et al., 2008). Moreover, the great part of modelling approaches considering the analysis of the dynamics of human-environment interactions, integrate space only as a structural element. It is clear that this assumption, drastically limits the spatial resolution and possible applications of the model itself because it requires that all the rules, governing the evolution of the simulation domain, must be specified in an explicit or probabilistic way. So, due to the intrinsic variability of both natural and human systems, this type of approach cannot adequately take into account the complexity of human-environment interactions. The impact analysis of human activities on the environment requires a close connection between the notions of time and space. This relationship determines the various states of the space observed, by considering the physical or human factors guiding the changes of that space. The space-time relationship, in this context, include the spatio-temporal entity concept (Cheylan et al., 1993; Hornsby et al., 2004; Cheylan et al., 2007). In conceptual terms, several authors have suggested that the orthogonality of the spatio-temporal entities is a key criterion to the integration of hierarchies in a modelling approach (Claramunt et al., 1999; Parent et al., 1999). These studies show also that the evolution of the nature and structure of a spatial entity is associated with a time scale that determines state changes. In a human-environment relationship analysis, this time and space scale variability has a direct effect on the intensity and nature of interactions. Orthogonality therefore allows the joint consideration of two different scales:
Copyright © by the paper’s authors. Copying permitted for private and academic • a temporal scale, where the various cycles can be decomposed into as many
time steps of variable duration as necessary;
• a spatial scale, where the evolution of geographic entities at a given aggregation level is determined by the conjunction of human and natural events (each of which is conversely constrained by specific temporalities). In this context, the integration of geomatics tools (as digital geographical data processing, spatio-temporal databases etc.) in model design can facilitate the development of a modelling platform that can determine a complex simulation space by combining a set of human (socioeconomic, regulatory forcings) and environmental (physical and environmental forcings) factors.
3. The SIMARIS prototype
The SIMARIS (Simulation of marine activities under heterogeneous environmental
constraints) prototype is designed to describe human activities and their spatio-temporal distribution, modelled in the form of responsive agents constrained by exogenous variables (biophysical, socioeconomic and regulatory constraints). It considers the ecosystem studied as a resource potentially used by humans according to the techniques available and to their social organisation at a given time. This use is not always associated with natural resources exploitation; it can also refer to land allocation for a specific use.
For example, manure-spreading practices are associated with a farming area for which the potential use of the practice itself has a set of spatial and temporal constraints. Each activity thus responds to a specific operating cycle, adjusted accordingly to technical, economic, regulatory, environmental and social filters.
In parallel, the analysis of the variability of environmental components entails time fragmentation into a series of intervals more or less long according to the processes they are associated with.
3.1 General principle of SIMARIS
The SIMARIS model provides a simulation environment that can integrate multi-source and multi-scale spatio-temporal constraints as forcing variables within constrained agent models (Tissot et al., 2013, Le Tixerant et al., 2012). This approach meets the requirement of explicitly formalize spatio-temporal relationships between spatial entities, environmental processes and human activities. The aim is to set up a methodological framework that can run without a complete system specification, i.e. considering the modelling environment as the result of a set of multi-scale constraints. SIMARIS has been implemented in GAMA simulation platform.
The GAMA multi agent platform (Grignard et al., 2013) is a quite recent multi agent protocol able to fully integrate geographical data in a multi agent system
Multi-scale modelling for simulating marine activities 5
Copyright © by the paper’s authors. Copying permitted for private and academic purposes. Proceedings of the Spatial Analysis and GEOmatics conference, SAGEO
2015.
(Taillander et al., 2014). It is written in Java and can be parametrized in .gaml language. This specific platform has been chosen for this work in reason of its large compatibility with geographical data. In fact it allows the reading of georeferenced files by their projected coordinate systems specification and their automatic reprojection from different coordinate reference systems if necessary. This is quite unusual for a MAS, especially considering that MAS execute operations in a synthetic world, measured by the (X, Y) cartesian coordinates instead of (East, West) or (Lat, Long) coordinates, as Geographical Informative Systems do. Moreover it allows the multi-level modelling, which means that different analyses can be executed contemporarily in the same environment but with a different space-time resolution and this is different from a mere parallel computing, since these “levels” of analyses can influence each other. In case of multi-level analysis the agents can be organized in super-agents: a sort of macro-entities which generalize the characteristics of a group of affine agents and, conversely, the single agent inherits the characteristics of the macro-agent.
All these features makes GAMA suitable for the SIMARIS prototype implementation.
3.2 Spatio-temporal granularity
Defining a spatial granularity, necessary to model human or environmental events, is one of the key issues and an essential precondition to build a model with spatio-temporal constraints (Pereira et al., 2004). A relatively intuitive, commonly used practice is to consider the smallest common denominator of the objects involved as the model’s spatial unit. A similar practice is used for the simulation time step. While this practice provides good results in many applications, its drawback is that it tends to involve objects with unknown dynamics or no tangible reality. For instance, in the case of marine activities, the knowledge of a procedure performed on a daily scale does not necessarily reveal its hourly course.
In this context, the SIMARIS model use spatial aggregation and disaggregation procedures that access data to match the level scale of the various sub-models used in the simulation. This issue raises important methodological questions like carrying out scale transfers within models. Scientific contributions dealing with this type of approach are rare and highlight the complexity of spatial aggregation and disaggregation procedures (Gotway, 2002; Duboz, 2004). The main restrictions is the loss of consistency among data (which can be homogeneous at a given scale, but heterogeneous at different scale). It is therefore necessary to control small-scale variability in the models used, either explicitly or in a parameterised form.
Given the diversity of the data representing constraints for the models developed within the SIMARIS model (statistical data, digital geographic information, e.g. raster and vector data, temporal data) and the heterogeneity of the spatial organisation levels involved, the methodology developed is based on a bottom-up approach. The aim is to hook several abstraction levels in the model based on the higher resolution one.
Copyright © by the paper’s authors. Copying permitted for private and academic Regarding the multi-scale approach, in GAMA it is possible to define different spatio-temporal resolution, both in the same level of analysis and through different levels. In fact, different spatial resolutions can be specified for different grids and the cells can have squared, rectangular and hexagonal shape. Regarding time, different temporal granularities can also be specified for different agents in the way that any possible desynchronization between agents’ activities can be fully represented.
Once the first and higher resolution level analysis is simulated, GAMA can aggregate agents in super-agents, as hinted before. This means that if, for example, the SIMARIS model simulates different agents for different types of fishing boats in the first level (for example “algae fishing boat”, “king scallop dredge fishing boat”, etc.), at the second level (more aggregate) it could appear a super-agent “fishing boat” grouping all types of fishing boats. And informations coming from the first level simulation can be remounted to the second level of simulation performing an aggregation operation too. Since GAMA is fully configurable, it is then possible to choose for each level the informations to be remounted and the better aggregation method to be chosen.
3.3 Application and results in the Iroise Sea
3.1.1. The Studied Zone
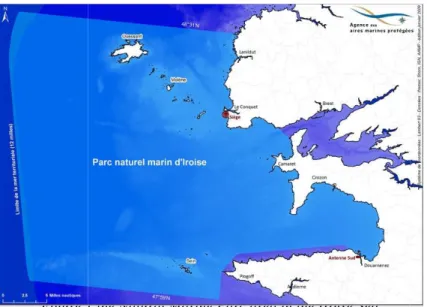
A first implementation of SIMARIS model in GAMA platform applies the principles described above on the Iroise Sea. In fact, this zone is a Natural Marine Parc and a Marine Protected Area (Figure 1) hosting concurrent (in space and time) activities, potentially generating pressure on natural environment, exploiting natural resources and interacting one with each other.
Copyright © by the paper’s authors. Copying permitted for private and academic purposes. Proceedings of the Spatial Analysis and GEOmatic
Figure 1.the Natural Marine Parc area in the Iroise Sea.
3.3.2 Input data
Following the bottom
all the single activities in detail. At the first level of simulation (higher resolution), two different types of fishing activities are taken into account: the algae and the king scallop dredge fishing. A brief summary of input data and it
table below.
Comingfromfishingcommittees Comingfromother sources
3.3.3 Species implemented in GAMA
In SIMARIS model, a set of agents is implemented in order to simulate fishing activities. Each element implemented as agent is supposed to be able to interact with the environment and other agents following internal and external constraints and factors (weather conditions, regulation, fish market price…).
Regarding the limits and the shape of the “world” (here intended as working zone), they are defined by the bathymetry
Multi-scale modelling for simulating marine activities
Copyright © by the paper’s authors. Copying permitted for private and academic purposes. Proceedings of the Spatial Analysis and GEOmatics conference, SAGEO
2015.
Figure 1.the Natural Marine Parc area in the Iroise Sea.
Following the bottom-up approach, we choose to start the simulation by defining all the single activities in detail. At the first level of simulation (higher resolution), two different types of fishing activities are taken into account: the algae and the king scallop dredge fishing. A brief summary of input data and its origin is reported in the
Table 1. Type and origin of input data
Geographical Data Not Geographical Data
Comingfromfishingcommittees Fishing Zones Maximum capture rates,
fishing calendars
Comingfromother sources Bathymetry,
ports location
Tide,
king scallop growing rules
3.3.3 Species implemented in GAMA
In SIMARIS model, a set of agents is implemented in order to simulate fishing activities. Each element implemented as agent is supposed to be able to interact with environment and other agents following internal and external constraints and factors (weather conditions, regulation, fish market price…).
Regarding the limits and the shape of the “world” (here intended as working zone), they are defined by the bathymetry. So, since bathymetry represents the scale modelling for simulating marine activities 7
Copyright © by the paper’s authors. Copying permitted for private and academic s conference, SAGEO
ion by defining all the single activities in detail. At the first level of simulation (higher resolution), two different types of fishing activities are taken into account: the algae and the king s origin is reported in the
Not Geographical Data
Maximum capture rates, fishing calendars
king scallop growing rules
In SIMARIS model, a set of agents is implemented in order to simulate fishing activities. Each element implemented as agent is supposed to be able to interact with environment and other agents following internal and external constraints and
Regarding the limits and the shape of the “world” (here intended as working . So, since bathymetry represents the
Copyright © by the paper’s authors. Copying permitted for private and academic environment, it means that automatically it cannot be influenced by the behavior of all other agents or by external occurrences. This assumption fits quite well the real behavior of the earth surface, since, unless of severe and rapid natural changes (as big earthquakes, for example), it can be considered in “stable” condition. All the elements acting on the environmental scene are defined as agents.
Since the simulation regards the algae and king scallop dredge fishing activities, two different agents “boat” are defined: one for each type of activity. Both the agents implement a set of rules in order to simulate moving and fishing acts:
• the first action (implemented in GAMA as “reflex”) is the movement from a starting port to a random point of the fishing zone. This reflex is activated by the conditions for the agent to be initialized, to be in a fishing period and to have all its fishing potential still intact (the boat has enough space to accommodate the catch). Once this first action is executed, the boat changes state from 0 (inactive) to 1 (active).
• the second reflex simulates the fishing activity. This reflex is activated if the boat is active (state = 1) and it has the possibility to accommodate fish. Starting from the random point of the fishing zone, the boat tries to catch all that it can; a calculation of the catch is made basing on the quantity of fish present in the specific cell of the fishing zone so that the boat starts to load. If the boat fulls after the fish, it modifies the state parameter to 3 (discharge) and activates the discharge reflex. If the boat is not full after have visiting a specific cell of the fishing zone, it selects the neighbour cells and it chooses one of them as fishing target. The state value is turned to 2 (fishing). The process continues since the boat is not full.
• the third reflex simulates the action of discharge for the boats and it is activated when the boat is full and its state is set to “discharge”. In this reflex the boat goes automatically to the nearest discharge point, it discharges the catch and modifies its state to 1 (inactive) so that the moving/fishing loop can continue.
Another particular characteristic of the agent “boat” is that the captain has a memory. In fact, once he catched all the possible from a fishing zone cell, he stores the visited cell in a list in the way that, during the fishing movement, he drops the visited (and empty) cells from the list of neighbours, excluding them from the possible target cells.
The agents “fishing zones” are differentiated in reason of the type of activity. The resource is stored in a regular square cell grid, perfectly sized on the input vector area of fishing zones. The resolution of this grid is automatically connected to the extension of the studied area. Each cell carries information regarding the quantity (nb. of individuals), size and weight of each individual. The exemplaries are differentiated in reason of the stage of growth too. At the beginning of the simulation a random quantity and distribution of individuals are simulated, size and total weight are calculated consequently for each cell.
Multi-scale modelling for simulating marine activities 9
Copyright © by the paper’s authors. Copying permitted for private and academic purposes. Proceedings of the Spatial Analysis and GEOmatics conference, SAGEO
2015.
For example, for the king scallop, there are three different stages of life: young, growing and mature. The stages have a respective duration of 180, 365 and 365 days (Buestel and Laurec, 1975; Buestel et al., 1986; Chavaud et al., 1998). The boat catches as much as it can. and if the boat catches all the resource in the cell (all the exemplaries) the cell becomes empty, if the boat catches less than the cell content, the remaining part of resource is left in the cell. The regeneration of the resource is periodically executed once or twice a year (seeding of juvenile in some fishing area).
The agent “tide” is a regular grid covering all the bathymetry extension with the same spatial resolution. In reason of the zone examined, the grid is appropriately resized and, accordingly to the nearest located port, the value of tide is read from the database Postgres. Thanks to a specific set of functions, called “SQLSKILL”, GAMA is able to connect with the database and read values from tables, executing SQL queries. For each time step, a request is formulated to the database Postgres and the corresponding value for tide is read from the table, the value is then stored in each cell of the tide grid and it changes at each time step. If the zone studied is quite large and more than one port is included into the zone itself, the values of tide for different ports are read and the obtained values are interpolated in order to simulate, by means of a continuous surface, the spatial variability of the tide.
Tide values infer fishing activities, in fact, depending on the fishing type, there is a range for the height of water which maximize the catchment. This threshold value is used if fishing zones are not provided or available in the working area, in joint with the bathymetry grid and an eventual seafloor bed grid, in order to individuate potential fishing zones.
Moreover the model contains an agent “traffic” which has the shape of a regular grid. This grid too is resized once the working zone is individuated and its task is to record the passage of a boat adding a “+1” in each single cell visited by a boat. This agent is useful in order to quantify the effective pressure on the environment (due to frequentation), once a specific scenario is simulated.
3.3.4 Procedure description
The SIMARIS model is dynamic and multilevel. This means that the first thing asked to be specified is the spatial and temporal limits of simulation. A start and end datetime must be inserted into the graphical interface, and the working area is described by two couple of coordinates, belonging to two points, delimiting a rectangular zone.
On the basis of spatial extension (area of the working zone) is assigned a level to the analysis, considering that, for each different level, different type of informations will be returned from the model. For example, if the spatial extent of the analysis is the fishing zone (or a part of it) and the period is one week, probably the interest of the simulation is to monitor the single catchment act, so the spatio-temporal resolution of the analysis must be appropriate, and the information obtained will be quite detailed (e. g. catchment rate for each single fishing session, view of the boat movement during the catchment etc. etc.). As opposite, if the simulation covers one
Copyright © by the paper’s authors. Copying permitted for private and academic year and it is performed over all the Iroise Sea, the interest could be to monitor the maritime traffic and the global catchment rates each month, for example, and it makes no sense to view the movement of boats during a single fishing session.
Another model peculiarity is the possibility to represent desynchronization between agents. In fact it exists (and must be specified) a global “step” parameter, which represents the temporal granularity and the time step corresponds to a cycle. But it is also possible to define an optional “step” parameter for each single agent. This means that if, for example, our aim is to simulate the growth of species (which is regularly a quite long process) and the fishing activities at a different velocity, we can do it. Although this instrument is potentially very powerful, it must be used carefully since an unnecessary desynchronization could invalidate the results of an entire simulation: for example it is fundamental to synchronize fishing operations (which should be represented at hourly or half-an-hour rate) with fishing calendar (which can be represented at hourly but also at daily or monthly rate).
So, different values for time and space granularity are automatically defined. The models’ input layers (spatial data) are: a general vector map of the studied zone; the raster file of bathymetry; the vector point map of ports; the vector maps of fishing zones (optional); the vector map of seafloor bed (optional).
Other models’ input data are: the database of the tide table; the name of the port(s) to be used to calculate tide level(s); a starting and ending datetime of simulation; the coordinates of two points defining the working zone.
Once all the inputs are specified, the model guides the user, by using messages on the console, through a step by step procedure. For atypicalrun:
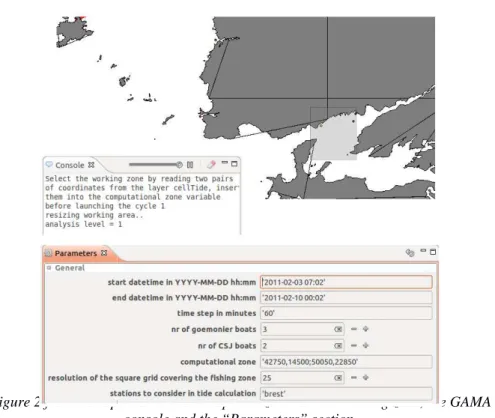
1. the model initializes both the environment and the agents; a general skeleton map of the zone reporting starting and discharge points of ports appear. The user is invited to specify the zoom level by reading two couple of coordinates on the map (Figure 2). In this case the presence of two types of agents «boats» are examined: three algae and two king scallop fishing boats. The time period examied is one week and the extension of the selected zone allows the most detailed level of analysis, so, the movement of the single boat and resource consumption will be evidenced during the routing;
Copyright © by the paper’s authors. Copying permitted for private and academic purposes. Proceedings of the Spatial Analysis and GEOmatic
Figure 2.from the top: the “world” map with zoom on the working zone, the GAMA
2. all the input layers and the entire world are resized on the specified zoom and the agents boats, tide and traffic are created;
3. the species are randomized over the fishing zone grid and they start growing. The boats start moving and fishing, if the calendar allows it (Figure 3 a, b).
A typical situation after some steps is the one evidenced in Figure 3c. On the higher part is reported an extract from the king scallop fishing zones attribute table and it is possible to see different parameters belonging to each single cell (the number of individuals in each cell, their age, their stage of growth and the weight of the single individual); on the bottom part is reported the fishing zone situation as it appears after some cycles: in light orange the cells containing some resource, in blue the empty cells. From this figure it is possible to evidence that there are some parts of the fishing zone most frequented than others (e. g. the ones circled in red).
These first results could be used, for example, in order to extract some important information about frequentation and resource exploitation, or they can be crossed with other data (map
extrapolate potential pressures on natural environment. Moreover an unforeseen event could occur (a modification on fishing calendar or the interdiction of a part of
Multi-scale modelling for simulating marine activities
Copyright © by the paper’s authors. Copying permitted for private and academic purposes. Proceedings of the Spatial Analysis and GEOmatics conference, SAGEO
2015.
Figure 2.from the top: the “world” map with zoom on the working zone, the GAMA console and the “Parameters” section.
all the input layers and the entire world are resized on the specified zoom and the agents boats, tide and traffic are created;
the species are randomized over the fishing zone grid and they start growing. The boats start moving and fishing, if the calendar allows it (Figure 3 a, b).
A typical situation after some steps is the one evidenced in Figure 3c. On the orted an extract from the king scallop fishing zones attribute table and it is possible to see different parameters belonging to each single cell (the number of individuals in each cell, their age, their stage of growth and the weight of ual); on the bottom part is reported the fishing zone situation as it appears after some cycles: in light orange the cells containing some resource, in blue the empty cells. From this figure it is possible to evidence that there are some parts
ng zone most frequented than others (e. g. the ones circled in red). These first results could be used, for example, in order to extract some important information about frequentation and resource exploitation, or they can be crossed with other data (map of more sensible zones - at naturalistic level) in order to extrapolate potential pressures on natural environment. Moreover an unforeseen event could occur (a modification on fishing calendar or the interdiction of a part of scale modelling for simulating marine activities 11
Copyright © by the paper’s authors. Copying permitted for private and academic s conference, SAGEO Figure 2.from the top: the “world” map with zoom on the working zone, the GAMA
all the input layers and the entire world are resized on the specified zoom the species are randomized over the fishing zone grid and they start growing. The boats start moving and fishing, if the calendar allows it A typical situation after some steps is the one evidenced in Figure 3c. On the orted an extract from the king scallop fishing zones attribute table and it is possible to see different parameters belonging to each single cell (the number of individuals in each cell, their age, their stage of growth and the weight of ual); on the bottom part is reported the fishing zone situation as it appears after some cycles: in light orange the cells containing some resource, in blue the empty cells. From this figure it is possible to evidence that there are some parts
ng zone most frequented than others (e. g. the ones circled in red). These first results could be used, for example, in order to extract some important information about frequentation and resource exploitation, or they can be crossed at naturalistic level) in order to extrapolate potential pressures on natural environment. Moreover an unforeseen event could occur (a modification on fishing calendar or the interdiction of a part of
Copyright © by the paper’s authors. Copying the fishing zone) and a new sc
results.
Figure 3.on the top: an extract from the fishing zone area attributes: the idividuals present in each cell have all the same growt stage (lifedays and stage) but they are numerically
are evidenced visited and empty cells; (b) a boat at discharge place; (c) the resized fishing zones (light orange) accordingly to the specified zoom. Circled in red: an example of most exploit
It must be said that in this case, since the example is aimed to individuate the more exploited zones (into a previously defined fishing zone) and to obtain a resource balance, a small geographical zone is selected and the analysis level is the most refined. If a longer period and a wider zone is selected, the model gives aggregate information as requested from specifications. For example, if the zone contains more fishing zones we will not see any boat moving but we will obtain in output a resource exploitation graphic which will synthesize the fishing activity for all the boats over the specified period for the specific zone. So, detailed data are Copyright © by the paper’s authors. Copying permitted for private and academic the fishing zone) and a new scenario configuration could lead to sensibly different
Figure 3.on the top: an extract from the fishing zone area attributes: the idividuals present in each cell have all the same growt stage (lifedays and stage) but they are numerically different (nbIndiv); on the bottom: (a) a boat fishing. In blue are evidenced visited and empty cells; (b) a boat at discharge place; (c) the resized fishing zones (light orange) accordingly to the specified zoom. Circled in red: an example of most exploited zones.
It must be said that in this case, since the example is aimed to individuate the more exploited zones (into a previously defined fishing zone) and to obtain a resource balance, a small geographical zone is selected and the analysis level is the ost refined. If a longer period and a wider zone is selected, the model gives aggregate information as requested from specifications. For example, if the zone contains more fishing zones we will not see any boat moving but we will obtain in ce exploitation graphic which will synthesize the fishing activity for all the boats over the specified period for the specific zone. So, detailed data are permitted for private and academic enario configuration could lead to sensibly different
Figure 3.on the top: an extract from the fishing zone area attributes: the idividuals present in each cell have all the same growt stage (lifedays and stage) but different (nbIndiv); on the bottom: (a) a boat fishing. In blue are evidenced visited and empty cells; (b) a boat at discharge place; (c) the resized fishing zones (light orange) accordingly to the specified zoom. Circled in red: an
It must be said that in this case, since the example is aimed to individuate the more exploited zones (into a previously defined fishing zone) and to obtain a resource balance, a small geographical zone is selected and the analysis level is the ost refined. If a longer period and a wider zone is selected, the model gives aggregate information as requested from specifications. For example, if the zone contains more fishing zones we will not see any boat moving but we will obtain in ce exploitation graphic which will synthesize the fishing activity for all the boats over the specified period for the specific zone. So, detailed data are
Multi-scale modelling for simulating marine activities 13
Copyright © by the paper’s authors. Copying permitted for private and academic purposes. Proceedings of the Spatial Analysis and GEOmatics conference, SAGEO
2015.
«hidden» since a high level of refinement is not required, synthesis data is produced instead.
4. Conclusions
The approach presented in this paper explore new methodological framework in multi-scale modelling. Developed in GAMA simulation platform, the SIMARIS prototype explicitly formalizespatio-temporal relationships between spatial entities, environmental processes and human activities. The complexity of the prototype is still limited, since the model takes into account for the moment only fishing activity (super-agent) and details some of them (agents), so there are two different analysis levels.
In thematic terms, the applications to coastal area situations, provide encouraging results for assessing complex interactions between marine activities and coastal ecosystems. Changes in activity intensity will be particularly interesting to study because they illustrate the variability of these interactions.
Since it involves human activities under heterogeneous spatio-temporal constraints, the approach described here require the development of models integrating many stochastic processes. The validation of an approach combining deterministic and stochastic modelling is therefore a key issue in the implementation of the SIMARIS model.
Finally, the approach described here raises numerous questions as, for example, how to structure a multi-scale model like SIMARIS. The applications mentioned above indicate that there is a relationship between the granularity of the spatial and temporal data and the abstraction level of the model. The formalisation of this relationship remains complex. Extensive exploration of model structure may help to describe this relationship.
Bibliographie
Allen J.F., 1991. Time and time again: the many ways to represent time. International
Journal of Intelligent Systems 6, 341-355.
Bandini, S., Manzoni, S., & Simone, C. (2002). Heterogeneous agents situated in
heterogeneous spaces. Applied Artificial Intelligence, 16(9-10), 831-852.
Bedrouni, A.; Mittu, R.; Boukhtouta, A. & Berger, J. 2009.Distributed intelligent systems: A
coordination perspective.Springer, ISBN 978-0-387-77702-3.
Berjak, S. G. & Hearne, J. W., 2002.An improved cellular automata model for simulating fire in a spatially heterogeneous Savanna system.EcologicalModelling, 148(2), 133-151. Buestel, D., Gerard, A., &Guenole, A. (1986, September). Croissance de différents lots de coquille Saint-Jacques Pecten maximus en culture sur le fond dans la rade de Brest. In Société Française de Malacologie Symposium de Rochefort Ecologie,
Copyright © by the paper’s authors. Copying permitted for private and academic
Buestel, D., &Laurec, A. (1975). Croissance de la coquille Saint-Jacques (Pecten maximus
L.) en rade de Brest et en baie de Saint-Brieuc. Haliotis, 5, 279-283.
Chauvaud, L., Thouzeau, G., & Paulet, Y. M. (1998). Effects of environmental factors on the daily growth rate of Pecten maximus juveniles in the Bay of Brest (France). Journal
of Experimental Marine Biology and Ecology, 227(1), 83-111.
Cheylan J-P., 2007. Les processus spatio-temporels: quelques notions et concepts préalables à
leur représentation, M@ppemonde n°87,
http://mappemonde.mgm.fr/num15/articles/art07303.html.
Cheylan J-P., Lardon S., 1993. "Toward a conceptual model for the analysis of
spatio-temporal processes". In FRANK A., CAMPARI I., eds, Spatial Information Theory.
COSIT'9 Conference. Berlin: Springer Verlag, Lecture Notes in Computer Science n° 716, 478 p. ISBN: 3-5405-7207-4
Claramunt C., Parent C., Spaccapietra S., Thériault M., 1999. Database Modelling for Environmental and Land Use Changes. In: Openshaw S. Geertman S., Stillwell J., (coord) - Geographical Information and Planning : European Perspectives. Springer-Verlag, pp. 173-194.
De Wilde, P.; Nwana, H. S. & Lee, L. C., 1999.Stability, fairness and scalability of multi-agent systems.International Journal of Knowledge-Based Intelligent Engineering
Systems, Citeseer, 3, p. 84-91.
Duboz R., 2004. Intégration de modèles hétérogènes pour la modélisation et la simulation de
systèmes complexes. Application à la modélisation multi-échelles en écologie
marine. Université de Calais, 230 p.
Edsall, R.M., Sidney, L.R., 2005. Applications of a cognitively informed framework for the
design of interactive spatio-temporal representations. In: J. Dykes, A.M.
MacEachren, and M.J. Kraak, eds. Exploring geovisualization, International Cartographic Association. Amsterdam, The Netherlands: Elsevier Science, 730. Ferber, J., & Müller, J. P. (1996, December). Influences and reaction: a model of situated
multiagent systems. In Proceedings of Second International Conference on
Multi-Agent Systems (ICMAS-96) (pp. 72-79).
Ferber, J., 1999. Multi-agent systems: an introduction to distributed artificial intelligence, Addison-Wesley Longman Publishing Co., Inc.
Gotway C.A., Young L.J., 2002. Combining incompatible spatial data, Journal of the
American Statistical Association 97, p. 632-648.
Gould S.J., 1987. Time's Arrow,Time's Cycle: Myth and Metaphor in the Discovery of
Geological Time. Harvard University Press, Cambridge, 222 p.
Grignard, A., Taillandier, P., Gaudou, B., Vo, D. A., Huynh, N. Q., &Drogoul, A. (2013). GAMA 1.6: Advancing the art of complex agent-based modeling and simulation. In PRIMA 2013: Principles and Practice of Multi-Agent Systems (pp. 117-131). Springer Berlin Heidelberg.
Hornsby, K.H. and Worboys, M.F., 2004. Event-oriented approaches in geographic information science, Spatial Cognition and Computation 4(1), Lawrence Erlbaum, Mahwah, NJ, ISBN: 0-8058-9531-0.
Multi-scale modelling for simulating marine activities 15
Copyright © by the paper’s authors. Copying permitted for private and academic purposes. Proceedings of the Spatial Analysis and GEOmatics conference, SAGEO
2015.
Jantz, C. A. &Goetz, S. J. (2005). Analysis of scale dependencies in an urban land-use change model.International Journal of Geographical Information Science, 19 (2), 217-241. Koopmans T. C., 1951.Analysis of Production as an Efficient Combination of Activities. In:
T.C. Koopmans (Editor), Activity Analysis of Production and Allocation. J. Wiley, New York, pp. 33-97).
Lee, L.; Nwana, H.; Ndumu, D. & De Wilde, P, 1998. The stability, scalability and performance of multi-agent systems BT Technology Journal, Springer, 16, 94-103 Le Tixerant M., Gourmelon F., Tissot C., Brosset D., 2012, Modelling of human activity
development in coastal sea areas. Journal of Coastal Conservation Volume 15, Number 4, pp. 407-416
Marceau, D. J., Ménard, A. & Moreno, N., 2008. Les automates cellulaires appliqués à la simulation des changements d’utilisation du sol: Sensibilité à l’échelle spatiale et temporelle. In M. Thériault & F. Desrosiers (Eds.), Information géographique et
dynamiques urbaines. Paris: Lavoisier – Hermes Science Publication
Matthews, R. B., Gilbert, N. G., Roach, A., Polhill, J. G., & Gotts, N. M. (2007). Agent-based land-use models: a review of applications. Landscape Ecology, 22(10), 1447-1459. Moellering, H., 1976. The potential uses of a computer animated film in the analysis of
geographical patterns of traffic crashes. Accident Analysis and Prevention, 8, 215– 227.
Muxart T., Blandin P., Friedberg C., 1992. Hétérogénéité du temps et de l'espace : niveaux d'organisation et échelles spatio-temporelles. In : Jollivet M. (coord) - Sciences de la
nature, sciences de la société. Les passeurs de frontières. CNRS, Paris, pp.
243-258.
Neteler M., Mitasova H. (2008). Open Source GIS: A GRASS GIS Approach. 3rd Ed. 406 pp, 80 illus., Springer, New York. Online Supplement: http://www.grassbook.org/ Odell, J., Van Dyke Parunak, H., Fleischer, M., Brueckner, S., 2002.Modeling agents and
their environment.Agent-oriented software engineering III, Springer, 16-31. Pelekis N., Theodoulidis B, Kopanakis I., Theodoridis Y., 2005 - Literature Review of
Spatio-Temporal Database Models, The Knowledge Engineering Review Journal, 19(3), 235-274.
Pereira, A.; Duarte, P. &Norro, A., 2006. Different modelling tools of aquatic ecosystems: A proposal for a unified approach. Ecological Informatics, Elsevier, 1, 407-421. Pereira, A.; Duarte, P. & Reis, L. Based Simulation of Ecological Models.
Agent-Based Simulation, 2004
Pereira, A.; Reis, L. & Duarte, P., 2009. EcoSimNet: A Multi-Agent System for Ecological Simulation and Optimization. Progress in Artificial Intelligence, Springer, 473-484. Parent C., Spaccapietra S., Zimanyi E., 1999. Spatio-Temporal Conceptual Models : data
structures + space + time. Actes du Colloque Advance in GIS, Kansas City,
november 5-6, pp. 26-33.
Parker DC., Manson SM., Janssen MA., Hoffmann MJ., Deadman P., 2003. Multi-agent systems for the simulation of land-use and land-cover change: a review. Ann Assoc
Copyright © by the paper’s authors. Copying permitted for private and academic
Peuquet, D.J. 2002.Representations of Space and Time, New York: Guilford.
Schindler J., 2010. A Multi-Agent System for Simulating Land-Use and Land-Cover Change in the Atankwidi Catchment in Upper East Ghana, Dissertation.Ecology and
Development Series No. 68.
Simonin O., Gechter F., 2006. An Environment-Based Methodology to Design Reactive Multi-agent Systems for Problem Solving, Environments for Multi-Agent Systems II, Lecture Notes in Computer Science Volume 3830, pp 32-49.
Snodgrass R.T., 1992. Temporal Databases.In : Campari I. Frank A., Fromentini O., (coord) - Theories and methods of spatio-temporal reasoning in geographic space. Springer-Verlag, pp. 22-64.
Stonebraker M., Rowe L., Hirohama M., 1990. The implementation of POSTGRES.IEEE
Transaction of Knoledge and Data Engineering.2 : pp. 125-142.
Taillandier, P., Grignard, A., Gaudou, B., &Drogoul, A. (2014).Des données géographiques à la simulation à base d’agents: application de la plate-forme GAMA. Cybergeo:
European Journal of Geography.
Tang, W., 2008, Simulating complex adaptive geographic systems: A geographically aware intelligent agent approach. Cartography and Geographic Information Science, 35(4): 239-263.
Tissot C., Brosset D., Barillé L., Le Grel L., Tillier I., Rouan M. & Le Tixerant M., 2012. Modeling Oyster Farming Activities in Coastal Areas: A Generic Framework and Preliminary Application to a Case Study, Coastal Management, 40:5, 484-500. Weyns, D.; Omicini, A. & Odell, J., 2007.Environment as a first class abstraction in