HAL Id: hal-01135639
https://hal-mines-paristech.archives-ouvertes.fr/hal-01135639
Submitted on 25 Mar 2015HAL is a multi-disciplinary open access archive for the deposit and dissemination of sci-entific research documents, whether they are pub-lished or not. The documents may come from teaching and research institutions in France or abroad, or from public or private research centers.
L’archive ouverte pluridisciplinaire HAL, est destinée au dépôt et à la diffusion de documents scientifiques de niveau recherche, publiés ou non, émanant des établissements d’enseignement et de recherche français ou étrangers, des laboratoires publics ou privés.
Analysis of the effect of environmental policies on the
allocation of natural gas accross end-use sectors in
France
Edi Assoumou, Nadia Maïzi
To cite this version:
Edi Assoumou, Nadia Maïzi. Analysis of the effect of environmental policies on the allocation of natural gas accross end-use sectors in France. [Research Report] Working Paper 2011-02-02, Chaire Modélisation prospective au service du développement durable. 2011, pp.24 - Les Cahiers de la Chaire. �hal-01135639�
Les Cahiers de la Chaire
Analysis of the effect of environmental
policies on the allocation of natural gas
across end-use sectors in France
Chair
e Modé
lisa
tion pr
ospectiv
e au se
rvice du dé
veloppe
me
nt dur
able
Edi Assoumou, Nadia Maïzi
Centre for Applied Mathematics
MINES ParisTech, France
Abstract
Representing 20% of the world primary energy supply, natural gas is a key component of today’s energy systems. Its lower carbon content per unit of energy, its versatility and re-lative abundance make it a strategic fuel for addressing both the world’s future demand for energy and the climate change concern. Hence several medium-term projections advocate the increased use of natural gas. Yet while its contribution as a solution to the climate change issue is positive in comparison to more carbonated fossil energy sources, which represent 60% of the world primary energy supply, burning natural gas has an absolute negative emis-sion contribution. How then are its projected uses affected by stringent environmental po-licies? For what end-use is it the best candidate? In this paper we address these questions for France, which is the fourth largest natural gas market in the European Union and has a 97% import dependency. We focus on end-use sectors and we quantify the evolution of gas allocation up to 2050.Our results highlight significant reductions in the expected growth rate before 2030, followed by a clear decrease that brings the natural gas industry back to its current levels. In a case where it does not succeed in securing a significant market share in the transport sector, consumption in 2050 evens out at around 1990 levels. We quantify the dependency on technological developments for gasification technologies and natural gas-fueled vehicles, and highlight the sensitivity of cross-sector allocation to import prices.
Keywords: Long-term model; low carbon scenario; optimal allocation; end-use
sectors
Analysis of the effect of environmental policies on the
allocation of natural gas accross end-use sectors in France
+Edi Assoumou*, Nadia Maïzi*
+ This research was supported by the Modeling for sustainable development Chair, led by MINES
Paris-Tech, Ecole des Ponts ParisParis-Tech, AgroParisParis-Tech, and ParisParis-Tech, supported by ADEME, EDF, RENAULT, SCHNEIDER ELECTRIC and TOTAL.
* MINES ParisTech, Centre for Applied Mathematics - Rue Claude Daunesse - 06904 Sophia Antipolis edi.assoumou@mines-paristech.fr - nadia.maizi@mines-paristech.fr
1 Introduction
1.1 The rising role of natural gas
Natural gas is a relatively abundant fossil fuel with 167 Gtoe proved reserves worldwide [BP stat 2010]. It is also a versatile energy resource that can be directly used in diverse end-use appliances to supply various energy services or as input fuel for the energy sector. Gas-fueled processes generally have higher efficiencies than their coal or oil counterparts, and very advanced technologies have been developed, such as condensing boilers and the combined cycle. Furthermore, prior to 2008, natural gas prices on inter-national markets were historically relatively low [IEA]. As a result, the total primary supply of natural gas in the world has multiplied by 2.5 since the first oil crisis, taking its share from 16% in 1973 to 20.5% in 2007 [IEA]. This increasing role in the primary en-ergy supply is one of the most noticeable trends of today’s enen-ergy systems. Oil and coal still provide most of our energy needs and together account for 60% (with respectively 34.6% and 26%) of the world primary energy supply. The lower carbon content of natural gas per unit of energy and its easy substitutability with other fossils thus make it a stra-tegic fuel to tackle both the climate change issue and reduce the world’s oil dependency through diversification. The role and contribution of natural gas is hence a key element in the design and analysis of future energy and environment policies.
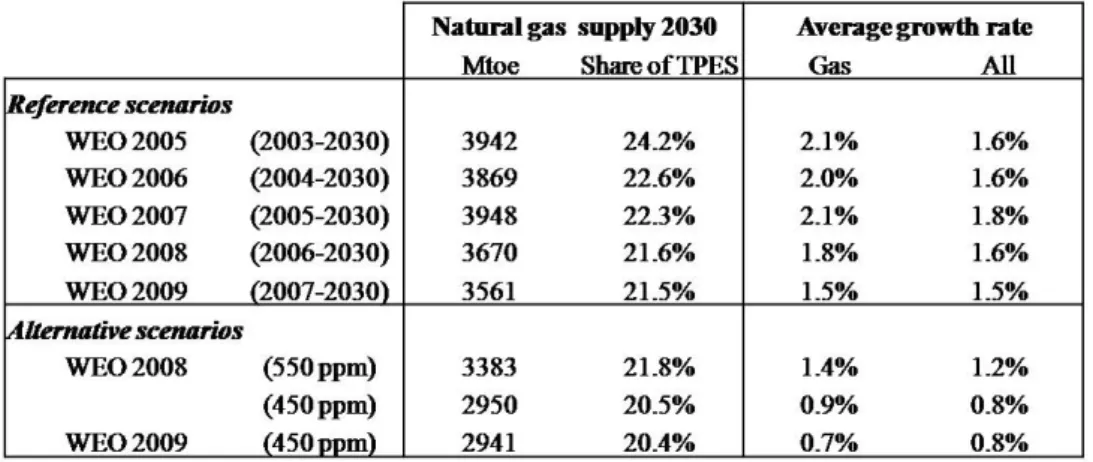
The World Energy Outlooks, which are published annually by the International Energy Agency, can help give a picture of potential medium-term, world-scale developments for the natural gas industry. The future contributions of natural gas outlined in the past five World Outlooks produced by the International Energy Agency [IEA WEO] are sum-marized in Table 1. Natural gas has almost always been expected to grow faster than, or as fast as, the total primary energy supply. Its share should vary slightly around 21-22%. However, in the case of stringent environment policies, while the upward trend is pre-served, the growth rates as foreseen in the reference projections could be halved and its absolute supply reduced by 20%.
Table 1. Gas market share and growth rate in IEA WEO 05 to 09 1.2 Literature review of natural gas related prospective issues
Adjusting to the increase in current and projected demand represents a big challenge for the natural gas industry as a whole. A first important concern addressed in literature is
the availability of natural gas and its energy security implication. According to official statistics [BP], the world reserve to production ratio of natural gas is 62.8 years against 45.7 years for oil. In fact, new discoveries have helped stabilize this ratio at around 60 years since 1980. Non-conventional gases are expected to play a major role in the mid-term. They could represent for instance 34% of US gas production in 2035 [eia 2020] and more exploration and probable discoveries can be expected in other regions of the world. One short-term effect could even be an excess, prompted by increased produc-tion of non-convenproduc-tional gas producproduc-tion in the US over recent years and reduced de-mand due to the economic crisis. Furthermore, in the longer run, methane hydrates could eventually extend the accessible natural gas reserves much further [Löwner et al. 2007] [Demirbas2010ab].
We could thus have plenty of gas. However, unlike oil, natural gas is a less globally trad-ed commodity and its markets are mostly regional. Europe is a significant gas consumer but has limited reserves. A 57% level of import dependency (2006), combined with the two Russia-Ukraine gas crises in 2006 and 2009, have put supply security at the top of EU member states’ energy agendas. Several studies have focused on the security of natu-ral gas supply in Europe.[Aguilera 2010]questions the quantity of underground gas that Europe ultimately possesses. He tackles dependency from a geological endowment point of view, and proposes a better assessment of both Europe’s discovered and undiscovered reserves. According to this study, existing gas endowment figures for Europe only cover 20% of the 62 identified petroleum provinces. Adjusted estimates could then increase the European endowment by more than 75%. Hence, Europe’s absolute geological limit is expected to be higher. This gas is obviously not readily available and several barriers and global competitiveness issues could postpone exploration, production and commer-cial supply.
Thus departing from an absolute endowment point of view, supply security is commonly taken to be security of already known and proven supplies. Most authors then address gas availability and security issues from the perspective of current gas markets and the geo-graphical distribution and evolution of proven commercial reserves. For the European Union, the largest gas importers are Russia (41%), Norway (21%), and Algeria (18%). Given its share, Russia has naturally attracted a lot of attention. A discussion of the EU-Russia natural gas relationship and the reality of the associated market power risks can be found in [Finon and Locatelli 2008]. They argue that although energy dependence is high, there is no real evidence of a strong economic risk associated to Russia’s potential market power. There is also a lot of gas not too far from Europe’s eastern border in the Caspian region. [Erdogdu 2010ab] discusses the strategic opportunity for the EU of ac-cess to natural gas from the Caspian region without going through Russia. The Nabucco gas pipe project is defended, which will make the Republic of Turkey the main transit point to Europe. The complexity of the security issue is illustrated by the fact that in such a case, Russia would be less dominant, but there would be a need to establish trustworthy commercial relations with Turkmenistan, Iran, and Iraq.
Can the second largest EU importer supply more gas? In [Söderbergh et al. 2009] the possible increase of importation from Norway is investigated. Using a bottom-up evalu-ation of Norwegian gas fields, as well as data for known and undiscovered reserves, they estimate that natural gas production could increase by 25% and peak between 2015 and 2020. However, it would then decline and be below today’s levels between 2030 and
2040. An increase of Norway’s supply can thus only be a temporary solution. Finally, [Remme et al. 2008] conduct a model-based analysis of natural gas accessibility for Europe. Reserves and existing or planned pipelines and liquefied natural gas (LNG) transport infrastructures that can satisfy a European demand are modeled. They illustrate the interdependency of European demand levels, gas prices, reserves in the North, East and South of Europe and infrastructure. Part of their conclusions illustrates increased dependency on Russian pipeline infrastructure rather than on Russian gas.
Questioning availability and access to cost-effective resources leads us to the next step of the gas supply chain, and to the strategic nature of some infrastructures. LNG termi-nals come into this category. They are important assets for making natural gas a more globally traded commodity and lessening some regional security concerns. [Dorigoni and Portatadino 2008] [Kavalov etal. 2011] discuss LNG’s importance and development in Europe, while [Shi et al. 2010] and [Ruester et Neumann 2008] show their signifi-cance for the United States and China. At world level, LNG’s share could be around 15% [Egging et al.2010ab] of all natural gas supplies by 2030, and for Europe as a whole it could represent 20% to 23% [Lise et al 2008ab].
Another strategic infrastructure in the natural gas industry is the availability of storage sites. Gas demand is very seasonal, and supply flexibility is especially important for re-gions or countries with high import dependency. During the Russian-Ukraine 2009 crisis, storage played a key role in European countries’ response [IEA WEO], and impacts were harder on countries possessing less storage. [Höffler and Kübler 2007] use an account-ing approach to assess the need for additional storage capacity in North-West Europe. They find a storage gap equivalent to 25% (10.2 billion cubic meters) of existing stor-age capacities by 2030 in their central estimate, and 3 times more in volume if strategic storages are made compulsory. [Joode and Özdemir 2010] improve this study by differ-entiating seasonal variations across final demand sectors and also consider flexibility in supply such as unused pipeline capacity or LNG. Their model shows approximately 20 billion cubic meters of additional storage capacity requirements and a contribution of storage to flexibility that reaches 68% in 2030 as domestic production declines.
1.3 Natural gas end-use issues: scope of the study
While a significant number of papers have focused on upstream activities of the natural gas supply chain i.e. resource availability and specific infrastructure issues, less atten-tion has been paid to end-use issues and competitive allocaatten-tion between end-use sectors. This can be explained by the fact that the main concern with the continuation of today’s trends is a growing aggregated demand and pressure upstream. The year 2030 is also a commonly chosen end of period that suits analyses focusing on effectively identified infrastructure and supply development projects. But as shown in Table1 at a global scale, environmental policies can significantly reduce predicted growth rates for natural gas. Furthermore, since natural gas is a carbonated resource, its comparative environmental advantage reaches a limit with ambitious mitigation targets. In this regard, the time horizon needs to be extended, since moving toward a low carbon future will require increased mitigation efforts over time. IPCC reports and European Union and French climate targets advocate ambitious objectives for 2050 at different institutional levels. How much natural gas will be needed? For which end-use will it be the most appropriate
at this horizon? Is this industry on a long-term growth pattern and what are the technol-ogy challenges?
In this paper, we analyze the prospects for natural gas in French demand sectors, with a particular focus on the effects of stringent environmental policies on allocation across sectors. With a consumption of 40 Mtoe, France is the 4th largest natural gas market in
the EU. Gas also represents 14% of its existing storage capacities. In line with the ob-servable global trend, primary use of natural gas has increased significantly over recent decades in France. Consumption tripled between 1973 and 2006, and the gas market share rose from 7% to15% of primary supply. However, its end-uses differ markedly. Sales to industrial, tertiary and household sectors represent approximately 90% of the natural gas market in France but only 42% at global level, where consumption for elec-tricity production represent the largest single market with 40%. The specific research question we address here is how natural gas consumption in France might evolve in the different end-use markets with and without environmental policies. The implication for technology and sensitivity to gas prices are evaluated. Section two presents our assess-ment framework. This begins with an overview of natural gas industrial developassess-ment and energy use, both in the past and regarding new emerging trends. A model of the French energy system is used to compute possible numerical evolutions of the use of natural gas. The model and the main assumptions impacting the analysis are then presented. In section three, scenarios and results are discussed for different types of environmental policies by2050. Then in section four, a sensitivity analysis on the effective development of a key technology path is conducted: natural gas vehicles and biomass gasification ap-pear as decisive options. Eventually, natural gas import prices assumptions are discussed in section five.
2 Assessment framework
2.1 Natural gas in the French energy system
2.1.1 Natural gas during the first French energy system transformation
Over the past four decades, the French energy system has experienced a deep transforma-tion in the structure of its primary energy supply.
The best-known development is the very fast growth of nuclear power. During this pe-riod, nuclear power’s share of primary supply has almost multiplied by 20, rising from a marginal 2.2% in 1973 to 41% in 2006. But at the same time, the contribution of natural gas also doubled, to reach 15% today. Three sub-periods can be identified in this in-creased use of natural gas. From 1973 to 1990, the average annual growth rate was 4.2%. Over the following 10 years, it went down only slightly to 3.9%, but since 2000, the yearly increase has dropped to 0.9%.
At the same time, the industrial organization of energy markets also experienced very important changes that need to be taken into account. After the Second World War, two state-owned monopolies, Electricity of France (EDF) and Gas of France (GDF), were created to support reconstruction by implementing the centrally planned energy policy. They were assigned separate mandates for the development of natural gas and nuclear uses. This industrial structure supported the impressive transformation that occurred. Meanwhile, from 1985 to 2000, oil prices were low again, domestic gas reserves were depleted, and climate change became an important issue, with the Rio conference in 1992, the initial adoption of the Kyoto protocol in 1997, and finally the EU directives for liberalizing electricity markets (1996) and gas markets (1998). From this busy period on, the key concerns for modern energy market analysis were concretely stated, from the depletion of European resources to competitive markets and climate change.
2.1.2 The modern energy era
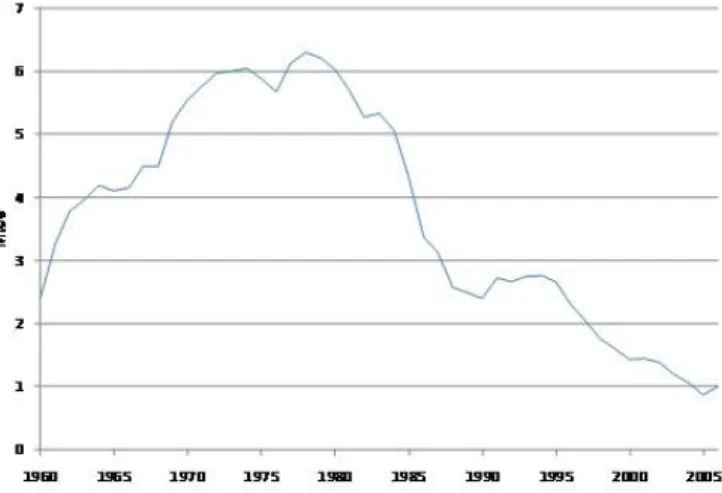
Following the liberalization of energy markets, previously vertically integrated monopo-lies were dismantled, and transport and distribution activities were separated. In this new energy context, the most noticeable evolutions in the natural gas industry supply are a decrease in national production, increased imports to meet demand, and the construction of LNG terminals. As illustrated in figure 2, French natural gas resources are almost fully depleted, and import dependency is extremely high, reaching 97% in 2006 against 52% in 1973. There is renewed hope in exploration for unconventional gas following the posi-tive US experience, but supply strategy is still strongly oriented toward diversification of partners and entry points.
With4668 km of coastline and several important commercial ports, LNG has naturally emerged as an important element in France’s future gas supply strategy. In 2007, the two operating LNG terminals accounted for 25% of all gas imports for a global regasification capacity of 15.5 billion cubic meters annually. The new Fos-Cavaou terminal commis-sioned in 2010 increases this capacity to 23.7 billion cubic meters. In addition, other projects have been proposed that could potentially bring the cumulative capacity to 74 billion cubic meters [rapport methanier] by 2015.There is, however, active opposition from local environmental associations, and securing administrative authorization is a critical first step. In 2009, a terminal in Verdon with a projected capacity of 6 to 9 billion cubic meters, failed to obtain authorization to initiate its construction phase, which was postponed indefinitely.
On the demand side, an exceptional 4.3% decrease was observed between 2008 and 20091
[a]. Rising fossil and gas prices have slowed down the growth rate of natural gas sales since 2006, but this sudden evolution is however a probable short-term consequence of the global economic crisis and the reduction of industrial output. For the medium to long term, two new trends can however be clearly outlined in the development of alternative natural gas markets for electricity and hydrogen production. In the electricity sector, en-vironmental concerns are the main driver. The EU emission trading system and the antic-ipation of tighter conditions in the future induce a shift from coal to gas in power plants. As a result, there is an unprecedented boom in the number of requests for combined cycle constructions and operation licenses [PPI] [RTE].The second trend is related to natural gas use as an input in chemical processes, and interestingly to expected evolutions of crude oil supplies characteristics. Using a reformer, natural gas can be used to produce hydrogen, which is itself used in refineries to remove sulfur by hydro desulphurization. Refineries’ increasing demand for natural gas thus appears to be a response to higher sulfur content in available crude oil and to the evolution of transport fuel specifications.
2.2 The Bottom-up TIMES-FR model 2.2.1 Modeling framework
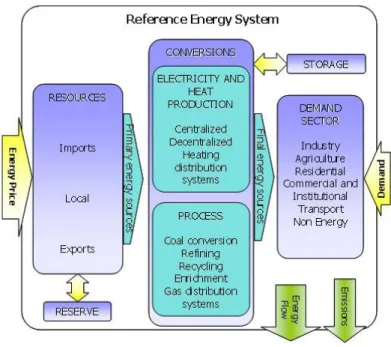
Our analysis is based on TIMES-FR, a bottom-up optimization model of the MARKAL/ TIMES family of energy models [Berger et al, 1992] [Loulou et al, 1996] that have been developed since the mid-eighties [Fishbone and Abilock, 1981] under the auspices of the International Energy Agency. The basic principle of the model is a large linear optimiza-tion of substituoptimiza-tion possibilities in the energy system between explicit technologies and commodity flows under constraints. The TIMES-FR model is the specific TIMES model developed to describe the French energy system. Its functioning is illustrated schemati-cally in figure 3. Prices for primary energy resources and sectoral demand characteristics are incorporated in the sequential description of all the transformation steps, from initial access to primary resources, and conversion towards secondary energy carriers, such as transport fuels, electricity or heat, to the supply of requested energy services. The frame-work is thus technology-rich, with actual or envisaged transformation nodes explicitly described as technologies also producing and consuming explicit commodity flows (en-ergy, materials, and emissions).
Figure 3. The TIMES-FR modeling structure
Two basic mechanisms ensure that the linear structure remains consistent over succes-sive time periods: a) flow equilibrium conditions, which impose that for each flow rep-resented production matches the consumption b) capacity transfer over time according to the commissioning date and lifetime of technologies. Building on its detailed bottom-up architecture, the model maximizes the total discounted surplus over the period 2000-2050 in an inter-temporal optimization framework. As a result of this optimization step, all non-zero variables in the solution quantify the levels of energy resources, emissions, and technologies that are effectively used from the total available set of possibilities modeled. Because of the central planner and perfect foresight assumptions, such opti-mization frameworks are suitable for prospective analyses. A similar approach has been used by [Remme et al. 2008] to analyze natural gas supply security for Europe and to explicitly describe technology based links (Pipelines or LNG) with gas-producing coun-tries.
2.2.2 Key technology and fuel price assumptions
The model computes an optimal resource and technology allocation. In this process, as-sumptions on fossil fuel prices and technology availability play a decisive role. Our ref-erence price assumption is chosen to be consistent with the moderate future natural gas price paradigm used in two reports issued by government agencies. The official French reference forecast for 2030 used fixed prices for oil at 70$/boe and natural gas at 7$/ MBTU for its projection, while in a second report, [Quinet 2009] price evolutions from the World Energy Outlook 2007 were selected. Our reference fossil price assumption is hence a linear continuation of the WEO 2007 trend up to 2050. However, since import prices are likely to be critical for cross-sector gas allocation, higher price assumptions will also be considered in section 5.
Table 2. Key assumptions
The second set of important assumptions concerns nuclear power and carbon capture and storage. These provide CO2-free electricity production, and while their pure theoretical potential is almost unbounded, their development potential is limited here. Nearly 80% of French electricity production relies on 63 GW of nuclear power plants. With a higher average plant size, this capacity could in theory exceed 90 GW without building any new plants, and reach more than 100 GW with new constructions. However, since all exist-ing reactors are to be decommissioned before 2050, the required development program would be of the same order of magnitude as the centralized program implemented in the 1970s. The future expansion of existing capacity thus mainly raises issues of accept-ability and will largely be a political decision. The hypothesis made in the 2008 official reference projection was to stabilize the installed capacity at around 65 GW. Our analysis keeps this value as a ceiling with a maximum nuclear capacity of 65 GW.
Implementing carbon capture and storage (CCS) technologies is a promising way to en-sure cleaner fossil fuel burning power plants and energy intensive industries. Absolute geological storage capacity is high. The potential for CO2 storage in France’s depleted oil and gas fields alone is around 425 Mt CO2 and could reach 26Gt if aquifers are consid-ered. Using a set of CO2-emitting sites, the French SOCECO2 research project [Michel et al 2009] reported ranges of effective annual CO2 storage potentials of between 33 Mt and 54 Mt in 2020 and 40 to 66 Mt for 2050. The technologies are however still at develop-ment or pilot phase and effective commercial developdevelop-ment is not foreseen before 2020. The goal of the only French operational pilot, in Lacq, is very limited in terms of storage volumes. This pilot, launched in 2010, is expected to capture 75 ktons of CO2 annually. After 2 years of injection, a 3-year surveillance phase is scheduled before making any decisions on further injections. There is no other advanced storage project, and realistic short- to medium-term development prospects in France are therefore low. Our refer-ence assumption is an upper limit of 1.5 Mt CO2 sequestrated in 2020, increasing to a maximum 40 Mt CO2 in 2050. This 2050 maximum is still equivalent to several hundred Lacq-size individual projects, or 40 Sleipner-size projects.
3 Projections of natural gas allocation under environmental policies 3.1 “Reference”, “Measures” and “Target” scenario definition
A reference scenario is first described as a basis for comparison. It depicts a reference situation where no environmental measures are adopted. Its sole objective is to minimize
the cost of meeting energy service demands. Two additional scenarios then investigate different formulations and intensities of environmental policies. In the first of these, a differentiated approach is applied and specific measures are separately implemented in each end-use sector.
The overall environmental policy is hence a compilation of these sector measures. For electricity production and industry sectors, their energy-related decisions are made with-in a global emission tradwith-ing system, represented here as a CO2 price and introduced in the model simply as an equivalent carbon tax. A fixed 30€/tCO2 penalty is applied.
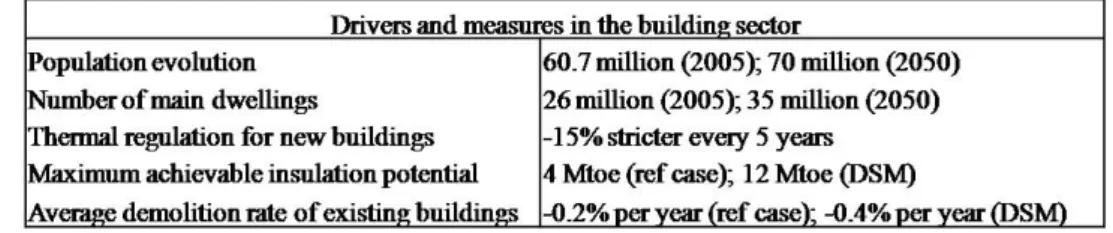
For the building and transport sectors, specific demand-side measures are implemented. Useful energy service demand in the building sector is driven by the evolution of popu-lation and households, and improvements in envelope characteristics i.e. thermal regu-lation and demolition rate. The main demand-side measures in this sector concern the improved thermal efficiency of existing and less efficient building stock through higher insulation levels and demolition rates.
In the transport sector, the mobility demand in passenger.km (p.km) per household in-creases slowly at 0.2% annually from 32.5 thousand p.km to 36.2 thousand p.km. With the increased number of households, the demand for mobility services then evolves from 850 to 1260 million p.km. Goods mobility increases at a 1.02 annual rate over the period. Demand-side measures in the transport sector presume a transformation of the modal split toward a reduction of the market share of personal vehicles and road transport. The selected bottom-up drivers and the differences in assumptions are reported in table 4 and 5.
Table 3. Demand drivers and energy-saving measures in the building sector
Table 4.Evolution of modal splits in the transport sector
The second type of environmental policy considers a global CO2 mitigation target for all sectors without distinction. A domestic reduction of 20% in 2020 and 60% in 2050 in relation to 1990 is evaluated. In comparison, the EU minimum climate target is a 20% reduction in 2020 followed by a 60% reduction in 2050 in relation to 1990. This goal could be made more ambitious in the case of significant actions worldwide, taking it to
30% in 2020 and 80% in 2050. The different scenarios are referred to as “Reference”, “Measures” and “Target”. For all scenarios a 4% discount rate and a 1.2 euro/dollar ex-change rate are assumed.
3.2 Prospects for the evolution of natural gas allocation with environmental policies
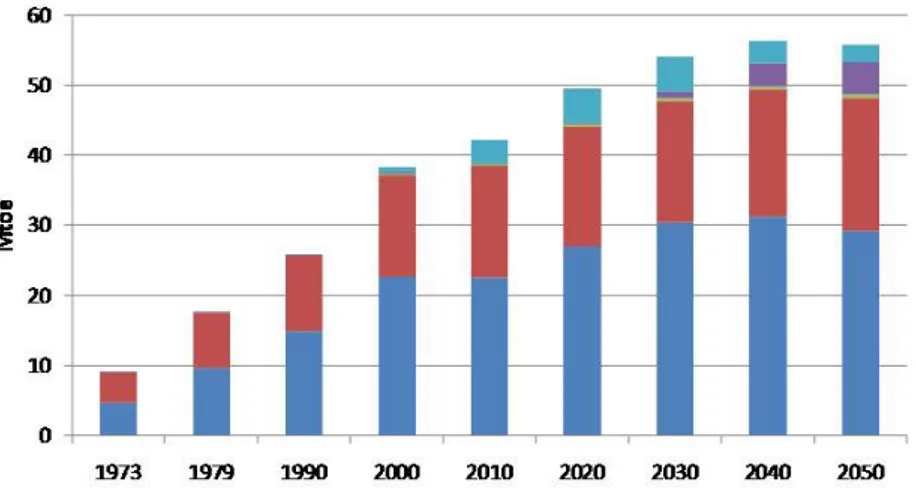
The TIMES-FR model is used to compute the energy system’s evolution over 50 years. Table 5 reports the natural gas demand levels and average growth rates for the different end-use sectors in 2020 and 2050. In the reference scenario (Figure 4), the total demand for natural gas reaches 55.7 Mtoe in 2050. Between 1990 and 2000, the statistically ob-served annual increase was 3.9%; this is successively reduced over the modeling horizon to 1.2% between 2000 and 2020, 0.9% until 2030, 0.4% for the following decade, and -0.1% between 2040 and 2050. As a consequence, the natural gas industry experiences an overall 45% increase in volume over the model period. At the same time, the share between end-uses is also modified, with an increased contribution from the new gas markets, i.e. transport and energy production by utilities, which represent 12.7% of total natural gas consumption in 2050 against 2% today.
Figure 4. Evolution of natural gas consumption and allocation in the ‘Reference” scenario
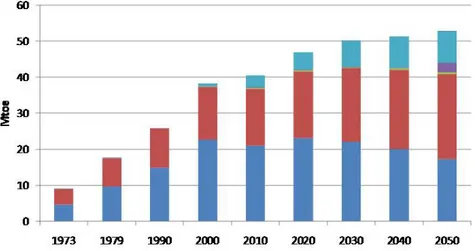
The projected expansion of the natural gas industry appears to be very sensitive to the implementation of environmental policies, and when such policies are considered, the average annual growth rate over the period is significantly reduced from 0.75% to 0.65% with sector specific measures alone, and to just 0.16% with the more ambitious global approach. In the “Measures” scenario, the demand for natural gas from traditional build-ing and industrial markets stabilizes close to its 2020 level (Figure 5). In the industrial sector, the CO2 penalty plus substitution for coal and oil heaters lead to a 61% increase compared to the year 2000 and a final gas consumption of 23.5 Mtoe in 2050.This grow this compensated by a strong reduction in the building sector, where improved insula-tion and more stringent thermal regulainsula-tions for new buildings bring natural gas demand to 23% below its 2000 level. Under these conditions, the contribution of new gas uses nearly doubles to represent 21.6% of the total in 2050. However, while the CO2 penalty
favors natural gas use in combined cycles in the energy sector, measures in the transport sector reduce demand for natural gas in transportation.
Figure 5. Evolution of natural gas consumption and allocation in the ‘‘Measures” scenario
When a global environmental policy is implemented aiming at 20% and 60% domestic reduction of energy-related CO2emissions in 2020 and 2050 respectively (Figure 6), 22% less natural gas is consumed than with the selected measures approach. At the end of the period, total demand thus returns to its current level, but the allocation across sectors has dramatically changed.
The amount of natural gas used by traditional end-use markets decreases to 0.4% an-nually before 2020 and 1.9% after. This a clear inflection of the trend observed in the past 40 years. The reduction is particularly marked in the residential and tertiary sectors where gas demand drops back to its 1970 levels. This bell-type curve running over 80 years will represent a big challenge for the natural gas industry, since its largest market today with a 59% market share will only represent 6.4% at the end of the period. The existing natural gas network is tailored to meet highly dispersed demand in individual or collective dwellings. An issue not formally addressed here will then be optimizing the distribution network and in particular managing the overcapacity that will result from this drop in demand. The practical operation of seasonality may also be affected, since demand in the residential sector has the highest seasonal variability. The industry sector resists better, thanks to the substitution of coal and oil products and the sector’s greater inertia induced by longer lifetimes for industrial heaters (30 to 35 years).
The decline of traditional markets creates a transition period for the gas industry, with the total volume of natural gas contracting to 35 Mtoe between 2030 and 2040.The sub-sequent return to total gas demand at current levels is then greatly supported by the development of new gas markets, which represent 53% of the total in 2050. The fastest growth is experienced by its use as an alternative fuel for transportation. At the end of the horizon, the volumes redirected towards this new market would reach 16.3 Mtoe.
Figure 6. Evolution of natural gas consumption and allocation in the ‘Target” scenario
Table 5. Natural gas allocation for the “Reference”, “Measures” and “Target” scenarios
4 Critical technology paths for the development of the new natural gas markets
New gas markets hence have the potential to play an increasing strategic role in the fu-ture expansion of the natural gas industry in France. However, since they do not have a captive market, the development of those new uses will be conditioned by their relative advantage against other technologies. In this section we investigate the technological dependency of the development of natural gas use for energy production by utilities and as alternative transport fuel under environmental policies.
4.1 Natural gas as an input in the energy sector
between available primary energy sources and their associated transformation technolo-gies. Figure 7 describes the fuel/technology competition for non-nuclear production in the three scenarios. With an average 70TWh of net exports, France has historically been the largest electricity exporter in Europe. This situation has of course been possible due to nuclear overcapacity and a low marginal production cost. With increased demand and the restrictions on nuclear expansion, the level of electricity exported is a key factor the environmental policy. Its evolution is hence also shown.
Figure 7.Allocation of natural gas as an input in non-nuclear electricity production
The use of natural gas as an input for power plants reaches 3.8 Mtoe in 2030 and then decreases to 1.8 Mtoe by 2050 in the reference scenario. After 2020, restrictions on further nuclear expansion coupled with the decline of existing thermal electricity pro-duction and growth in demand induce a need for cheap base load electricity propro-duction. When there are no environmental constraints, supercritical and internal gasification coal power plants (IGCC) are preferred and electricity exports remain at their current high level. A penalty on CO2 emissions from the industrial and electricity sectors results in the reduced cost competitiveness of coal. The direct effect is a strong increase in natural gas use at 6.2 Mtoe and 8.2 Mtoe in 2020 and 2050 respectively. A second indirect but significant effect is the observed reduction of the quantity of electricity exported at 44 TWh against 70 TWh at the end of the horizon. Meeting a more stringent global CO2 target induces a new fuel/technology choice that does not favor natural gas but tends in particular towards renewable and biomass energy sources. IGCC plants are then installed but biomass is used as feedstock. In 2050, the contribution of natural gas is limited to 4.73 Mtoe, of which 64% is burnt in power plants equipped with carbon capture and sequestration (CCS). Finally, electricity exports are drastically reduced after 2030 and ultimately end by 2050.
These results show the role CCS plays in natural gas competitiveness under strong miti-gation targets.
They also illustrate the long-run competition with synthetic gas produced using gasifica-tion technologies. The likelihood of this latter competigasifica-tion is to be considered in light of its current state of maturity. For the period 1990/2013, data from the world gasification database [GTC], table 6, show cumulative capacities of 7.76 GW for gasification-based power plants that are planned or have been installed worldwide. Coal is the main feed-stock with 51.7% of the cumulative capacity followed by petroleum (25%) and petro-leum coke (20.5%). Biomass only accounts for 1.7% of the world total and is essentially used in Europe where its share is 4.4%.
Table 6.Cumulative capacities of power plants with gasification (source World gasification database)
Gasification technology associated with power production is already implemented but as yet no installations are reported for France. Furthermore, current public support for wood-based electricity production only concerns combined heat and power plants (CHP). The dependency of the development of natural gas used as an input in the energy pro-duction sector, for biomass gasification, is therefore estimated with an additional global target scenario where biomass-powered IGCC technology is not allowed. The result is the wider use of natural gas as an input in combined cycle plants, with CCS at 8 Mtoe in 2050 (Figure 8). The reduction of electricity exports also occurs earlier in 2030. Finally, the total use of natural gas increases by 8% at 44.8.
Figure 8. Allocation of natural gas as an input in non-nuclear electricity produc-tion: “TARGET” and no IGCC Wood
Table 7 Natural gas allocation for the “TARGET” scenario with no wood IGCC 4.2 Natural gas use for transport as a new market
The use of large quantities of compressed natural gas (CNG) as an alternative transporta-tion fuel is another major evolutransporta-tion outlined in the global CO2 mitigation scenario. With a reported 11.3 million vehicles fueled by natural gas in the world in 2009, the technol-ogy is well known and fairly mature. The fastest growth rates are observed in Asia and South-America. It is also being increasingly promoted in Europe, where since 2000 the number of CNG vehicles has increased from 0.36 to 1.31 million. Almost half of this stock is in Italy, and only 12,500 vehicles are reported in France. Here again, despite its relative maturity on a world scale, effective policy support in France is low. More emphasis is put on developing electricity as an alternative transport fuel. The most com-mon argument is that switching from oil to natural gas in transport will generate new energy security issues. A second argument is that French car manufacturers do not have a leading position in the gas vehicle market, which has historically been developed in gas-producing countries. Our previous results limit the argument of an increased energy security risk by showing that under environmental policies total consumption does not increase rapidly. Moreover, development for transportation could be critical for the gas industry to reach a strong global target. To investigate how dependent natural gas pros-pects are on its effective development in the transport sector, an additional scenario is simulated with no acceptance for natural gas in the transport sector.
Table 8 Natural gas allocation for the “TARGET” scenario with no acceptance in the transport sector
On a global scale, Table 8, there is no compensation by the development of gas consump-tion in other markets, and the total consumpconsump-tion in 2050 is reduced by 43% compared to the “TARGET” scenario, and the gas industry is only 2 Mtoe above its 1990 volume. Figure 9 gives greater insight into the changes in final energy consumption for transpor-tation. Meeting ambitious global CO2 mitigation targets with a growing mobility demand requires both energy efficiency and significant modification of the fuel mix.
Figure 9. Evolution of the energy mix in the transport sector
When gas vehicles are available, the contribution of refined petroleum products decreas-es dramatically from 88% in 2020 to 18% in 2050. Biofuels are increasingly used and ac-count for 27.4% of total fuel consumption. Liquid fuels thus remain dominant but natural gas becomes the most significant single source, with a market share of 41%. Natural gas engines represent a low cost emission reduction option, since they are identical in their principle to regular oil internal combustion engines while allowing for up to 20% less CO2 per unit of energy. Electricity also sees a significant increase, and represents 13.6% of the total. When there is no acceptance for gas as a transport fuel, more oil and electric-ity are used in the transport sector. The reduction of oil’s market share is limited to 45% while electricity’s share increases to 26%.
5 Sensitivity to higher fossil fuel prices
Finally, we investigate the previous scenarios’ sensitivity to higher fossil fuel price as-sumptions. In the past five years, oil, gas and coal markets have experienced significant price volatilities, and this greater short-term variability has also been echoed in long-term price assumptions retained for prospective studies. Once again, the successive IEA World Energy Outlook publications are valuable sources. Between 2006 and 2009,oil price assumptions have successively been revised in the four outlooks from 51$/bar-rel to 103$/bar51$/bar-rel for the year 2010 and from 55$/bar51$/bar-rel to 105$/bar51$/bar-rel for 2030. The average international crude oil price [IEA oil market report august 2010] is around 80$/ barrel today. To estimate natural gas allocation’s sensitivity to higher import prices, the previously simulated scenarios are now run with WEO 2009 price assumptions which are linearly extended to 2050 (Table 9).
Table 10. Effect of higher prices on natural gas consumption and allocation
Environmental policies have the effect of less natural gas. As shown in Table 10, the impact of higher gas prices is significant and ranges from a reduction of 8% to 17% in total natural gas use in 2020 to a reduction of 5% to 21% in 2050.Nevertheless, no simple and common direction of evolution at sector levels can be identified. In 2020, the most noticeable phenomenon is a positive impact on the transport sector and negative impacts in other sectors. The main reason for this is that with the general increase of all fossil fuel prices, the absolute cost differential between oil and natural gas is also increased, mak-ing natural gas a more competitive transport fuel. In the “Tax & DSM” scenario, the very high multipliers reflect the fact that the system moves from the low use of CNG vehicles to their major role and higher fossil fuels prices.
Figure 10. Effect of higher fossil fuel prices: “MEASURES”
In 2050, energy production is the sector with the greatest potential for further natural gas reduction and is the most consistent across scenarios. The principal reason for this high-er sensitivity is competition with CCS and othhigh-er synthetic gases as illustrated previously. Combined cycles have a low share of capital investment cost and their competitiveness depends heavily on input fuel costs.
Figure 11. Inputsinnon-nuclear electricity production: “TARGET” and no IGCC wood
The possible choices are therefore whether or not to introduce gasification steps involv-ing a reduction in efficiency, and whether or not to use CCS, also with some reduction in efficiency loss in plants and an energy penalty for compression and injection. This is well illustrated and somehow exacerbated in the scenarios where no biomass gasifica-tion is allowed; reducgasifica-tion of natural gas use for the power producgasifica-tion sector then reaches 74%. As shown in Figure 11, with higher fossil fuel prices, coal IGCC with CCS and biogas CHP are the preferred technologies.
6 Conclusion
Japan nuclear catastrophe has reinforced the leading position vision of natural gas as the cleanest fossil fuel. A deeper study shows that natural gas market evolution shares varies widely with the formulation of environmental policies.
And namely, the strongest shift from natural gaz traditional markets to new opportunities (transportation and energy for industry) comes when strong environmental target have to be reached.
Shale gas may become the referee for the future of natural gas: it will drive the prices and the environmental impacts which will foster cleaner properties of the upstream for conventional gas.
7 References
[IEA] Energy Information Administration / Annual Energy Outlook. 2009.
[IEA WEO] past five World Energy Outlooks of the International Energy Agency: 2005 to 2009.
[BP] BP Statistical Review of World Energy. 2010.
[Löwner et al. 2007] Ralf Löwner, Georgy Cherkashov, Ingo Pecher, Y. F. Makogon: Field Data and the Gas Hydrate Markup Language. Data Science Journal 6: 6-17 (2007). [Demirbas 2010ab] Demirbas, A., 2010a. Methane hydrates as potential energy resource: Part 1-Importance, resource and recovery facilities. Energy Conversion and Management 51, 1547-1561.
Demirbas, A., 2010b. Methane hydrates as potential energy resource: Part 2-Methane production processes from gas hydrates. Energy Conversion and Management 51, 1562-1571.
[Aguilera 2010] Aguilera, R.F., 2010. The future of the European natural gas market: A quantitative assessment. Energy 35, 3332-3339.
[Finon and Locatelli 2008] Finon, D., Locatelli, C., 2008. Russian and European gas in-terdependence: Could contractual trade channel geopolitics? Energy Policy 36, 423-442. [Erdogdu 2010ab] Erdogdu, E., 2010a. Bypassing Russia: Nabucco project and its im-plications for the European gas security. Renewable & Sustainable Energy Reviews 14, 2936-2945.
Erdogdu, E., 2010b. Natural gas demand in Turkey. Applied Energy 87, 211-219.
[Söderbergh et al. 2009] Soderbergh, B., Jakobsson, K., Aleklett, J., 2009. European energy security: The future of Norwegian natural gas production. Energy Policy 37, 5037-5055.
[Remme et al. 2008] Future European gas supply in the resource triangle of the Former Soviet Union, the Middle East and Northern Africa Volume 36, Issue 5, May 2008, Pages 1622-1641.
[Dorigoni and Portatadino 2008] Dorigoni, S., Portatadino, S., 2008. LNG development across Europe: Infrastructural and regulatory analysis. Energy Policy 36, 3366-3373. [Kavalov et al 2011] Boyan Kavalov, Hrvoje Petric, Evangelos Tzimas. Evolution of the indigenous European oil and gas sources - Recent trends and issues for consideration, Energy Policy, Volume 39, Issue 1, January 2011, Pages 487-492.
[Shi et al. 2010] Guo-Hua Shi, You-Yin Jing, Song-Ling Wang, Xu-Tao Zhang. Development status of liquefied natural gas industry in China. Energy Policy, Volume 38, Issue 11, November 2010, Pages 7457-7465.
[Ruester et Neumann 2008] Ruester Sophia; Neumann Anne; The prospects for liquefied natural gas development in US. Energy Policy Volume: 36 Issue: 8 Pages: 3160-3168, 2008.
[Egging et al. 2010ab] Egging, R., Holz, F., Gabriel, S.A., 2010a. The World Gas Model: A multi-period mixed complementarity model for the global natural gas market. Energy 35, 4016-4029.
Egging, R., Holz, F., Gabriel, S.A., 2010b. The World Gas Model A multi-period mixed complementarity model for the global natural gas market. Energy 35, 4016-4029.
[Lise et al 2008ab] Lise, W., Hobbs, B.F., 2008. Future evolution of the liberalised European gas market: Simulation results with a dynamic model. Energy 33, 989-1004. Lise, W., Hobbs, B.F., van Oostvoorn, F., 2008. Natural gas corridors between the EU and its main suppliers: Simulation results with the dynamic GASTALE model. Energy Policy 36, 1890-1906.
[Höffler and Kübler 2007] Hoffler, F., Kubler, M., 2007. Demand for storage of natural gas in northwestern Europe: Trends 2005-30. Energy Policy 35, 5206-5219.
[Joode and Özdemir 2010] de Joode, J., Ozdemir, O., 2010. Demand for seasonal gas storage in northwest Europe until 2030: Simulation results with a dynamic model. Energy Policy 38, 5817-5829.
[PPI] Programmation pluriannuelle des investissements 2007.
[RTE] RTE 2009, Bilan prévisionnel de l’équilibre offre demande d’électricité en France édition 09,
Rapport du Gestionnaire de Réseau de Transport d’Electricité.
[Berger et al 1992] Berger, C., Dubois, R., Haurie, A., Lessard, E., Loulou, R., Waaub, J-P., 1992. Canadian MARKAL: An advanced linear programming system for energy and environmental modelling. Information System and Operational Research Journal 30(3), 222-239.
[Loulou et al 1996] Loulou, R., Kanudia, A., Lavigne, D., 1996. GHG abatement in central Canada with inter provincial cooperation, Energy Studies Review 8(2), 120–29. [Fishbone et Abilock 1981] Fishbone, L.G, Abilock, H., 1981. MARKAL, a linear pro-gramming model for energy systems analysis: technical description of the BNL version. International journal of Energy research 5,353-375.
[Quinet 2009]Quinet, A., 2009. La valeur tutélaire du carbone, Rapport du Centre d’Ana-lyse Stratégique. La documentation Française.
[Michel 2009] SOCECO2 - Évaluation technico- économique et environnementale de la filière captage, transport, stockage du CO2 à l’horizon 2050 en France Rapport final BRGM/RP-57036-FR Février 2009.
Contact
Nadia MAÏZI
Directrice du Centre de Mathématiques Appliquées (CMA)
MINES ParisTech / CMA Rue Claude Daunesse BP 207
06904 Sophia Antipolis
Tel: +33(0)4 97 15 70 79 / Fax: +33(0)4 97 15 70 66 Courriel: nadia.maizi@mines-paristech.fr
Jean-Charles HOURCADE
Directeur du Centre International de Recherche sur l’Environnement et le Développemenr (CIRED)
CIRED
Campus du Jardin Tropical 45 avenue de la Belle Gabrielle 94736 Nogent sur Marne Cedex
Tel: +33(0)1 43 94 73 63 / Fax: +33(0)1 43 94 73 70 Courriel: hourcade@centre-cired.fr