Bistability Analyses of a Caspase Activation Model for
Receptor-induced Apoptosis*
Received for publication, May 3, 2004, and in revised form, June 18, 2004 Published, JBC Papers in Press, June 18, 2004, DOI 10.1074/jbc.M404893200
Thomas Eissing‡§, Holger Conzelmann§¶, Ernst D. Gilles¶储, Frank Allgo¨ wer‡, Eric Bullinger‡,
and Peter Scheurich**‡‡
From the ‡Institute for Systems Theory in Engineering, University of Stuttgart, Pfaffenwaldring 9, 70550 Stuttgart, Germany, the¶Institute for System Dynamics and Control, University of Stuttgart, Pfaffenwaldring 9, 70550 Stuttgart, Germany, the储Max Planck Institute for Dynamics of Complex Technical Systems, Sandtorstr. 1, 39106 Magdeburg, Germany, and the **Institute for Cell Biology and Immunology, University of Stuttgart, Allmandring 31,
70569 Stuttgart, Germany
Apoptosis is an important physiological process cru-cially involved in development and homeostasis of mul-ticellular organisms. Although the major signaling path-ways have been unraveled, a detailed mechanistic understanding of the complex underlying network re-mains elusive. We have translated here the current knowledge of the molecular mechanisms of the death-receptor-activated caspase cascade into a mathematical model. A reduction down to the apoptotic core machin-ery enables the application of analytical mathematical methods to evaluate the system behavior within a wide range of parameters. Using parameter values from the literature, the model reveals an unstable status of sur-vival indicating the need for further control. Based on recent publications we tested one additional regulatory mechanism at the level of initiator caspase activation and demonstrated that the resulting system displays desired characteristics such as bistability. In addition, the results from our model studies allowed us to recon-cile the fast kinetics of caspase 3 activation observed at the single cell level with the much slower kinetics found at the level of a cell population.
Apoptosis is a genetically defined major form of programmed cell death enabling the organism to remove unwanted cells, e.g. during embryonal development and after immune responses, to select educated immune cells and to eliminate virally infected and transformed cells (1, 2). Enhanced or inhibited apoptotic cell death can be involved in severe pathological alterations, including developmental defects, autoimmune diseases, neuro-degeneration, or cancer. Extrinsic and intrinsic apoptotic path-ways can be distinguished, although partly employing overlap-ping signal transduction pathways. A hallmark of the ongoing apoptotic process is the activation of a family of aspartate-directed cysteine proteases, the caspases. Caspases are pro-duced as proenzymes and become activated upon cleavage (3). Activation of caspases finally dismantles the cells via the cleav-age of important regulatory and structural proteins and en-ables phagocytic removal of the dying cell (4). A simplified
outline of the extrinsic pathway of apoptosis induction after death receptor stimulation is depicted in Fig. 1.
Mathematical modeling and systems theory can provide val-uable tools to get insight into complex dynamical systems, to test hypotheses, and to identify weak points (5, 6). Previous modeling approaches in apoptosis focused on the extrinsically triggered pathways, resulting in complex models (7, 8). The model parameters were fitted to data derived from cell popu-lation studies showing caspase activation in a range from 30 min to several hours. These models can describe and nicely illustrate certain aspects of the signal transduction pathway. However, more recent experimental results performed at the single cell level show that the majority of caspases are acti-vated within a very short time interval (⬍15 min) (9–12).
Obviously, the single cell level is relevant for a mechanistic understanding. With the focus on receptor-induced apoptosis, we used Monte Carlo methods to look for parameter domains that enable an appropriate description of apoptosis induction in a single cell (model based on Fig. 1, data not shown). The obtained results revealed an unexpected responsiveness of the system toward minute initiator caspase activation if required to act rapidly. This behavior of the model was caused by the caspase cascade that represents the main signaling route in so-called type I cells (13) (see Fig. 1, yellow background). We therefore translated the current picture of the extrinsically triggered caspase cascade in a very elementary form into a mathematical model enabling a thorough investigation through the application of analytical methods. Our results showed that within large parameter ranges, including values from the literature, this straightforward model structure is unable to appropriately describe the expected behavior that can be deduced from experimental data. We then showed a way of extending our model structure to reconcile these observed differences and presented a model now able to describe key characteristics like a fast execution phase and bistability. In addition, results from our model studies show a way to recon-cile the fast kinetics of caspase 3 activation observed at the single cell level with the much slower kinetics found at the level of a cell population in terms of understanding and modeling.
EXPERIMENTAL PROCEDURES
The Mathematical Model—For each reaction considered under
“Re-sults” one reaction rate can be deduced (v1–v13). The cleavage reactions (1, 2, and 4) are treated as being irreversible, and it is assumed that the intermediary cleavage products (“enzyme-substrate complexes”) only achieve very low levels and can thus be eliminated as reasonable estimations that have been confirmed by simulation experiments (data not shown). The reaction rate equations are deduced according to the law of mass action, which we here consider prior to other kinetic approaches, like Michaelis-Menten kinetics, although theoretical con-* This work was supported by Deutsche Forschungsgemeinschaft,
Sonderforschungsbereich 495, project D2. The costs of publication of this article were defrayed in part by the payment of page charges. This article must therefore be hereby marked “advertisement” in accordance with 18 U.S.C. Section 1734 solely to indicate this fact.
§ Both authors contributed equally to this work.
‡‡ To whom correspondence should be addressed. Tel.: 49-711-685-6987; Fax: 49-711-685-7484; E-mail: [email protected].
© 2004 by The American Society for Biochemistry and Molecular Biology, Inc. Printed in U.S.A.
This paper is available on line at http://www.jbc.org
36892
siderations show that the results would be very similar in our case. From this, molecular balances can be derived for each considered mo-lecular species resulting in a system of ordinary differential equations (see Equations 1– 8). Two different model structures are considered in greater detail during this study. The basic model includes the reactions 1–10 and translates into the Equations 1– 6 (not including v11in Equa-tion 2). The extended model hypothesis includes all reacEqua-tions and trans-lates into the complete equation system where v1⫽ k1[C8*]䡠[C3], v2⫽
k2[C3*]䡠[C8], v3⫽ k3[C3*]䡠[IAP] ⫺ k⫺3[iC3*⬃ IAP], v4⫽ k4[C3*]䡠[IAP],
v5⫽ k5[C8*], v6⫽ k6[C3*] v7⫽ k7[iC3*⬃ IAP], v8⫽ k8[IAP]⫺ k⫺8, v9⫽
k9[C8]⫺ k⫺9, v10⫽ k10[C3]⫺ k⫺10, v11⫽ k11[C8*]䡠[BAR] ⫺ k⫺11[iC8*⬃
BAR], v12⫽ k12[BAR]⫺ k⫺12, and v13⫽ k13[iC8*⬃ BAR]. d关C8兴 dt ⫽ ⫺ v2⫺ v9 (Eq. 1) d关C8*兴 dt ⫽ v2⫺ v5共 ⫺ v11兲 (Eq. 2) d关C3兴 dt ⫽ ⫺ v1⫺ v10 (Eq. 3) d关C3*兴 dt ⫽ v1⫺ v3⫺ v6 (Eq. 4) d关IAP兴 dt ⫽ ⫺ v3⫺ v4⫺ v8 (Eq. 5) d关C3* ⬃ IAP兴 dt ⫽ v3⫺ v7 (Eq. 6) d关BAR兴 dt ⫽ ⫺ v11⫺ v12 (Eq. 7) d关C8* ⬃ BAR兴 dt ⫽ v11⫺ v13 (Eq. 8)
The models were implemented in both Matlab (for simulation exper-iments) and Mathematica (for analytical analysis).
Initial Conditions, Parameters, and Units—The average
concentra-tions in an unstimulated cell (i.e. initial condiconcentra-tions) of caspase 8 and 3 were quantified in HeLa cells to be 130,000 and 21,000 molecules/cell, respectively, using quantitative Western blot analyses.1The average concentration of IAP(s)2
was estimated to be 40,000 molecules/cell. Other reported concentrations are 30, 200, and 30 nMfor caspase 8, caspase 3, and XIAP, respectively (14, 15). Estimating a cell volume of 1 picoliter shows that 600 molecules/cell⫽ 1 nM. Accordingly, these values are roughly in the same order of magnitude and were used as initial concentrations. The other compounds were considered not to be present in the absence of a stimulus. In the extended model, the con-centration of the newly introduced molecule BAR was assumed to be 40,000 molecules/cell. We consider the unit molecules/cell more illus-trative for cellular concentrations than the unit molar, but on the other hand we prefer and use units such asM⫺1s⫺1for the Km/kcatratios.
Table I lists the parameters as used in the “single set” simulations (unless indicated otherwise). The respective values are also provided in more common units (in brackets). For the reactions 3 and 5–10 the parameter values were taken from literature as stated in the text. The respective references are summarized in Table II. For the reactions 1, 2, and 4 values were chosen that are in accordance with the desired kinetics and the requirement for bistability (as deduced from bifurca-tion analyses). The values for reacbifurca-tion 11 were fixed under the assump-tion of a similar binding affinity as reported for reacassump-tion 3. The values for the reactions 12 and 13 represent estimated turnover rates.
Steady State Derivation—The steady states were derived under the
steady state condition dy/dt⫽ 0 (for all compound concentrations y). A consecutive elimination of variables leads to a polynomial in C3*, whose solutions present the steady state concentrations of C3* from which the steady state concentrations of the other molecular species can be de-rived. The life steady state can be factored out leaving a quadratic equation of the general form ax2⫹ bx ⫹ c ⫽ 0 for the basic model and
a fourth-order polynomial for the extended model. The quadratic for-mula was used to construct the green (b2⫽ 4ac; saddle-node bifurcation manifold) and the blue (⫺b/a ⫽ 0) area in Fig. 3. Interestingly, the coefficient c is the same as the coefficient c derived in the stability analysis (see below).
Stability Analysis—For the life steady state one can construct the
characteristic polynomial det(I ⫺ A) ⫽ 0. Here, det refers to the determinant, represents the eigenvalues, I represents the identity matrix, and A represents the Jacobian matrix evaluated at the life steady state. For the non-linear ordinary differential equation system to be locally (asymptotically) stable, all eigenvalues need to have neg-ative real parts. The Hurwitz criterion provides conditions for stability based on the coefficients of the characteristic polynomial. The most restrictive for the basic model is that the coefficient c (below) is positive, which was also used to construct the red area shown in Fig. 3 (tran-scritical bifurcation manifold). The stability of the steady states other than the life steady state were evaluated numerically, c⫽ k5(IAP k3k7⫹
k6(k7⫹ k⫺3))⫺ C3 C8 k1k2(k7⫹ k⫺3).
Deriving an Input Distribution—We assume a population behavior
as depicted in Fig. 5A, which can be interpreted as a probability distri-bution. We further assume that 100% of caspase activation corresponds to 100% cell death, i.e. caspase 3 becomes significantly activated in every cell within the population. Furthermore, based on the simulations of the deterministic single cell model described in Fig. 4, we can de-scribe the maximal caspase 3 activation as a function of C8* input. Hereby we assume the maximal caspase activation to define the time point of cell death. This correlates the stochastic time point of cell death to a stochastic input signal for the single cells within a population. From the original distribution of Fig. 5A we thus obtain a distribution of cell death probability as a function of input activation. The corresponding probability density function can be derived by differentiation as shown in Fig. 5B.
RESULTS
The Biology of the Model System—The type I cell-like (13) model (called basic model hereafter) was constructed with the purpose of being as uncomplicated as possible without neglect-ing essential steps concernneglect-ing our analyses (see below), i.e. simplifications represent conservative estimations. As a model input we use a pulse of activated caspase 8, which is produced by the death-inducing signaling complex formed at the mem-brane after death receptor stimulation (16) (although the ini-tial steps seem to be more complex in the case of TNFR1 (17)). The model is outlined in Fig. 1 (yellow background) and con-tains the following reactions:
1T. Eissing, H. Conzelmann, E. D. Gilles, F. Allgo¨wer, E. Bullinger, and P. Scheurich, unpublished data.
2
The abbreviations used are: IAP, inhibitor of apoptosis protein; BAR, bifunctional apoptosis regulator; CARP, caspase 8- and 10-asso-ciated RING proteins; Cn, pro-caspase n; Cn*, activated caspase n.
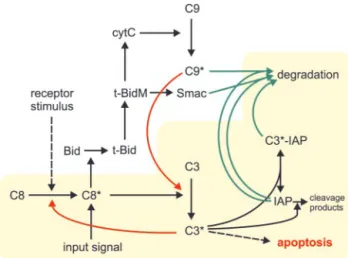
FIG. 1. Outline of apoptotic pathways downstream of death
receptors. Initially, partial activation of caspase 8 (C8*, the active status of caspases is indicated by an asterisk) is mediated by death receptor stimulation. C8* can cleave and activate caspase 3 (C3) di-rectly but also cleaves Bid to release t-Bid. Mitochondrial t-Bid (t-BidM) leads to the release of cytochrome c (cytC) and Smac/DIABLO (Smac). Caspase 9 (C9) is activated by cytC and activates C3. C3* can activate residual C8 in a feedback loop. C9* and C3* can be inhibited by IAP molecules and subsequently fed into proteasomal degradation. Mito-chondrially released Smac competes with the caspases for IAP binding and degradation.
C8*⫹ C3 3 C8* ⫹ C3* REACTION1
C8⫹ C3* 3 C8* ⫹ C3* REACTION2
C3*⫹ IAP 7 iC3* ⬃ IAP REACTION3
C3*⫹ IAP 3 C3*
REACTION4
Pro-caspase 3 (C3, standing for the executioner caspases in general, e.g. caspases 3, 6, and 7) is cleaved and activated by activated caspase 8 (14, 18) (C8*; standing for both initiator caspases, caspases 8 and 10) (Reaction 1). Activated caspase 3 (C3*) acts in terms of a positive feedback loop onto pro-caspase 8 (C8) (19 –21) (Reaction 2). Here we neglect the presumably amplifying effect of caspase 6 within this feedback loop. Acti-vated caspase 3 binds to and is inactiActi-vated by XIAP, here for simplicity termed IAP, as cIAP-1 and cIAP-2 also have the capacity to block caspase 3, although with less efficiency (22, 23). IAP-bound activated caspase 3 may form a pool (Reaction 3), but, in parallel, IAP molecules can be cleaved by the acti-vated caspase 3 (Reaction 4). The cleavage products of XIAP have been described to exert only minor effects on caspase 3 (24), so these are neglected. Also, the two cleaved forms of caspase 3 are not distinguished, as both have been described to possess similar catalytic activities (15). Furthermore, activated caspases, as well as activated caspase 3 complexed with IAPs, are continuously degraded and pro-caspases and IAPs are sub-jected to a turnover (Reactions 5–10, degradation and turnover reactions detailed under “Experimental Procedures”). We thus obtain a system of six ordinary differential equations as de-tailed under “Experimental Procedures.”
Bistability and Apoptosis—Several signal transduction path-ways governing cell fate decisions have experimentally and theoretically been shown to display a bistable behavior (25–27). Bistability is also an obvious and mandatory property of the apoptotic machinery, as the status “alive” must be stable and resistant toward minor accidental trigger signals (i.e. “noise”) (28). Also, caspases are known to possess zymogenicity (18) and partial activation is observed in some physiological processes (29). However, if the apoptotic initiation signal is beyond a certain threshold, the cell must irreversibly enter the pathway to develop apoptosis. In the following, we use this information in a reverse engineering manner (6) and take bistability as an “essential condition” to evaluate possible models with respect to this expected behavior.
The Basic Model Shows an Unstable Life Steady State— Solving the equation system of our basic model under steady state conditions reveals three steady states. One of these, the “life steady state,” corresponds to the initial conditions in which the system remains without an external trigger, i.e. without initial caspase 8 activation. This was expected because our model parameters defining the new synthesis of molecules had been chosen to balance their degradation, and additional influ-ences were neglected. The stability of the steady state provides information about the system behavior close to that steady state, indicating the response to very minor activating input signals. If the steady state is stable, the system will return to its original steady state, provided the perturbations are small enough, which is a situation expected for our model.
The stability of a steady state can be evaluated using the Hurwitz criterion, which is well established in systems theory (see “Experimental Procedures”). The point where the stability properties change, i.e. the bifurcation point, provides insight into the qualitative system behavior for certain parameter ranges. We introduced fixed parameter values for all reaction rates except for Reaction 1 (Table I) and found that the life steady state is only stable for k1values below⬃3.2 ⫻ 103
M⫺1
s⫺1, a value more than 300 times lower than reported in liter-ature (14, 18) (the situation is illustrated in Fig. 2). Fig. 3 shows the bifurcation point (red area) in dependence of three parameter classes with fixed ratios in each class. The param-eter combination that can be deduced from literature (Fig. 3, yellow dot) is far away from those combinations enabling a stable life steady state (Fig. 3, below the red area). To further confirm our results, we conducted several million simulations with small inputs and random sets of parameters taken from the parameter ranges shown in Table II. All combinations resulted in significant caspase activation with very small input signals (i.e. an unstable life steady state), although the onset time varied greatly (data not shown).
Bistability within a Small Parameter Domain—The two ad-ditional steady states besides the life steady state provide further information. Theoretically, one additional steady state within the positive concentration range is sufficient to achieve bistability (because phenomena other than an unstable steady state could separate the two stable steady states). However, in our model this configuration is only possible above the red area in Fig. 3 (see “Experimental Procedures”) and for that setting the life steady state is unstable. Accordingly, bistability is only possible if both additional steady states are within the positive concentration range (Fig. 3, above the blue area). Another restriction is imposed by our biological system, because the solutions must contain real numbers (Fig. 3, above the green
TABLE I
Simulation parameters
Parameter values as used in the single set simulation experiments are given (mo⫽ molecules). In parentheses the values are shown in more common units to enable direct comparison with literature values presented in Table II. For further information see “Experimental Procedures.”
Value Unit Value Unit
k1 5.8䡠10⫺5(5.8䡠10 5) cell䡠min⫺1䡠mo⫺1(M⫺1s⫺1) k ⫺1 0 k2 10⫺5(10 5 ) cell䡠min⫺1䡠mo⫺1(M⫺1s⫺1) k⫺2 0 k3 5䡠10⫺4(5䡠10
6) cell䡠min⫺1䡠mo⫺1(M⫺1s⫺1) k
⫺3 0.21 (0.035) min⫺1(s⫺1)
k4 3䡠10⫺4(3䡠10
6) cell䡠min⫺1䡠mo⫺1(M⫺1s⫺1) k
⫺4 0
k5 5.8䡠10⫺3(120) min⫺1(min) k⫺5 0
k6 5.8䡠10⫺3(120) min⫺1(min) k⫺6 0
k7 1.73䡠10⫺2(40) min⫺1(min) k⫺7 0
k8 1.16䡠10⫺2(60) min⫺1(min) k⫺8 464 (1.3䡠10⫺11) mo䡠cell⫺1䡠min⫺1(M䡠s⫺1)
k9 3.9䡠10⫺3(180) min⫺1(min) k⫺9 507 (1.4䡠10⫺11) mo䡠cell⫺1䡠min⫺1(M䡠s⫺1)
k10 3.9䡠10⫺3(180) min⫺1(min) k⫺10 81.9 (2.3䡠10⫺12) mo䡠cell⫺1䡠min⫺1(M䡠s⫺1)
k11 5䡠10⫺4(5䡠10
6) cell䡠min⫺1䡠mo⫺1(M⫺1s⫺1) k
⫺11 0.21 (0.035) min⫺1(s⫺1)
k12 10⫺3(693) min⫺1(min) k⫺12 40 (1.1䡠10⫺12) mo䡠cell⫺1䡠min⫺1(M䡠s⫺1)
area). Thus, bistability is only possible in a very restricted parameter area far away from values reported in literature (Fig. 3, yellow dot). In accordance with general considerations on this topic (25, 30) the feedback from caspase 3 onto caspase 8 is necessary for bistability (data not shown).
IAPs and Their Cleavage—Interestingly, by and large the stability of the life steady state seems to be independent of the IAP cleavage reaction (Fig. 3). This is not expected and indeed dynamic simulations show that, upon faster IAP cleavage, the onset of caspase activation is achieved more rapidly for
parame-ter combinations where the life steady state is unstable (data not shown). However, for parameter combinations where the life steady state is stable, a slower reaction stabilizes the life steady state by enlargement of its area of attraction (globally stable without this reaction). This can be explained by the fact that we assumed higher concentrations of IAPs than that of caspase 3 to make a conservative estimation concerning the stability of the life steady state. If we assume lower numbers of IAP molecules, we can achieve bistability (which would also require the turnover of IAPs not to exceed that of caspases significantly) even in the absence of this cleavage reaction. However, the parameters in which a stable life steady state is possible would be even further away from those values reported in literature (data not shown). Together, the model indicates that the IAP cleavage reaction is important for a decisive switching.
Further analysis of the model reveals that apoptosis can only proceed after the IAP pool is exhausted, as otherwise most of the active caspase 3 molecules become neutralized (data not shown). As the binding of active caspase 3 to IAPs is a revers-ible reaction, a slower degradation of the complexes would elevate the levels of free active caspase 3 and therefore promote apoptosis. Thus, our results also argue for the view of IAPs as altruistic proteins sacrificing themselves to prevent cell death (31). In our investigations we did not change the initial concentrations to restrict the number of free parameters. However, in the mathemat-ical formulas it can be seen that changing a parameter value has similar effects as changing an initial concentration, and so we have indirectly evaluated these influences as well.
Bistability through Model Extension—An inherent problem of the described basic model of caspase activation is that rela-tively fast activation kinetics must be realized to be consistent with parameter values from literature and observations in various experimental setups (9 –12, 32, 33). On the other hand, only if the kinetics are slow will the system display the desired bistability. There are several possibilities explaining how a model extension could reconcile those facts as described under “Discussion.” One possibility is a mechanism to inhibit active caspase 8. In fact, recent reports describe that activated caspase 8 can be functionally inactivated in mitochondrial membranes. There, the molecule BAR has been proposed to bind activated caspase 8 via its pseudodeath effector domain leading to effective neutralization of its proteolytic activity (34 –37). We therefore introduced the molecule BAR into our model and assumed it to bind to activated caspase 8 with an affinity similar to XIAP binding to activated caspase 3 (23, 38). In addition, we introduced a normal turnover rate for the new compounds (see “Experimental Procedures”).
The resulting system provides five steady states, two of which contain negative concentrations for the evaluated area and are thus not of interest. Importantly, stability of the life steady state of this extended model is possible with kinetic values close to those described in literature (illustrated in Fig. 2, bifurcation point at k1⬇ 5.9䡠105M⫺1s⫺1for other parameters as shown in Table I). We performed simulations with input signals of different strength (Fig. 4), using a set of parameters where the system displays a bistable behavior (Table I). In each case, caspase activity remains low for a certain time, inversely proportional to the stimulus strength, followed by a steep rise in activity if the input exceeds the threshold (⬃75 molecules of activated caspase 8/cell). After reaching a maximum, caspase activity ceases again because of, it is our assumption, higher degradation rates for the activated caspases as compared with the production rates of the pro-caspases. Similar to the model without the molecule BAR, the IAPs again play a critical role. Only after the IAP and BAR pools have been exhausted, apo-ptosis can proceed (data not shown). Although the exact
quan-FIG. 2. Bifurcation illustration. A steady state implies that the con-centrations of the compounds within the system do not change over time. If we start at close by concentrations, the system will move back into the steady state if it is stable but move away if it is unstable. Here the steady states and their stability properties dependent on the reaction rate k1are illustrated schematically with the other parameters kept constant. The third coordinate can be envisioned as energy and was introduced to add plasticity. Solid lines indicate stable steady states, and dashed lines indicate unstable steady states. For small values of k1we find a landscape of a bistable system with a stable life steady state (black line), a stable apoptotic steady state (green line), and a third unstable steady state separating the two areas of attraction (red line). When the parameter k1 increases, the landscape changes as the unstable separating steady state meets with the stable life steady state. At this bifurcation point the two steady states exchange their stability properties, and the formerly sepa-rating steady state vanishes into the biologically irrelevant negative con-centration area. Thus, for larger values of k1 the life steady state is unstable and the apoptotic steady state is stable and attractive in the whole positive concentration area.
FIG. 3. (Bi-)Stability analysis. Stability aspects of the basic model
were evaluated over wide parameter ranges. For the three-dimensional visualization the following parameter ratios were chosen as axes, for caspase activation, k1⫽ 2䡠k2; for half-life time, k7⫽ k8⫽ 2䡠k5⫽ 2䡠k6⫽ 4䡠k9⫽ 4䡠k10; and for IAP cleavage, k4; v3was fixed according to
litera-ture values. The yellow dot indicates values as expected from literalitera-ture data (although the IAP cleavage reaction parameter can only be esti-mated, see Table II). Above the red area no stable life steady state exists, below the blue area no second stable steady state within the positive concentration range can exist and below the green area the solutions are complex numbers. Thus, bistability requires parameter combinations below the red and above the blue and above the green areas.
titative behavior depends on the choice of parameters, these simulations display the desired characteristics like bistability and fast activation kinetics combined with prolonged lag phases, inversely related to the strength of the apoptotic trig-ger, as observed in experiments (9).
Reconciling Single Cell and Population Studies—The model derived here has the aim to reproduce certain aspects of apo-ptosis induction at the single cell level. However, most experi-mental studies have been performed using cell populations where effector-caspase activation is typically observed within a range of a few hours (13, 39, 40). Fig. 5A shows an example of a slow time course of effector-caspase activation. As described above, the strength of the apoptotic stimulus mainly trans-lates into the delay between the apoptotic trigger and signif-icant effector-caspase activation. Thus, different delay times because of the stochastic nature of biological systems enable small fast single-cell segments of caspase activation to inte-grate, forming an overall slow caspase activation at the mac-roscopic level. Fig. 5B shows the distribution of input signals into the extended BAR model (as described above) required to produce a population behavior as depicted in Fig. 5A (see “Experimental Procedures”). Although this approach is very simplified, it already reconciles single cell and population data and shows a way of combing both in terms of under-standing and modeling.
DISCUSSION
In the past, systems theory has been mainly used to under-stand dynamic processes of technical structures, but recently it has been increasingly applied in biology (5, 6). Many articles focus on the mathematical modeling of aspects of the metabo-lism, where (quasi) steady state approximations can be used and the mere structure provides valuable information (41). The initiation and development of apoptosis, however, is a highly dynamic process where steady state approximations cannot be easily applied. We employed a reduced model to evaluate the principle behavior, but also took dynamic information into ac-count using data from various sources trying to fuse them together with the help of our model. The class of biological systems exemplified here has not been evaluated previously with respect to bistability, although bistability can be shown for special classes of larger systems (30). Our results showed that (partly) analytic approaches for additional classes are feasible for larger systems than widely believed.
The present study analyzes the basic core reactions of caspase activation as they are accepted widely as occurring after death receptor activation (2, 3, 42). Because the molecular events occurring at the level of the receptor-induced signaling complex are only in part understood (13, 17), the input signal of the model is represented by a given number of molecules of activated initiator caspase (Fig. 1), excluding the pathways mediating initial caspase activation. This model, however, re-veals no stable steady state in the life status, mainly because of the strong forward reaction of the caspase cleavage reactions, as such, containing a positive feedback loop. We therefore re-duced further analyses to the reactions depicted in Fig. 1 on the yellow background, including the caspase activation reactions. Bifurcation analyses of this basic model reveal that it is capable of displaying the desired bistable behavior only within a nar-row range of kinetic parameter values that are far from the
TABLE II
Unstability ranges
Parameter ranges that do not provide parameter combinations enabling a stable life steady state. The k⫺column indicates whether a reaction (see “Experimental Procedures”) is assumed to be reversible or not. If reversible, the values can be calculated with the help of the provided explanations. The last column also provides literature parameter values and the respective references.
k⫹min k⫹max k⫺ Explanations and refs.
M⫺1s⫺1 M⫺1s⫺1 M⫺1s⫺1 v1 3䡠10 4 5䡠106 No In vitro KM/k cat⫽ 10 6 M⫺1s⫺1(14, 18) v2 2䡠10
4 5䡠106 No C3* faster than C8* using fluorogenic substrates (18, 21, 45)
v3 1䡠10
5 5䡠106 Yes To obtain: in vitro K
i⫽ 0.7 nM(23, 38)
v4 1䡠10
3 5䡠106
No Estimation
t1/2min (min) t1/2max (min) k⫺(M䡠s⫺1) k⫹(min⫺1)⫽ ln2/t1/2
v5 30 300 No
v6 30 300 No t1/2⬃ 180 min for caspases; t1/2⫽ 30–40 min for DIAP (31, 46)
v7 30 300 No
v8 30 300 Yes
v9 60 500 Yes Production rate to establish the initial concentration
v10 60 500 Yes
FIG. 4. Bistable behavior of the extended model. Simulation experiments with varying inputs (initial C8* concentrations) and C3* over time as output are shown. Above a certain input threshold (⬃75 molecules of C8*) the system becomes fully activated, whereas sub-threshold activation results in recovery. The two stable steady states can be envisioned, with the life steady state corresponding to the blue
area and the apoptotic steady state corresponding to the green area
achieved after longer time periods.
FIG. 5. Reconciling single cell and populations kinetics. A, an idealized time course of caspase 3 activation as observed at the popu-lation level. B, the density function of the input signal necessary to achieve the population behavior depicted in A, based on single cells behaving as described in the legend to Fig. 4.
values reported in the literature. We thus considered possible modifications in the model structure, capable of reconciling the observed fast kinetics and tolerance to subthreshold stimuli. A common way in cell biology to achieve such a behavior is cooperativity (25), which could also be assumed to exist for caspases, as they are known to act as heterodimers. However, recent work (43) shows that the monomer is just as bioactive as the dimer, arguing against this possibility. Alternatively, one might suggest a mechanism where the kinetic constants are not altered, but where the amount of free active caspase is limited. Such mechanisms are well known to exist for caspases 3 and 9, where IAPs lower the effective concentration of active proteases. In addition, more recent reports describe the inhib-itory molecule BAR, acting at the caspase 8 level (34 –37)(see “Results”). Based on these data reported in the literature, we extended our basic model to include BAR, and the resulting model system displays the mandatory bistable behavior within a wide parameter range close to the kinetic parameter values reported in the literature. Moreover, this extended model now easily describes the fast activation kinetics of caspase activa-tion in individual cells, combined with prolonged lag phases in agreement with experimental data (9). Although additional explanations for these long lag phases have been proposed recently (at least for tumor necrosis factor-induced apoptosis (17)), our studies demonstrated that caspase 8 capture/inacti-vation is a likely mechanistic explanation for the observed lag period followed by fast effector-caspase activation. Whereas this lag phase might be largely controlled at the level of the mitochondria in type II cells (9, 10), a similar behavior was also observed for type I cells, although initial activation of caspase 8 takes place immediately after stimulation (13, 16).
In fact, in a very recent publication (44) a new class of molecules has been described, termed caspase 8- and 10-asso-ciated RING proteins (CARPs), that are proposed to be novel caspase 8 and 10 inhibitors, acting similarly to the IAP pro-teins. In the light of the results from our studies, these exper-imental data underscore the necessity for an effective regula-tion at the level of initiator caspases in death-receptor-mediated apoptosis. Regarding the model system, the effects of direct caspase 8 inhibition and inactivation by CARPs or their capture at the mitochondrial membranes by BAR proteins are reasonably equivalent, as the mathematical model does not take into account processes of diffusion, and both mechanisms effectively lower the number of molecules of free active initiator caspase.
In experimental studies the activation of effector caspases both in type I as well as type II cell populations occurs gradu-ally within a few hours (13, 39, 40), as schematicgradu-ally depicted in Fig. 5A. However, at the single cell level, rapid caspase 3 activation has been observed after a lag phase in the very same experimental setup (9 –12). Using our extended model, we can easily reconcile the observed fast kinetics at the single cell level with the slower rates observed in cell populations. We showed here that the variation of the input signal strength within single cells, as depicted in Fig. 5B, results in slow kinetics at the population level as shown in Fig. 5A. The required stochas-tic input can be explained, for example, by different numbers of death receptors expressed in different cells, but also in a sim-ilar way by (or more likely in combination with) different num-bers of BAR proteins, CARPs, and other molecules involved. The number of caspase 8 inhibitors, for example, strongly in-fluences the threshold, as also observed in siRNA experiments against CARPs (44). Together, these results demonstrate that a strongly reduced model of complex signaling networks like the apoptotic machinery already allows testing and falsifying in
comparison with experimental data, leading to a deeper insight into the control mechanisms of complex cellular responses.
Acknowledgments—We thank the Systems Biology Group Stuttgart
and Harald Wajant for fruitful discussions.
REFERENCES
1. Leist, M., and Jaattela, M. (2001) Nat. Rev. Mol. Cell. Biol. 2, 589 –598 2. Hengartner, M. O. (2000) Nature 407, 770 –776
3. Thornberry, N. A., and Lazebnik, Y. (1998) Science 281, 1312–1316 4. Savill, J., and Fadok, V. (2000) Nature 407, 784 –788
5. Kitano, H. (2002) Nature 420, 206 –210
6. Csete, M. E., and Doyle, J. C. (2002) Science 295, 1664 –1669
7. Fussenegger, M., Bailey, J. E., and Varner, J. (2000) Nat. Biotechnol. 18, 768 –774
8. Scho¨berl, B., Gilles, E. D., and Scheurich, P. (2001) in Proceedings of the
International Congress of Systems Biology, Pasadena, CA, November 4 –7, 2001 (Yi, T.-M., Hucka, M., Morohashi, M., and Kitano, H., eds) pp.
158 –167, Omnipress, Madison, WI
9. Rehm, M., Dussmann, H., Janicke, R. U., Tavare, J. M., Kogel, D., and Prehn, J. H. (2002) J. Biol. Chem. 277, 24506 –24514
10. Goldstein, J. C., Waterhouse, N. J., Juin, P., Evan, G. I., and Green, D. R. (2000) Nat. Cell Biol. 2, 156 –162
11. Luo, K. Q., Yu, V. C., Pu, Y., and Chang, D. C. (2003) Biochem. Biophys. Res.
Commun. 304, 217–222
12. Tyas, L., Brophy, V. A., Pope, A., Rivett, A. J., and Tavare, J. M. (2000) EMBO
Rep. 1, 266 –270
13. Scaffidi, C., Fulda, S., Srinivasan, A., Friesen, C., Li, F., Tomaselli, K. J., Debatin, K. M., Krammer, P. H., and Peter, M. E. (1998) EMBO J. 17, 1675–1687
14. Stennicke, H. R., Jurgensmeier, J. M., Shin, H., Deveraux, Q., Wolf, B. B., Yang, X., Zhou, Q., Ellerby, H. M., Ellerby, L. M., Bredesen, D., Green, D. R., Reed, J. C., Froelich, C. J., and Salvesen, G. S. (1998) J. Biol. Chem.
273, 27084 –27090
15. Sun, X. M., Bratton, S. B., Butterworth, M., MacFarlane, M., and Cohen, G. M. (2002) J. Biol. Chem. 277, 11345–11351
16. Lavrik, I., Krueger, A., Schmitz, I., Baumann, S., Weyd, H., Krammer, P. H., and Kirchhoff, S. (2003) Cell Death Differ. 10, 144 –145
17. Micheau, O., and Tschopp, J. (2003) Cell 114, 181–190
18. Stennicke, H. R., and Salvesen, G. S. (1999) Cell Death Differ. 6, 1054 –1059 19. Slee, E. A., Harte, M. T., Kluck, R. M., Wolf, B. B., Casiano, C. A., Newmeyer, D. D., Wang, H. G., Reed, J. C., Nicholson, D. W., Alnemri, E. S., Green, D. R., and Martin, S. J. (1999) J. Cell Biol. 144, 281–292
20. Cowling, V., and Downward, J. (2002) Cell Death Differ. 9, 1046 –1056 21. Van de Craen, M., Declercq, W., Van den brande, I., Fiers, W., and
Vandena-beele, P. (1999) Cell Death Differ. 6, 1117–1124
22. Salvesen, G. S., and Duckett, C. S. (2002) Nat. Rev. Mol. Cell. Biol. 3, 401– 410 23. Ekert, P. G., Silke, J., and Vaux, D. L. (1999) Cell Death Differ. 6, 1081–1086 24. Deveraux, Q. L., Leo, E., Stennicke, H. R., Welsh, K., Salvesen, G. S., and
Reed, J. C. (1999) EMBO J. 18, 5242–5251 25. Ferrell, J. E., and Xiong, W. (2001) Chaos 11, 227–236 26. Ferrell, J. E., Jr. (2002) Curr. Opin. Cell Biol. 14, 140 –148 27. Xiong, W., and Ferrell, J. E., Jr. (2003) Nature 426, 460 – 465
28. Tyson, J. J., Chen, K. C., and Novak, B. (2003) Curr. Opin. Cell Biol. 15, 221–231
29. Newton, K., and Strasser, A. (2003) Genes Dev. 17, 819 – 825
30. Angeli, D., Ferrell, J. E., Jr., and Sontag, E. D. (2004) Proc. Natl. Acad. Sci.
U. S. A. 101, 1822–1827
31. Ditzel, M., and Meier, P. (2002) Trends Cell Biol. 12, 449 – 452
32. Krippner-Heidenreich, A., Tubing, F., Bryde, S., Willi, S., Zimmermann, G., and Scheurich, P. (2002) J. Biol. Chem. 277, 44155– 44163
33. Fladmark, K. E., Brustugun, O. T., Hovland, R., Boe, R., Gjertsen, B. T., Zhivotovsky, B., and Doskeland, S. O. (1999) Cell Death Differ. 6, 1099 –1108
34. Qin, Z. H., Wang, Y., Kikly, K. K., Sapp, E., Kegel, K. B., Aronin, N., and DiFiglia, M. (2001) J. Biol. Chem. 276, 8079 – 8086
35. Zhang, H., Xu, Q., Krajewski, S., Krajewska, M., Xie, Z., Fuess, S., Kitada, S., Pawlowski, K., Godzik, A., and Reed, J. C. (2000) Proc. Natl. Acad. Sci.
U. S. A. 97, 2597–2602
36. Breckenridge, D. G., Nguyen, M., Kuppig, S., Reth, M., and Shore, G. C. (2002)
Proc. Natl. Acad. Sci. U. S. A. 99, 4331– 4336
37. Stegh, A. H., Barnhart, B. C., Volkland, J., Algeciras-Schimnich, A., Ke, N., Reed, J. C., and Peter, M. E. (2002) J. Biol. Chem. 277, 4351– 4360 38. Deveraux, Q. L., Takahashi, R., Salvesen, G. S., and Reed, J. C. (1997) Nature
388, 300 –304
39. Fotin-Mleczek, M., Henkler, F., Samel, D., Reichwein, M., Hausser, A., Parm-ryd, I., Scheurich, P., Schmid, J. A., and Wajant, H. (2002) J. Cell Sci. 115, 2757–2770
40. Hentze, H., Schmitz, I., Latta, M., Krueger, A., Krammer, P. H., and Wendel, A. (2002) J. Biol. Chem. 277, 5588 –5595
41. Stelling, J., Klamt, S., Bettenbrock, K., Schuster, S., and Gilles, E. D. (2002)
Nature 420, 190 –193
42. Ashkenazi, A. (2002) Nat. Rev. Cancer 2, 420 – 430
43. Donepudi, M., Mac Sweeney, A., Briand, C., and Grutter, M. G. (2003) Mol.
Cell 11, 543–549
44. McDonald, E. R., III, and El-Deiry, W. S. (2004) Proc. Natl. Acad. Sci. U. S. A.
101, 6170 – 6175
45. Garcia-Calvo, M., Peterson, E. P., Rasper, D. M., Vaillancourt, J. P., Zamboni, R., Nicholson, D. W., and Thornberry, N. A. (1999) Cell Death Differ. 6, 362–369
46. Yoo, S. J., Huh, J. R., Muro, I., Yu, H., Wang, L., Wang, S. L., Feldman, R. M., Clem, R. J., Muller, H. A., and Hay, B. A. (2002) Nat. Cell Biol. 4, 416 – 424