Introduction
Coccolithophores, among which Emiliania huxleyi (E. huxleyi) (figure 1) is the most abundant and widespread species, are considered to be the most productive calcifying organism on earth. E. huxleyi often forms massive blooms in temperate and sub-polar oceans, and in particular at continental margins and shelf seas. The intrinsic coupling of organic matter production and calcification in coccolithophorid blooms underlines their biogeochemical importance in the marine carbon cycle. Primary production via photosynthesis in the photic zone and vertical export of organic matter to deep waters draws down CO2:
CO2+ H2O → CH2O + O2
this is the so-called "organic carbon pump". In contrast, calcification and thus formation of biogenic calcium carbonate (CaCO3), consumes total and carbonate alkalinity and releases
CO2:
Ca2++ 2HCO
3-→ CaCO3+ H2O + CO2
this is often named the "carbonate counter-pump" because it counter-acts the effect on CO2fluxes. This intimate coupling of the two pumps in coccolithophores, together with
other calcifying organisms (mainly planktonic foraminifera), has been considered to be responsible for generating and maintaining the ocean's vertical distribution of total alkalinity (TA) in seawater and for regulating the atmospheric pCO2since the Mesozoic
era.
Results & discussion
The biogeochemical properties of an extensive bloom of the coccolithophore, E. huxleyi, at the shelf break in the northern Gulf of Biscay (figure 2) was investigated in June 2006. Total Alkalinity (TA) values in the water column showed strong non-conservative behaviour indicative of the impact of calcification, with the highest TA anomalies (up to 26 µmol kg-1)
in the high reflectance coccolith patch (figure 3 and 4). Partial pressure of CO2 (pCO2)
values ranged from 250 to 338 µatm and the area was found to act as a sink for atmospheric CO2. Overall, pCO2@13°C (pCO2normalized at a constant temperature of 13°C)
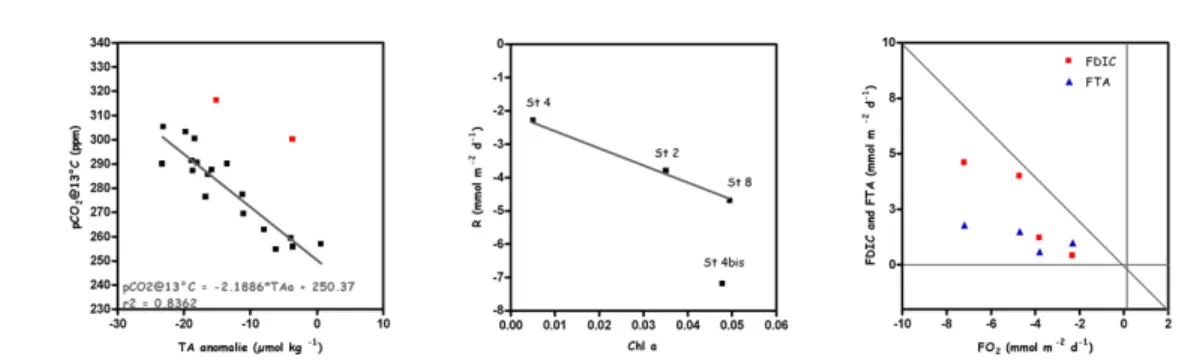
in the water column was negatively related to TA anomalies (figure 7) in agreement with an overall production of CO2 related to calcification. Hence, the calcifying phase of the E.
huxleyi bloom decreased the sink of atmospheric pCO2, but did not reverse the direction
of the flux. Rates of pelagic respiration up to 5.5 mmol O2 m-3 d-1 (figure 5 and 6)
suggested a close coupling between primary production and respiration and/or between organic carbon content and respiration. Benthic respiration rates were quite low and varied between 2 and 9 mmol O2m-3d-1, in agreement with the fact that the study area consists
of sandy sediments with low organic matter content. Benthic respiration was well correlated to the chlorophyll a content of the top 1 cm of the sediment cores (figure 8). Based on the co-variance of TA fluxes and O2 consumption, evidence was found for
dissolution of CaCO3 due to the acidification of superficial sediments in relation to the
production of CO2and the oxidation of H2S in the oxic layers (figure 9).
Figure 1 (left): Coccolithophorid Emiliania huxleyi. Figure 2 (middle): Gulf of Biscay. Figure 3 (right): TA anomalies (µmol kg-1) on a
satellite image of the 1st of June 2006 (provided by Steve Groom, Remote Sensing Group, Plymouth Marine Laboratory, Plymouth, UK)
Chemical Oceanography Unit, Université de Liège, Belgium
http://www.co2.ulg.ac.be/ * kim.suykens@ulg.ac.be
BIOGEOCHEMICAL CARBON CYCLE IN A COCCOLITHOPHORID BLOOM
K. Suykens*, B. Delille & A. V. Borges
2ndMarch 2007
VLIZ Young Scientist Day Brugge, Belgium
Figure 7 (left): pCO2@13°C (ppm) versus TA anomaly (µmol kg-1) over the top 50 m of the water column. Figure 8 (middle): Benthic respiration versus Chl a content (µg l-1) of the top 1 cm of the sediments. Figure 9 (right): Dissolved inorganic carbon (DIC) flux and TA flux
versus respiration flux (mmol m-2d-1).
Figure 4 (left): TA (µmol kg-1) versus salinity to calculate the TA anomalies. Figure 5 (middle): Chl a content (µg l-1) versus depth.