Forestry
An International Journal of Forest Research
Transforming even-aged coniferous stands
to multi-aged stands: An opportunity to increase tree species
diversity?
Gauthier Ligot
1*, Philippe Balandier
2, Sophie Schmitz
3, Hugues Claessens
1 1Gembloux Agro-Bio Tech, Université de Liège, Gembloux, Belgium
2Irstea, Research Unit on Forest Ecosystems (EFNO), Nogent-sur-Vernisson, France
3Walloon Agricultural Research Centre, Gembloux, Belgium
*Corresponding author: Tel: +32 81622320; Fax: +32 81622301; Email: [email protected]
Transforming even-aged conifer stands into multi-aged ones is attracting growing interest in Europe. However, applying this silvicultural treatment, maintaining a continuous cover and relying on natural regeneration, requires a deep understanding of the factors driving interspecific competition in the understory. In particular, knowledge of species-specific response to different light conditions is needed to plan silvicultural treatments and forecast long-term stand composition. In this context, we assessed regeneration (±10– 400 cm in height) and light conditions (±1–40% of transmittance) in nine coniferous stands with ranging stand age (±20–120 years) and species composition (Norway spruce, Douglas fir, larch, silver fir and western hemlock) in Belgium. We then modelled interspecific differences in regeneration height growth to forecast the outcome of interspecific competition in different light conditions. Controlling understory light seems an efficient way to control the interspecific competition, but with some limits, and taking into account sapling size. Maintaining low light conditions (transmittance < 15%) probably reduces interspecific competition as it allows small saplings (height < 100 cm) of most species to grow at a comparable rates. Maintaining higher light conditions might allow a few species to rapidly overgrow the others. Species ranking in height growth changed across the studied light range only between spruce and larch, suggesting that the competition between these two species can be driven through the control of understory light. On the other hand, controlling canopy openness was found to be insufficient, for example, to promote an advanced regeneration (height ≥ 200 cm) of fir over advanced regeneration of spruce, to promote any species over western hemlock or to promote Douglas fir. Western hemlock, a very shade-tolerant species, was found to grow three times faster than the other species in all the observed conditions (PACL = 5–20%). Douglas fir saplings showed weak growth and marked defoliation, which we hypothetically relate to the recent outbreak of Contarinia pseudotsugae in Western Europe.
Introduction
As a legacy of past forest management (e.g. afforestation of agricultural lands, heaths and degraded forests that produced pitprops for coal mines), about a third of European forest consists of pure even-aged coniferous stands (Domínguez, et al. 2015, p135). Traditionally, at the end of the rotation, these stands were clear-cut and then replanted. However, the socio-economic and ecological context has changed since the establishment of this management system relying on clear-cuts and plantations. The sensitivity of pure even-aged forests to climatic and health problems is recognised (Jactel, et al. 2009) and forest policy and public expectations have evolved, with greater emphasis on the many forest ecosystem services, including for example biodiversity habitat, recreation, landscape aesthetics, and carbon sequestration (Diaci, et al. 2011). Alternative approaches to forest management have therefore been encouraged to help meet new societal needs (Diaci, et al. 2011). While different alternatives have been proposed, ranging from the irregular shelterwood system to the single tree selection system, all the alternatives reject clear-cutting, maintain permanent overstory – Continuous Cover Forestry (CCF) (Pommerening and Murphy 2004) – and rely mostly on natural regeneration. The natural regeneration therefore becomes a central component of future stand structure and composition and so is desired to be at least partly controlled.
Photosynthetically active radiation (PAR) in the understory is often an important factor driving regeneration development stands (Balandier, et al. 2007,Drever and Lertzman 2001,Kobe 2006,Lieffers, et al. 1999,Messier, et al. 1998,Soto, et al. 2017), and interestingly one factor that foresters can manipulate. Besides forest disturbances, understory PAR depends particularly on past management (Canham, et al. 1990,Ligot, et al. 2016). Understory PAR controls tree photosynthesis, but also understory microclimate and resources such as air and soil temperatures, and nutrient and water availability (Carlson and Groot 1997,Muscolo, et al. 2007). Both the quantity and the spectral composition (e.g. red to far-red ratio) of available PAR can affect growth processes (Leuchner, et al. 2012,Ballaré, 2017 #2396). Nevertheless, coniferous canopies barely modify the spectral composition of PAR (Federer and Tanner 1966), and the shoot growth of juvenile trees under coniferous canopies can be expected to respond mainly to the quantity of available PAR.
Varying quantity of available PAR induces species-specific response of the growth of existing juvenile trees (Kobe, et al. 1995). Typically, early-successional shade-intolerant species show limited morphological and physiological plasticity to light conditions and low survival rate under shade. By contrast, late-successional shade-tolerant species are better adapted to low light conditions, showing higher morphological and physiological plasticity to light conditions. In response to limited light conditions, they can further reduce specific leaf mass, adapt leaf orientation, allocate more carbon to the growth of lateral branches rather than to height growth and/or reduce carbon allocation to roots, etc. (Messier, et al. 1999). Although plasticity in height growth is thus thought to be especially marked for shade-tolerant species, good correlations between height growth and PAR have also been found for less shade-tolerant or shade-intolerant species (Gaudio, et al. 2011,Lieffers, et al. 1999,Ligot, et al. 2013,Stancioiu and O'Hara 2006).
To help forest managers assess available PAR and control the growth of existing juvenile trees, measuring sapling apical dominance has sometimes been suggested (Messier, et al. 1999,Ruel, et al. 2000). Apical dominance is computed as the ratio of the length of the leader shoot to the length of the longest lateral shoot at the last whorl (the apical dominance ratio, ADR). This variable can easily be measured in the field and has been used to assess regeneration vigour (Ruel, et al. 2000). For instance, in the case of European silver fir (Abies alba Mill.), a value lower than 0.5 indicates suppressed saplings, and a value greater than 1.2 indicates healthy saplings (Ruel, et al. 2000). In stands managed with continuous cover forestry, as available PAR is assumed to be a major factor in regeneration development, ADR has been suggested to reflect light conditions and so indicate whether canopy opening is necessary to promote natural regeneration (Sanchez 2013).
Though less thoroughly studied and less well-controlled by forest managers, pests and pathogens also affect regeneration development. Climate change may affect the sensitivity of tree species to pests and diseases and provide more favourable conditions for the development of certain pests and pathogens. Moreover, the expansion of global trade has at the same time increased the risk of accidental introduction of exotic pests and pathogens (Klapwijk, et al. 2016,Urquhart, et al. 2017). In this changing context, health problems can no longer be ignored, as their effects on forest growth and composition can be dramatic (Oliver and Larson 1996).
In this context, we studied in situ interspecific competition across a range of light conditions characteristic of silvicultural systems maintaining a continuous cover. We evaluated the competition among five coexisting coniferous species regenerating in the understory of even-aged coniferous stands managed with a continuous irregular shelterwood system (Raymond, et al. 2009, Sanchez, 2013 #1737), in Belgium. The five species examined form an interesting study case as they had contrasting levels of shade tolerance, and one of them was severely attacked by various pests and pathogens. Additionally, we evaluated whether apical dominance ratio could be used as a good proxy of PAR available in the understory.
More specifically we aimed (i) to predict the outcome of species competition along a gradient of light conditions, (ii) to identify possible interactions with pest and pathogens and, (iii) evaluate whether the apical dominance ratio is an accurate indicator of light availability in this context.
Methods
Study stands
To monitor the transformation of even-aged conifer stands into multi-aged ones, nine permanent 1 ha plots were established in 2014 in southern Belgium. The studied stands were located in the Belgian Ardennes ecoregion (about 50°N, 5°E) between 400 and 600 m a.s.l. For the period 1971– 2000, mean annual temperature ranged between 7.4°C and 9°C and mean annual rainfall between 933 mm and 1357 mm. During the growing vegetation period, these ranges were about 14–15.4 °C and 500–540 mm. Moisture deficit (precipitation – evapotranspiration) during the growing vegetation period ranged between 25 mm and 35 mm (Van der Perre, et al. 2015). Dominant soils were well-drained brown acidic soils in the WRB soil classification (IUSS Working Group WRB 2015), of variable depth, on Hercynian oligotrophic schist and sandstone substrates.
The nine stands were selected to span different stand compositions and development stages (Table 1). These stands originated from plantations of Norway spruce (Picea abies (L.) Karst), Douglas fir (Pseudotsuga menziesii (Mirb.) Franco.) and in two stands, silver fir (Abies alba Mill., in plot number 1 and 9) and Japanese larch (Larix kaempferi (Lamb) Carr, in plot number 1 and 7). The stands also comprised Sorbus aucuparia L, Fagus sylvatica L., western hemlock (Tsuga heterophylla (Ref.) Sarg.), Betula sp. and Pinus sylvestris L. that naturally regenerated or were preserved by past forest management.
All these stands were in public forests where a CCF approach had recently been adopted. With the exception of the two oldest plantations (plot ids 4 and 9 in Table 1), the shift from rotational forestry to a CCF approach occurred approximately 5–10 years ago. In the two oldest stands, this shift occurred several decades ago. The chosen approach could be characterized according to the classification of Raymond, et al. (2009) as a continuous irregular shelterwood system. It aims to promote the development of several stratified cohorts. Single tree selective thinnings are carried out periodically, about every 6-12 years.
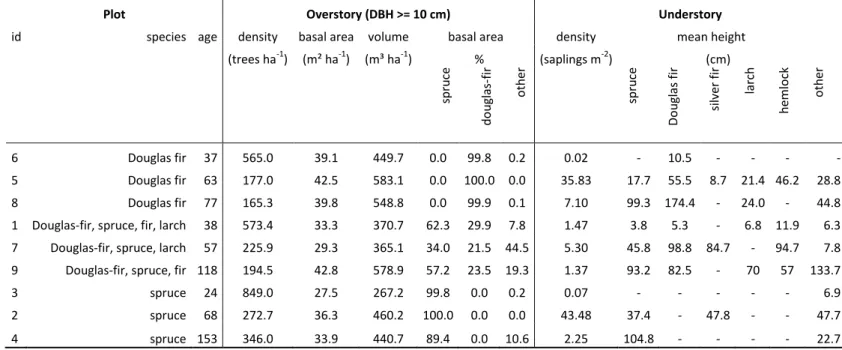
Table 1. Description of the nine selected stands. The stands spanned different species and ages. Stand characteristics are shown by the density, basal area
1
and commercial volume of overstory trees (DBH ≥ 10 cm) and by the proportion of basal area attributed to Norway spruce, Douglas fir and the other 2
species. The understory is described by stem density (DBH < 10 cm) and the mean height of sampled saplings. 3
Plot Overstory (DBH >= 10 cm) Understory
id species age density basal area volume basal area density mean height
(trees ha-1) (m² ha-1) (m³ ha-1) % (saplings m-2) (cm) sp ru ce d o u gl as -fir o th er sp ru ce Do u gl as fir si lve r fi r larch h emlo ck o th er 6 Douglas fir 37 565.0 39.1 449.7 0.0 99.8 0.2 0.02 - 10.5 - - - - 5 Douglas fir 63 177.0 42.5 583.1 0.0 100.0 0.0 35.83 17.7 55.5 8.7 21.4 46.2 28.8 8 Douglas fir 77 165.3 39.8 548.8 0.0 99.9 0.1 7.10 99.3 174.4 - 24.0 - 44.8
1 Douglas-fir, spruce, fir, larch 38 573.4 33.3 370.7 62.3 29.9 7.8 1.47 3.8 5.3 - 6.8 11.9 6.3
7 Douglas-fir, spruce, larch 57 225.9 29.3 365.1 34.0 21.5 44.5 5.30 45.8 98.8 84.7 - 94.7 7.8
9 Douglas-fir, spruce, fir 118 194.5 42.8 578.9 57.2 23.5 19.3 1.37 93.2 82.5 - 70 57 133.7
3 spruce 24 849.0 27.5 267.2 99.8 0.0 0.2 0.07 - - - 6.9
2 spruce 68 272.7 36.3 460.2 100.0 0.0 0.0 43.48 37.4 - 47.8 - - 47.7
In each study stand, 1-ha permanent plot was laid out at stand center. In the plots, all trees with a 4
diameter at breast height greater than 10 cm were identified and mapped. In 2014, tree diameter, 5
tree height and crown radii were measured. Tree diameter has next been measured again in 2016 6
and 2018. Tree volume was estimated using local allometric relationships (Dagnelie, et al. 2013). 7
8
Study species
9In this study, we examined the natural regeneration of Norway spruce, Douglas fir, silver fir, 10
Japanese larch and western hemlock. Except for the last one, these species are among the most 11
important coniferous timber species in Belgium (Alderweireld, et al. 2015). They have contrasting 12
shade tolerance. Western hemlock and silver fir are classified as very shade-tolerant species, Norway 13
spruce as shade-tolerant, Douglas fir as intermediate and Japanese larch as shade-intolerant 14
(Niinemets and Valladares 2006,Rameau, et al. 1989). 15
In the study area, young Douglas fir plantations have recently been subjected to unprecedented 16
defoliations and abundant shoot necrosis. This damage has been associated with fungal pathogens 17
including Nothophaeocryptopus gaeumannii (T.Rohde) (the Swiss needle cast, Ascomycota), 18
Sirococcus conigenus (DC.) P. Cannon & Minter (Sirococcus shoot blight, Ascomycota), Botrytis
19
cinerea Pers. (grey mold, Ascomycota) or Sydowia polyspora (Bref. & Tavel) E. Müll (Ascomycota)
20
and the Douglas fir needle midge Contarinia pseudotsugae S.F. Condrashoff (Diptera). 21
Monitoring regeneration size and growth
22In each 1 ha plot, 12 circular subplots of 3 m in radius were laid out systematically using a square 23
sampling grid. The grid size and position were determined to ensure that all subplots were distant of 24
at least 15 m from plot limit. In the subplots, we monitored regeneration and light conditions. In 25
March-April 2018 and in October 2018, the three tallest saplings of each species were measured in 26
each subplot and plastic tags bearing individual numbers were attached to the stem or a branch. 27
We measured their height and assessed their height growth by measuring the length of the terminal 28
shoots of years 2016, 2017 and 2018. Root collar diameter growth was not assessed. The two 29
approaches generally provide similar relationships and species ranking in growth rate (Drever and 30
Lertzman 2001,Kobe, et al. 1995). We additionally measured the longest lateral shoots selected 31
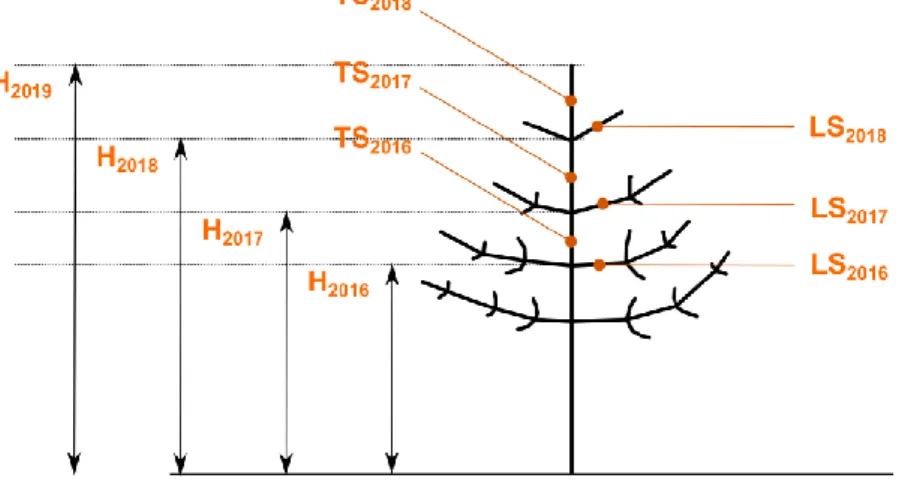
among the lateral shoots growing at the last whorl of the corresponding year (Figure 1). As game 32
browsing was one factor affecting sapling growth, we identified browsed sapling but kept the 33
observations made on browsed shoots whenever bud scars could still be confidently identified. 34
35
Figure 1: Schematic illustration of the measures of sapling height (H), terminal shoot (TS) and lateral shoots (LS) corresponding to the 3
36
study years. H2019 was measured in October 2018. H2018 was either measured in early spring 2018 or estimated as H2019 – TS2018.
37
H2017 and H2016 were estimated from measured heights and terminal shoot lengths.
Based on these measurements, we calculated for each sapling the initial height corresponding to 39
each measured shoot (see Fig. 1), the height growth increment (terminal shoot length) and the 40
apical dominance ratio (ratio of terminal shoot length to lateral shoot length) for each consecutive 41
year. As game browsing was one factor affecting sapling growth, among others, we identified 42
browsed sapling but kept the observations made on browsed shoots whenever bud scars could still 43
be confidently identified. 44
Sapling access to understory light
45Hemispherical photographs were taken in the centre of subplots, above regeneration, at dawn or 46
dusk, in spring 2018 (Nikon D90, Sigma 4.5 mm fisheye lens). The photographs were thresholded 47
using PiafPhotem v2 (Adam, et al. 2013) applying Moments algorithm (Tsai 1985) on image 48
brightness. The percentage of above-canopy light (PACL) was next computed with a Hemiphot R 49
package (Ter Steege 2018). The thresholding method was chosen and calibrated by comparing PACL 50
estimates from photographs and measurements made with sensors (Solem S.A., Palaiseau, France) 51
in three sites (plot id 1, 8 and 9) on one day in August 2018 (Supplementary material 1 – Suppl. 52
Fig. 1). 53
Understory light conditions were assumed to have changed from 2016 to 2018, mainly because of 54
tree mortality (e.g. bark beetle damages) and tree felling. To take into account these effects we used 55
the Open-source library SamsaraLight in the Capsis4 platform (Dufour-Kowalski, et al. 2012). 56
Samsaralight is a 3-D model of light interception by tree crown that has already been described 57
(Courbaud, et al. 2015,Ligot, et al. 2013). Tree positions and crown dimensions were imported in the 58
model to obtain 3-D mock-ups of the study stands corresponding to years 2016, 2017 and 2018. This 59
model then computed PACL corresponding to the given position of each study subplot. These 60
estimates were then used to compute a correction coefficient to correct PACL estimates of 2016 and 61
2017 from the hemispherical photographs (taken in 2018). For a given subplot in 2016, the 62
correction coefficient was the ratio of PACL estimated by the model in 2016 and in 2018. 63
Because hemispherical photographs were taken above the tallest saplings, some shorter saplings 64
could receive less PAR than estimated with hemispherical photographs. For each selected sapling, 65
we additionally evaluated its social position within the understory. Considering only stems less than 66
10 cm in diameter within the subplot, we assessed sapling social position using an adaptation of the 67
Dawkins code (Moravie, et al. 1999) initially proposed to evaluate competition among overstory 68
trees. This index ranged from 1 (very suppressed with crown completely covered by other 69
understory trees) to 5 (emergent understory individuals with crown free from competition for light). 70
Sapling defoliation and damage
71In October 2018, additional measurements were carried out to monitor sapling defoliation and 72
damages. Because the growth of saplings could additionally be affected by different pests and 73
pathogens associated with defoliation symptoms, we estimated a defoliation index following the 74
methodology proposed by Stone, et al. (2007). For each sapling, we selected two secondary 75
branches at least three years old. For each of the last three internodes, the amount of lost foliage 76
was estimated using a scale from 0 to 9 (0 = 0–10% of lost needles, 1 = 11–20% lost, …, 9 = 90–100% 77
lost). The defoliation observations were averaged by individual and then transformed into 78
defoliation percentages ranging between 5% and 95%. 79
Considering the phytosanitary problems affecting Douglas fir in the study area, additional 80
observations and analyses were performed to assess the damage from pest and pathogens on 81
Douglas fir regeneration in more detail. We randomly sampled 15 saplings of Douglas fir about 1– 82
2 m tall in the 5 plots with advanced regeneration, in October 2018. For each of these saplings, 5 83
annual shoots were randomly selected on a secondary branch to estimate the percentage of needles 84
aged less than 1 year old that fell or presented galls typical of those formed by Contarinia 85
pseudotsugae. For these last estimates, we used a scale from 0 to 6 (0%, 1-5%, 6-20%, 21-40%,
60%, 61-90%, 91-100%). One annual shoot and one instance of necrosis were also collected on each 87
of the 15 sampled saplings for further lab analyses. Total genomic DNA was extracted from the pool 88
of needles collected on annual shoots in each plot, and Nothophaeocryptopus gaeumanni DNA was 89
specifically amplified and quantified following Winton, et al. (2002). In addition, isolation attempts 90
were made from the margin of all collected instances of necrosis. Transverse sections of shoots were 91
surface-disinfected for 60 seconds in a sodium hypochlorite solution (1.25% active chlorine). 92
Disinfected segments were debarked, plated onto potato dextrose agar (Difco, USA) and incubated 93
at 20°C in the dark. Microscopic examination was carried out to identify the fungal colonies 94
suspected of being the causal agent of observed necrosis.
95
Statistical analysis
96For each species, we fitted a non-linear generalized mixed model of sapling terminal shoot length in 97
response to PACL and sapling height. Several formulations were tested and the final selected model 98
was the best candidate according to model AIC, the degree of significance of model parameters (P-99
value < 0.05) and residual distribution. For instance, rather than using PACL, i.e. the transmitted 100
diffuse and direct light, the percentage of diffuse light could have been used and provided a similarly 101
good model fit (Supplementary material 1 - Suppl. Table 1). The chosen model is presented in 102
Equation 1. 103
Shoot lengthijkl = (a + as + αk + βl|k) * heightijklb * PACLjklc + εijkl
εijkl ~ N(0,var(εijkl))
αk ~ N(0, σ2α)
βl|k ~ N(0, σ2β)
(1)
With a, as, b and c being the fixed parameters adjusted for each species, and Shoot lengthijkl the
104
observation of shoot length for sapling i, in subplot j of site k in year l. The shoot length and sapling 105
initial height were expressed in centimetres. PACLjkl was expressed as a percentage. To take into 106
account the social position of saplings within regeneration clumps, the Dawkins classification was 107
simplified into a classification with only two classes: suppressed saplings (Dawkins ≤ 2) and dominant 108
saplings (Dawkins > 2). For dominant saplings, the fixed parts of the first terms in brackets (Eq. 1) 109
equalled a; for suppressed saplings it equalled a + as. Different random structures were tested 110
including different random terms associated with the different possible grouping levels (site, year, 111
subplot or sapling). The best random structure was chosen to minimize the Akaike Information 112
Criterion (AIC). It includes a random effect allowing for variation between sites (αk) and between 113
growing years nested within sites (βl|k). Random terms including model residuals (εijkl) were assumed 114
to be normally distributed with mean 0 (Pinheiro and Bates 2000). Because variance of shoot length 115
increases with sapling height, we modelled the residual variance with a power function of sapling 116 height (Eq. 2). 117 var(εijkl) = σε|heightijkl| 2φ (2) Population prediction intervals were computed by drawing 1000 random samples of model 118
parameters from the fitted multivariate normal distributions of parameters (Bolker 2008). Lower and 119
upper confidence bounds were then computed as the 5% and 95% quantiles (α = 0.1). Prediction 120
intervals can here be interpreted similarly to a frequentist confidence interval or a Bayesian credible 121
interval (Bolker 2008). 122
To identify the possible interactions between sapling growth and pests and pathogens, we 123
computed, for Douglas-fir saplings, the correlation coefficients (Pearson's product moment 124
correlation coefficient) between model residuals and defoliation percentages. We additionally 125
computed correlations coefficients between PACL and defoliation to test for a possible relationship 126
between these two variables. Similarly, we computed correlation coefficients between PACL and the 127
apical dominance index to test whether the apical dominance ratio can be a good indicator of PACL. 128
All analyses were implemented in R statistical environment version 3.3.2 (R Core Team 2018) using 129
mainly nlme package version 3.1-137 (Pinheiro, et al. 2018). 130
Results
131Sample description
132We used 1258 measurements of terminal shoot length performed on 511 individuals. The sample 133
was, however, not well balanced across study species, sites, sapling size and light conditions 134
(Table 2). 135
Saplings of Norway spruce (nindiv = 227) and Douglas fir (nindiv = 128) were particularly well sampled,
136
whereas only about 50 individuals were measured for each of the three other species. As height 137
increments were measured for 1 to 3 consecutive years per individual, we gathered about 105–625 138
growth increment measures for all the study species except western hemlock. For western hemlock, 139
we gathered slightly fewer observations (n = 67) because we found it difficult to confidently identify 140
bud scars in the field. Therefore, for western hemlock, we seldom measured shoots older than one 141
year. 142
The tallest saplings found in the sampling units were up to 400 cm in height for Norway spruce, 143
Douglas fir and silver fir, whereas only saplings up to 200 cm and 100 cm in height were found for 144
Japanese larch and western hemlock, respectively. 145
All species were well sampled across a range of PACL from 5% to 20%. Some species were 146
nevertheless sampled across a wider range of PACL. For Douglas fir and larch, the range of PACL 147
went up to 28% and up to 44% for spruce. PACL values greater than 30% were only observed in one 148
site (site No. 2). This site received more PAR radiation, mainly because several overstory trees had 149
died during the previous years due to bark beetle damage. 150
Terminal shoot length modelling
151The tested model fitted relatively well for each species (see the scatterplot of model residuals in 152
Supplementary material 1 - Suppl. Fig. 2). Predictions of annual height increment generally increased 153
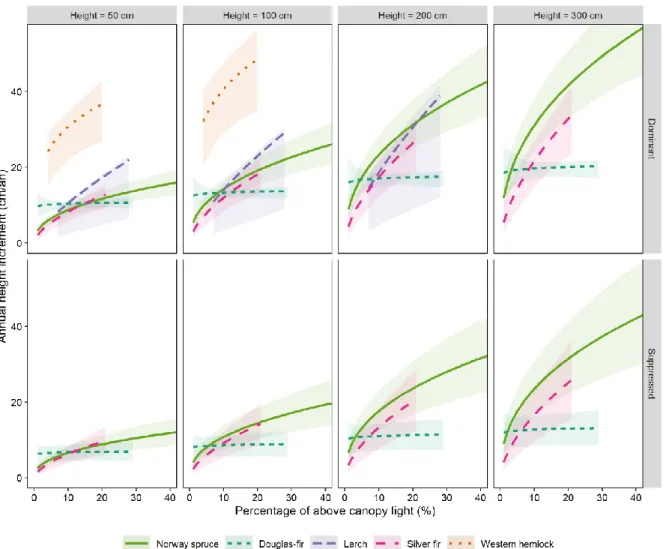
non-linearly with sapling initial height and PACL (Figure 2). 154
Differences among study species were nevertheless noteworthy (Table 3). In particular, for saplings 155
of similar initial height and receiving similar PACL, the height increment of hemlock saplings was 156
about three times that of the other study species. In addition, the response to light of height 157
increment for Douglas fir was particularly weak. 158
The root mean square error (RMSE) was particularly low for Norway spruce and silver fir (3.2– 159
5.1 cm), intermediate for Douglas fir and western hemlock (7.0–8.4 cm) and high for larch (11.1 cm). 160
For all the species, the standard deviations of the random effects (σα and σβ) were very low,
161
indicating weak between-plot and between-year variability. All but two fixed parameters were 162
significantly different from zero (α = 0.05). The two parameters not significantly different from zero 163
were c for Douglas fir (p = 0.758) and a for larch (p = 0.064). 164
165
Figure 2 : Predictions of sapling annual height increment (terminal shoot length) in response to the percentage of above-canopy light
166
(PACL) and sapling initial height for each study species. Predictions were computed only within the range of observed PACL and sapling
167
height. Ribbons depict model prediction interval (α = 0.1).
168
Social position
169The effect of sapling social position was significant for spruce, Douglas-fir and fir saplings as the 170
fitted parameter as of equation 1 was significantly lower than zero (Table 3). This effect was not
171
fitted for larch and western hemlock, as we observed no suppressed western hemlock and only 2 172
suppressed saplings of larch (whose Dawkins code equalled 2). Suppressed saplings of spruce, 173
Douglas fir and fir had significantly smaller terminal shoots than dominant saplings in similar 174
conditions (Figure 2). This growth reduction for spruce, Douglas fir and fir was respectively about 175
24%, 35% and 23%. 176
Pathogens, pests and game browsing
177Saplings of Douglas fir had clearly higher mean defoliation rates (47.5% ± 17.0 of standard deviation, 178
Table 4) than saplings of Norway spruce (15.4% ± 11.0) or silver fir (15.3% ± 8.2). The relationship 179
between defoliation and the growth of Douglas-fir saplings was evidenced by a weak negative 180
correlation between model residuals and defoliation percentage (r = -0.16, P-value = 0.06). We 181
found no significant correlation between defoliation rates and PACL for saplings of Douglas fir and 182
silver fir, whereas this correlation was significant but weak for Norway spruce (r = −0.13, p = 0.0099). 183
For Douglas fir, the mean defoliation rate of suppressed saplings (60.0 % ± 26.4%) was significantly 184
higher than that of dominant saplings (46.4% ± 15.5%), whereas no such effect was observed for 185
spruce and fir (Supplementary material – Suppl. Figure 3). 186
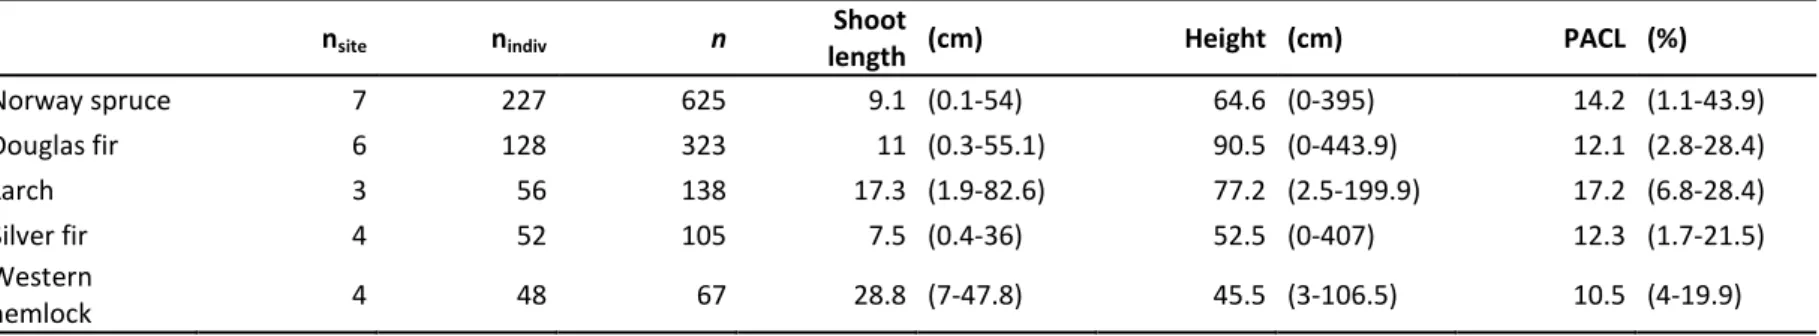
Table 2. Description of the sampled saplings. For each species, the sampling effort is detailed from the number of plots (nplot), the number of saplings (nindiv)
187
and the total number of measures of terminal shoot length (n). Also shown is the mean terminal shoot length, initial height, percentage of above-canopy 188
light (PACL). Maximum and minimum values are given in brackets. 189
nsite nindiv n length Shoot (cm) Height (cm) PACL (%)
Norway spruce 7 227 625 9.1 (0.1-54) 64.6 (0-395) 14.2 (1.1-43.9) Douglas fir 6 128 323 11 (0.3-55.1) 90.5 (0-443.9) 12.1 (2.8-28.4) Larch 3 56 138 17.3 (1.9-82.6) 77.2 (2.5-199.9) 17.2 (6.8-28.4) Silver fir 4 52 105 7.5 (0.4-36) 52.5 (0-407) 12.3 (1.7-21.5) Western hemlock 4 48 67 28.8 (7-47.8) 45.5 (3-106.5) 10.5 (4-19.9) 190 191
Table 3. Parameter estimates of the models of sapling annual height increment in response to sapling size and light conditions (Eq. 1). For each fixed
192
parameters (a, b, c) are shown the estimates, the standard error and significance level (*** = p < 0.001; ** = p < 0.01; * = p < 0.05 and n.s. = p ≥ 0.05). Also 193
shown is the standard deviation of the plot random effect (σα,σβ), the parameters of the residual variance function (φ, σε) and the root mean square error
194
(RMSE). 195
Species a σa as σas b σb c σc σα σβ φ σε RMSE
Spruce 0.207 0.039 *** -0.051 0.014 *** 0.708 0.029 *** 0.421 0.055 *** 5.58E-02 2.81E-02 0.441 0.821 5.084
Douglas fir 2.419 0.501 *** -0.854 0.376 *** 0.357 0.033 *** 0.027 0.088 n.s. 2.37E-05 3.84E-09 0.279 2.066 6.979
Larch 0.410 0.219 n.s. 0.412 0.062 *** 0.711 0.18 *** 1.39E-07 2.22E-07 0.433 1.704 11.160
Silver fir 0.249 0.089 ** -0.058 0.038 ** 0.541 0.047 *** 0.6 0.141 *** 4.11E-02 1.03E-02 0.212 1.413 3.160
Western hemlock 3.502 1.254 ** 0.404 0.074 *** 0.257 0.108 * 4.66E-05 6.07E-01 -0.023 9.181 8.225
Table 4. Estimates of the mean percentage of defoliation and the mean percentage of browsed
individuals across study plots. Maximum and minimum values are given in brackets.
Defoliation (%) Browsing (%) Norway spruce 15.4 (5.0-58.3) 1.4 (0.0-33.3) Douglas fir 47.5 (18.3-95.0) 3.1 (0.0-33.3) Larch - 5.7 (0.0-50.0) Silver fir 15.3 (5.0-31.7) 27.6 (0.0-100.0) Western hemlock - 8.8 (0.0-100.0)
Further observations and lab analysis performed on Douglas fir saplings showed that the various pests and diseases affecting the young Douglas fir plantations in the study area also concerned Douglas fir natural regeneration in our study sites. Galls typical of those produced by Contarinia
pseudotsugae were indeed observed in the five sites with advanced regeneration of Douglas fir.
Using a scale of 0 to 5, the estimated mean damage level ranged between 1.73 (i.e. approx. 13% of annual needles were damaged or fell) and 3.21 (approx. 39%) among sites. In addition, the presence of Nothophaeocryptopus gaeumanni was also detected in the 5 sites through quantitative PCR performed on pools of needles. Sirococcus conigenus was found associated with shoot necrosis in 4 sites, and Sydowia polyspora and Botrytis cinerea were encountered at a lower frequency (in 2 sites and 1 site respectively).
Among the study species, silver fir was the one most affected by browsing. About 29% of the measured silver fir saplings were identified as browsed. This proportion was comparable to the value obtained for the hardwood species present in low abundance in the study stands (Fagus sylvatica L.,
Quercus sp., Salix sp., Betula sp., Acer pseudoplatanus L.). The proportions of browsed saplings of
larch, western hemlock, Douglas fir and Norway spruce were respectively only 6.3%, 5.4%, 3.9% and 1.3%. Browsing inevitably reduced sapling shoots, but as the occurrence of browsing was relatively limited and unbalanced, we did not model its impact.
Apical dominance ratio
We found a significant correlation between PACL and the apical dominance ratio (ADR) for larch, spruce and silver fir (Figure 3). These correlations were nevertheless weak, with Pearson correlation coefficients ranging between 0.18 (R² = 3.2%) and 0.46 (R² = 21.2%). For Douglas fir, the correlation coefficient was not significantly different from zero (r = 0.05). Excluding all observations carried out on suppressed saplings (Dawkins ≤ 2) did not increase the value of these correlation coefficients.
Figure 3 : Relationship between apical dominance ratio and percentage of above-canopy light for each study species. Also shown are the
Discussion
Based on in situ measurements of natural regeneration under canopies of even-aged coniferous stands, we modelled sapling annual height increment in response to the percentage of above-canopy light (PACL) and sapling size, for five coexisting coniferous species (western hemlock, silver fir, Norway spruce, Douglas fir and Japanese larch). The resulting models provide means to forecast the outcome of interspecific competition at different sites and across different light conditions.
Validity of the fitted models
The results of our empirical modelling approach are linked to the sampled individuals and conditions. Interpretation of the fitted models outside these conditions should be cautious.
Compared with other studies (e.g. Lochhead and Comeau 2012,Petritan, et al. 2009,Stancioiu and O’Hara 2006), we sampled a relatively narrow range of light conditions (1–44%). Sampling regeneration under more open canopies might have improved model fits. However, we consider that the sampled conditions closely represent those of even-aged coniferous stands being progressively transformed into multi-aged stands, using a continuous irregular shelterwood system (Raymond, et al. 2009) and following the silvicultural recommendations for southern Belgium (Sanchez 2013).
The environmental conditions investigated were typical of those of the Belgian Ardennes ecoregion at 400–600 m a.s.l.. In line with the current climatic trend for the region, we note that the weather of the years we considered was warmer and drier than it was in the preceding decades. Compared with the averages of the last 30 years, 2016 and 2017 were qualified as unusually warm years with annual rainfall slightly below the average. In 2017, rainfall was scant particularly before and during the beginning of the vegetation period. The year 2018 was qualified as an exceptionally warm and dry year.
Our sampling strategy meant that we assessed mainly dominant saplings, i.e. emergent saplings among regeneration clumps, but also a few suppressed saplings. We found that sapling social position within regeneration clumps affected sapling growth. The growth of suppressed saplings was on average 23–35% lower than that of dominant saplings, depending on the species considered. Such an effect was expected, as the amount of PAR was measured above the dominant saplings, and only a fraction of it was therefore available to suppressed saplings. In addition, taller saplings may also have a competitive advantage for below-ground resources through a better root exploitation of soil resources (Casper and Jackson 1997).
Additionally, browsing can notably reduce height growth (Kupferschmid and Bugmann 2013,Kupferschmid, et al. 2013), and so we selected sites with limited populations of red and roe deer. For all the study species except fir, the proportion of browsed saplings was very low (<6.5%), whereas the proportion of browsed silver fir saplings was appreciable (28.8%) and probably affected model fit. In sites with lower or greater browsing pressure, our model may respectively underestimate or overestimate sapling growth (Kupferschmid and Bugmann 2013,Kupferschmid, et al. 2013).
Finally, we also emphasize that we focused on sapling height growth, whereas different relationships might have been found had we focused on sapling diameter growth. Diameter and height growth responses to local competition and light availability may differ (Collet and Chenost 2006).
Interspecific competition and height growth
As expected, light availability in the understory is a key factor in regeneration development (Lieffers, et al. 1999,Messier, et al. 1999). Even though we sampled a limited range of light conditions, we found highly significant relationships between sapling height growth and PACL. The relationship was non-linear. In relatively low light conditions, a steep slope was found, no doubt because in these conditions, light is probably the most limiting factor of sapling growth. The relationships then
saturate with increasing PACL (Ligot, et al. 2013,Petritan, et al. 2007,Petritan, et al. 2009,Stancioiu and O’Hara 2006). Based on our sample, we were not able to clearly identify PACL values corresponding to growth saturation. We could nevertheless identify and quantify interspecific difference in height growth along the ranges of studied sapling height and PACL.
Small saplings (height ≤ 100 cm) of all the species except western hemlock had similar height growth rates in low light conditions (PACL ≤ 10%). In these conditions, predictions for Douglas fir tended to be greater than that for the other three species (Figure 2), but the difference was not significant. In low light conditions, the height growth rate of Norway spruce, larch, silver fir and Douglas fir can therefore be considered comparable, allowing coexistence among these three species. This corroborates the findings of Stancioiu and O’Hara (2006), who also observed that Norway spruce and silver fir grew at comparable rates in the Carpathian mountains (Romania). In such low light conditions, the outcome of interspecific competition may, however, predominantly affect species-specific survival rates rather than species-species-specific height growth (Kobe, et al. 1995).
Appreciable differences in growth rate were observed among small saplings in high light conditions (PACL > 20%) or among taller saplings (height > 100 cm) in low and high light conditions. In high light conditions, we observed marked differences in height growth rates among the study species, which could be partially explained by species-specific light requirements. Setting aside western hemlock, as this species was not observed in high light condition (PACL > 20%), larch (shade-intolerant) grew the fastest; Douglas fir (less shade-tolerant) grew the slowest, and Norway spruce (shade-tolerant) and silver fir (very shade-tolerant) had intermediate growth rates. According to Kobe, et al. (1995), shade intolerant species are generally characterized by fast growth, enabling them to outcompete neighbouring trees in high light environments, whereas shade-tolerant species are characterized by slow growth and low mortality rate, enabling them to persist in low light environments. The observed species ranking thus approximately fitted this definition, with only the Douglas fir ranking lower than expected (see explanations below).
Our results confirms that the ranking of species depends not only on light conditions but also on sapling size (Balandier, et al. 2007,Delagrange, et al. 2004,Kneeshaw, et al. 2006,Niinemets 2006). In low light conditions, spruce tended to have a competitive advantage over larch, whereas the opposite was observed in high light conditions. The range of light conditions favourable to larch additionally seemed to change with sapling size. For saplings 50 cm, 100 cm or 200 cm in height, larch overgrew spruce if PACL was greater than 5%, 10% and 20%, respectively (Figure 2). In other words, the minimum light level that allows larch to overgrow spruce increased proportionally with sapling height. This result supports the idea that less shade-tolerant species may require increasing light availability through ontogeny in order to keep their competitive advantage over more shade-tolerant species.
On the other hand, western hemlock grew about three times faster in height than the other study species. In this study, the observation of western hemlock was limited to a restricted range of conditions (PACL < 20%, height < 200 cm), but pure natural regeneration of western hemlock in large gaps close to the study plots suggest that its strong competitive advantage probably holds at PACL > 20%. Western hemlock has a sustained growth pattern, whereas the other species have a preformed one (Oliver and Larson 1996). Shoot elongation of species with sustained growth can last as long as environmental conditions are favourable, continuously developing new leaf and shoot primordia. By contrast, the shoot elongation of species with preformed growth is set in the bud formed during the previous growing year (except in the case of second flush growth, i.e. lammas growth, which was very infrequent in our observations). Thus shoot elongation of species with preformed growth stops once all preformed primordia have developed (Oliver and Larson 1996). With difference in growth patterns among species and presumably very favourable environmental conditions, western hemlock had a clear competitive advantage over the other coexisting tree species. The growth of species with a sustained growth pattern is thought to be site-sensitive (Oliver and Larson 1996) and
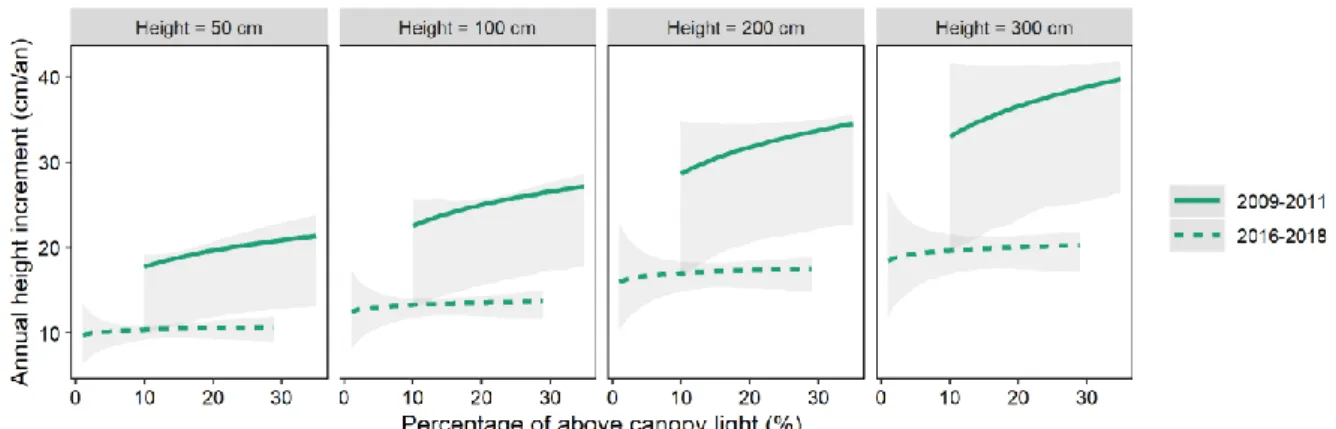
Figure 4 : Comparison of the height increment of dominant saplings of Douglas fir measured in 2016-2018 for this study and in 2009-2011
for a preliminary study (Petit 2012). The same modelling approach was used on both data sets (Eq. 1 and 2). Predictions were computed only within the range of observed PACL and sapling height. Ribbons depict model prediction interval (α = 0.1).
Figure 5 : Photographs taken in the study plots of Douglas fir and Norway spruce saplings growing close together (a) and a highly
defoliated tall sapling of Douglas fir (b). In the photograph on the left (a) the Douglas fir sapling had numerous instances of shoot necrosis and a small terminal shoot in comparison to the spruce sapling. Douglas fir dominated this regeneration clump, but Norway spruce will likely outgrow it.
so the reported competitive advantage of western hemlock probably depends on environmental conditions.
Pest and pathogens in Douglas fir regeneration
Surprisingly, the height growth of Douglas fir was lower than expected and was not significantly related to PACL. In a preliminary study that analysed the height growth of 42 Douglas fir saplings between 2009 and 2012 in two similar sites in southern Belgium (Petit 2012), higher growth rates had been found, together with a significant relationship with PACL (Figure 4). It was additionally expected that Douglas fir, being less shade-tolerant than Norway spruce, grew faster than Norway spruce in high light conditions (Kobe, et al. 1995,Rameau, et al. 1989). Besides low growth rate, the
measured Douglas fir saplings showed higher mean defoliation rates than the other study species, along with numerous instances of shoot necrosis (Figure 5).
The recent outbreak of Contarinia pseudotsugae in Western Europe may also have led to increasing defoliation rates of Douglas fir juveniles. Galls of Contarinia pseudotsugae were found on a significant number of needles. This pest was discovered for the first time in Europe in 2015 by scientists in the Netherlands (EPPO 2016) and in Belgium (EPPO 2016). In spring, adults of Contarinia
pseudotsugae emerge from soil and lay eggs on needles of Douglas fir at budbreak (Condrashoff
2012). Later, larvae enter the needles of the current year and cause the formation of galls. Around November, the larvae leave the damaged needles, which rapidly fall, thus decreasing photosynthesis potential. Contarinia pseudotsugae is thus suspected to be a major cause of defoliation observed in young Douglas firs in Belgium.
Various fungal pathogens long known to damage young Douglas fir plantations were evidenced in this study. Among them, Nothophaeocryptopus gaeumannii and Sirococcus conigenus were the most frequent. Nothophaeocryptopus gaeumannii infection results in premature needle fall, especially affecting the oldest needles (Stone, et al. 2007). Sirococcus conigenus causes shoot-tip necrosis. The severity and distribution of Nothophaeocryptopus gaeumannii have been forecasted to increase with climate change (Sturrock, et al. 2011). In particular, mild winters can favor the survival of the pathogen and are expected to be associated with more severe Swiss needle cast (Zhao, et al., 2011). The sensitivity of Nothophaeocryptopus gaeumannii to relatively small differences in winter temperatures (Stone, et al., 2007; Lee, et al. 2017) could thus partly explain the low growth rate of Douglas fir saplings relative to our expectation and to the result of a preliminary study conducted 7
years ago (Petit 2012).
Does the apical dominance ratio indicate understory light level?
Our results confirm that significant relationships can be found between apical dominance ratio (ADR, ratio of terminal shoot length to lateral shoot length) and PACL. It underlines that juvenile trees, and especially those of shade-tolerant species, can adapt their architecture to PAR availability (Messier, et al. 1999). Nevertheless, only weak relationships were found.
Besides light conditions, ADR certainly depends on additional factors such water and nutrient availability and defoliation (Ruel, et al. 2000). The importance of defoliation and shoot necrosis on Douglas fir saplings helps explain why the correlation was not significant for this species. In addition, some methodological points that may have affected the results must be noted. Firstly, we would probably have obtained stronger relationships if we had sampled a broader range of PACL. Stancioiu and O'Hara (2006) measured ADR of spruce and fir along a gradient of PACL from about 0 to 100% in Romania. They found that 32–39% of the variance of ADR was explained by the logarithm of PACL. Here, we obtained coefficients of determination (R²) up to 18% only. Secondly, we also note that PACL was estimated with hemispherical photographs that were sometimes taken 3 m from the sampled individuals. It would have been preferable to measure PACL exactly above each sampled individual. Additionally, the social position of saplings can certainly influence the relationships between PACL and ADR, but we probably measured too few suppressed saplings to evidence it. To conclude, as Ruel, et al. (2000) state, ADR no doubt indicates tree vigour depending not only on light availability but also on current and recent growing conditions including nutrient and water availabilities, defoliation, etc.
Implications for forest management
With CCF, the fine control of canopy openness is believed to be instrumental in influencing long-term stand composition. Our findings show that the identity of the fastest growing species can depend on canopy openness in interaction with sapling size. Nevertheless, the control of canopy openness may be insufficient in some cases. For example, in the study area, it may be insufficient to
promote an advanced regeneration (height ≥ 200 cm) of fir over spruce, to promote any species over western hemlock or to promote Douglas fir regeneration weakened by pest and pathogens.
In the study area, the stands were generally of small area and close to stands of different species. Seedlings of different species often germinated under single-species coniferous stands. In this context, using an irregular shelterwood system appeared justified to obtain an intimate mixture of different species in the regeneration. It maintains relatively low light levels that allow most species to grow in height at approximately similar rates (with the exception of western hemlock in our study case). Opening large gaps, such as with the expanding-gap irregular shelterwood system (Raymond, et al. 2009), can result in higher amounts of PAR in understory patches, where few species may thus more abundantly overgrow the others (larch for example).
Perspectives
CCF is gaining more and more interest, but only few models of the dynamics of natural regeneration are so far available (Stancioiu and O’Hara 2006). To fill this gap, more monitoring of regeneration needs to be done, in particular to extend the range of sampled conditions and examine species-specific mortality rates. Models of regeneration development can then be implemented in forest stand dynamic simulators (e.g. the Samsara2 model proposed by Courbaud, et al. (2015)) to evaluate management strategies and propose guidelines to transform even-aged coniferous plantations into multi-aged stands. This study additionally underlines that the outcome of interspecific competition may evolve over time. Further work remains to be done, particularly to find out whether reduction in soil water availability, which is expected owing to more frequent droughts, may affect interspecific competition in the understory of forests managed with continuous cover forestry.
Conclusion
To evaluate and design silvicultural approaches that aim both to transform even-aged stands and to increase tree species diversity, it is essential to have a good understanding of the ecology of natural regeneration, including interspecific differences in growth for different light conditions. This study provides key species-specific models that can be used to predict the outcome of interspecific competition in different situations.
This study additionally underlines the strong competitive advantage of western hemlock in the understory of forest managed with CCF. It also strongly suggests that the defoliations of Douglas fir juveniles associated with various pests and pathogens may have recently increased in southern Belgium, hypothetically because of a recent outbreak of C. pseudotsugae. Although alternative forest management methods such as CCF promoting tree diversity have sometimes been suggested to reduce biotic risks (Jactel, et al. 2009,Klapwijk, et al. 2016), natural regeneration of Douglas fir may still be strongly impacted by pests and pathogens, even in mixed stands.
Funding
This work was supported by the Accord-Cadre de Recherche et de Vulgarisation forestière, Walloon Region, Belgium.
Acknowledgements
We thank Benoît Mackels and Sevan Rozet who made most of the field measurements, and Sebastien Petit who carried out a preliminary study. We also thank two anonymous reviewers and Gary Kerr for their constructive and encouraging comments during the reviewing process. We are also grateful to Richard Ryan for his help to improve the English.
Supplementary material
The following supplementary material is available at Forestry online. Four files are available:
Supplementary material 1: Supplementary_material.pdf comprises the supplementary
figures and tables that are referenced in the main text.
Supplementary material 2: Data.RData comprises the data that can be loaded within the R
programming environment.
Supplementary material 3: Script_saplingGrowth_v16.R is a R script that comprises all the
presented statistical analyses.
Supplementary material 4: Script_saplingGrowth_v16.html provides the output of the
provided R script
References
Adam, B., Benoit, J.C., Sinoquet, H., Balandier, P. and Marquier, A. 2013 PiafPHOTEM - Un logiciel de seuillage de photographies hémisphériques.
Alderweireld, M., Burnay, F., Pitchugin, M. and Lecomte, H. 2015 Inventaire Forestier Wallon.
Résultats 1994 – 2012. SPW, DGO3, DNF, Direction des Ressources forestières: Jambes,
Belgique.
Balandier, P., Sinoquet, H., Frak, E., Giuliani, R., Vandame, M., Descamps, S. et al. 2007 Six-year time course of light-use efficiency, carbon gain and growth of beech saplings (Fagus sylvatica) planted under a Scots pine (Pinus sylvestris) shelterwood. Tree Physiol., 27 (8), 1073-1082. Bolker, B.M. 2008 Ecological models and data in R. Princeton University Press.
Canham, C.D., Denslow, J.S., Platt, W.J., Runkle, J.R., Spies, T.A. and White, P.S. 1990 Light regimes beneath closed canopies and tree-fall gaps in temperate and tropical forests. Can. J. For.
Res., 20 (5), 620-631.
Carlson, D.W. and Groot, A. 1997 Microclimate of clear-cut, forest interior, and small openings in trembling aspen forest. Agric. For. Meteorol., 87 (4), 313-329.
Casper, B.B. and Jackson, R.B. 1997 Plant Competition Underground. Annu. Rev. Ecol. Syst., 28, 545-570.
Collet, C. and Chenost, C. 2006 Using competition and light estimates to predict diameter and height growth of naturally regenerated beech seedlings growing under changing canopy conditions.
Forestry, 79 (5), 489-502.
Condrashoff, S.F. 2012 Bionomics of Three Closely Related Species of Contarinia Rond. (Diptera: Cecidomyiidae) from Douglas-fir Needles. Can. Entomol., 94 (4), 376-394.
Courbaud, B., Lafond, V., Lagarrigues, G., Vieilledent, G., Cordonnier, T., Jabot, F. et al. 2015 Applying ecological model evaludation: Lessons learned with the forest dynamics model Samsara2.
Ecol. Modell., 314, 1-14.
Dagnelie, P., Palm, R. and Rondeux, J. 2013 Cubage des arbres et des peuplements forestiers : Tables
Delagrange, S., Messier, C., Lechowicz, M.J. and Dizengremel, P. 2004 Physiological, morphological and allocational plasticity in understory deciduous trees: importance of plant size and light availability. Tree Physiol., 24 (7), 775-784.
Diaci, J., Kerr, G. and O’hara, K. 2011 Twenty-first century forestry: integrating ecologically based, uneven-aged silviculture with increased demands on forests. Forestry, 84 (5), 463-465. Domínguez, G., Köhl, M. and San-Miguel, J. 2015 European Forests: Status, Trends and Policy
Responses. In State of Europe’s forests 2015. Ministerial conference on the protection of forests in Europe (ed.), Madrid, pp. 65-110.
Drever, C.R. and Lertzman, K.P. 2001 Light-growth responses of coastal Douglas-fir and western redcedar saplings under different regimes of soil moisture and nutrients. Can. J. For. Res., 31, 2124-2133.
Dufour-Kowalski, S., Courbaud, B., Dreyfus, P., Meredieu, C. and De Coligny, F. 2012 Capsis: an open software framework and community for forest growth modelling. Ann. For. Sci., 69 (2), 221-233.
EPPO. 2016 Presence of Contarinia pseudotsugae suspected in Belgium. EPPO Reporting Service
1(2016/007).
EPPO. 2016 Presence of Contarinia pseudotsugae suspected in The Netherlands. EPPO Reporting
Service, 1 (2016/008).
Federer, C. and Tanner, C. 1966 Spectral distribution of light in the forest. Ecology, 47 (4), 555-560. Gaudio, N., Balandier, P., Perret, S. and Ginisty, C. 2011 Growth of understorey Scots pine (Pinus
sylvestris L.) saplings in response to light in mixed temperate forest. Forestry, 84 (2), 187-195.
IUSS Working Group WRB. 2015 World reference base for soil resources 2014, update 2015: International soil classification system for naming soils and creating legends for soil maps.
World Soil Resources Reports. Rome, p. 192.
Jactel, H., Nicoll, B.C., Branco, M., Gonzalez-Olabarria, J.R., Grodzki, W., Långström, B. et al. 2009 The influences of forest stand management on biotic and abiotic risks of damage. Ann. For. Sci.,
66 (7), 701-701.
Klapwijk, M.J., Hopkins, A.J.M., Eriksson, L., Pettersson, M., Schroeder, M., Lindelöw, Å. et al. 2016 Reducing the risk of invasive forest pests and pathogens: Combining legislation, targeted management and public awareness. Ambio, 45, 223-234.
Kneeshaw, D.D., Kobe, R.K., Coates, K.D. and Messier, C. 2006 Sapling size influences shade tolerance ranking among southern boreal tree species. J. Ecol., 94 (2), 471-480.
Kobe, R.K. 2006 Sapling growth as a function of light and landscape-level variation in soil water and foliar nitrogen in northern Michigan. Oecologia, 147 (1), 119-133.
Kobe, R.K., Pacala, S.W., Silander Jr, J.A. and Canham, C.D. 1995 Juvenile tree survivorship as a component of shade tolerance. Ecol. Appl., 5 (2), 517-532.
Kupferschmid, A.D. and Bugmann, H. 2013 Timing, light availability and vigour determine the response of Abies alba saplings to leader shoot browsing. Eur. J. For. Res., 132 (1), 47-60. Kupferschmid, A.D., Zimmermann, S. and Bugmann, H. 2013 Browsing regime and growth response
of naturally regenerated Abies alba saplings along light gradients. For. Ecol. Manage., 310 (0), 393-404.
Leuchner, M., Hertel, C., Rötzer, T., Seifert, T., Weigt, R., Werner, H. et al. 2012 Solar Radiation as a Driver for Growth and Competition in Forest Stands. In Growth and Defence in Plants:
Resource Allocation at Multiple Scales. R. Matyssek, H. Schnyder, W. Oßwald, D. Ernst, J.C.
Munch and H. Pretzsch (eds.), Springer Berlin Heidelberg, Berlin, Heidelberg, pp. 175-191. Lieffers, V.J., Messier, C., Stadt, K.J., Gendron, F. and Comeau, P.G. 1999 Predicting and managing
light in the understory of boreal forests. Can. J. For. Res., 29 (6), 796-811.
Ligot, G., Ameztegui, A., Courbaud, B., Coll, L. and Kneeshaw, D. 2016 Tree light capture and spatial variability of understory light increase with species mixing and tree size heterogeneity. Can.
Ligot, G., Balandier, P., Fayolle, A., Lejeune, P. and Claessens, H. 2013 Height competition between
Quercus petraea and Fagus sylvatica natural regeneration in mixed and uneven-aged stands. For. Ecol. Manage., 304, 391-398.
Ligot, G., Courbaud, B., de Coligny, F. and Jonard, M. 2013 SamsaraLight. Capsis4, Montpellier. Lochhead, K.D. and Comeau, P.G. 2012 Relationships between forest structure, understorey light
and regeneration in complex Douglas-fir dominated stands in south-eastern British Columbia. For. Ecol. Manage., 284, 12-22.
Messier, C., Doucet, R., Ruel, J.C., Claveau, Y., Kelly, C. and Lechowicz, M.J. 1999 Functional ecology of advance regeneration in relation to light in boreal forests. Can. J. For. Res., 29 (6), 812-823.
Messier, C., Parent, S. and Bergeron, Y. 1998 Effects of overstory and understory vegetation on the understory light environment in mixed boreal forests. J. Veg. Sci, 9 (4), 511-520.
Moravie, M.A., Durand, M. and Houllier, F. 1999 Ecological meaning and predictive ability of social status, vigour and competition indices in a tropical rain forest (India). For. Ecol. Manage.,
117 (1), 221-240.
Muscolo, A., Sidari, M. and Mercurio, R. 2007 Influence of gap size on organic matter decomposition, microbial biomass and nutrient cycle in Calabrian pine (Pinus laricio, Poiret) stands. For. Ecol.
Manage., 242 (2), 412-418.
Niinemets, Ü. 2006 The controversy over traits conferring shade-tolerance in trees: ontogenetic changes revisited. J. Ecol., 94 (2), 464-470.
Niinemets, Ü. and Valladares, F. 2006 Tolerance to shade, drought, and waterlogging of temperate Northern Hemisphere trees and shrubs. Ecol. Monogr., 76 (4), 521-547.
Oliver, C.D. and Larson, B.C. 1996 Forest stand dynamics: updated edition. John Wiley and sons: United States of America.
Petit, S. 2012 Etude de la régénération des douglasaies. Master, Gembloux Agro-Bio Tech, Université de Liège.
Petritan, A.M., von Lüpke, B. and Petritan, I.C. 2007 Effects of shade on growth and mortality of maple (Acer pseudoplatanus), ash (Fraxinus excelsior) and beech (Fagus sylvatica) saplings.
Forestry, 80 (4), 397-412.
Petritan, A.M., von Lüpke, B. and Petritan, I.C. 2009 Influence of light availability on growth, leaf morphology and plant architecture of beech (Fagus sylvatica L.), maple (Acer pseudoplatanus L.) and ash (Fraxinus excelsior L.) saplings. Eur. J. For. Res., 128 (1), 61-74. Pinheiro, J. and Bates, D. 2000 Mixed-effects models in S and S-PLUS. Springer Verlag.
Pinheiro, J., Bates, D., DebRoy, S., Sarkar, D. and R Core Team. 2018 nlme: Linear and Nonlinear Mixed Effects Models. R package version 3.1-137 Ed.
Pommerening, A. and Murphy, S. 2004 A review of the history, definitions and methods of continuous cover forestry with special attention to afforestation and restocking. Forestry, 77 (1), 27-44.
R Core Team. 2018 R: A Language and Environment for Statistical Computing. R Foundation for Statistical Computing, Vienna, Austria.
Rameau, J., Mansion, D. and Dume, G. 1989 Flore Forestière Francaise: guide écologique illustré, Vol.
1 :Plaines et Collines. Institut pour le developpement forestier, Ministère de l'Agriculture et
de la Pêche: Paris.
Raymond, P., Bédard, S., Roy, V., Larouche, C. and Tremblay, S. 2009 The irregular shelterwood system: review, classification, and potential application to forests affected by partial disturbances. J. For., 107 (8), 405-413.
Ruel, J.-C., Messier, C., Claveau, Y., Doucet, R. and Comeau, P. 2000 Morphological indicators of growth response of coniferous advance regeneration to overstorey removal in the boreal forest. For. Chron., 76 (4), 633-642.
Sanchez, C. 2013 La sylviculture Pro Silva en Wallonie: Mesures et recommandations du DNF. Forêt Wallonne, 60 p.
Soto, D.P., Jacobs, D.F., Salas, C., Donoso, P.J., Fuentes, C. and Puettmann, K.J. 2017 Light and nitrogen interact to influence regeneration in old-growth Nothofagus-dominated forests in south-central Chile. For. Ecol. Manage., 384, 303-313.
Stancioiu, P.T. and O'Hara, K.L. 2006 Morphological plasticity of regeneration subject to different levels of canopy cover in mixed-species, multiaged forests of the Romanian Carpathians.
Trees Struct. Funct., 20 (2), 196-209.
Stancioiu, P.T. and O’Hara, K.L. 2006 Regeneration growth in different light environments of mixed species, multiaged, mountainous forests of Romania. Eur. J. For. Res., 125 (2), 151-162. Stone, J.K., Hood, I.A., Watt, M.S. and Kerrigan, J.L. 2007 Distribution of Swiss needle cast in New
Zealand in relation to winter temperature. Australas. Plant Pathol., 36 (5), 445-454.
Sturrock, R.N., Frankel, S.J., Brown, A.V., Hennon, P.E., Kliejunas, J.T., Lewis, K.J. et al. 2011 Climate change and forest diseases. Plant Pathol., 60 (1), 133-149.
Ter Steege, H. 2018 Hemiphot.R: Free R scripts to analyse hemispherical photographs for canopy openness, 1 leaf area index and photosynthetic active radiation under forest canopies, p. 24. Tsai, W.-H. 1985 Moment-preserving thresholding-a new approach. Computer Vision Graphics and
Image Processing, 29 (3), 377-393.
Urquhart, J., Potter, C., Barnett, J., Fellenor, J., Mumford, J., Quine, C.P. et al. 2017 Awareness, concern and willingness to adopt biosecure behaviours: public perceptions of invasive tree pests and pathogens in the UK. Biol. Invasions, 19 (9), 2567-2582.
Van der Perre, R., Bythell, S., Bogaert, P., Claessens, H., Ridremont, F., Tricot, C. et al. 2015 La carte bioclimatique de Wallonie: un nouveau découpage écologique du territoire pour le choix des essences forestières. Forêt.Nature (135), 47-58.
Winton, L., Stone, J., Watrud, L. and Hansen, E. 2002 Simultaneous one-tube quantification of host and pathogen DNA with real-time polymerase chain reaction. Phytopathology, 92 (1), 112-116.