60
Life-Expectancy Risk and Pensions:
Who Bears the Burden?
Organisation de Coopération et de Développement Economiques
Organisation for Economic Co-operation and Development 05-Oct-2007 ___________________________________________________________________________________________
English text only DIRECTORATE FOR EMPLOYMENT, LABOUR AND SOCIAL AFFAIRS
EMPLOYMENT, LABOUR AND SOCIAL AFFAIRS COMMITTEE
OECD SOCIAL, EMPLOYMENT AND MIGRATION WORKING PAPERS No. 60 LIFE-EXPECTANCY RISK AND PENSIONS: WHO BEARS THE BURDEN?
Edward Whitehouse
JEL Classification: D81; H55; J11; J14
All Social, Employment and Migration Working Papers are now available through OECD's Internet website at http://www.oecd.org/els JT03233420
DELSA/EL
SA/WD/SE
M(2007)15
Un
cl
assi
fi
ed
E n gl ish text onDIRECTORATE
FOR
EMPLOYMENT,
LABOUR
AND
SOCIAL
AFFAIRS
http://www.oecd.org/els
OECD SOCIAL, EMPLOYMENT AND MIGRATION
WORKING PAPERS
http://www.oecd.org/els/workingpapers
This series is designed to make available to a wider readership selected labour market, social policy and migration studies prepared for use within the OECD. Authorship is usually collective, but principal writers are named. The papers are generally available only in their original language – English or French – with a summary in the other.
Comment on the series is welcome, and should be sent to the Directorate for Employment, Labour and Social Affairs, 2, rue André-Pascal, 75775 PARIS CEDEX 16, France.
The opinions expressed and arguments employed here are the responsibility of the author(s) and do not necessarily reflect those of the OECD
Applications for permission to reproduce or translate all or part of this material should be made to:
Head of Publications Service OECD
ACKNOWLEDGEMENTS
Edward Whitehouse is a principal economist in the Social Policy Division at the OECD. The paper has benefited from discussion at the OECD Working Party on Social Policy. A number of Delegates provided detailed comments: Asees Ahuja-Lind (Sweden), Olivier Bontout (European Commission), Arne Magnus Christensen (Norway), Konrad Haker and Volker Schmidt (Germany), Angelo Marano (Italy) and Geoff Rashbrooke (New Zealand).
Pablo Antolín, Martine Durand, John P. Martin, Mark Pearson and Monika Queisser of the OECD Secretariat also contributed significantly to the development of the paper, as did participants at a World Bank seminar in July 2007.
The OECD pension models use the APEX (Analysis of Pension Entitlements across Countries) infrastructure developed by Axia Economics with the support of the OECD and the World Bank.
FOREWORD
Risk occurs in pensions because they are long-term contracts. These contracts can involve up to four sets of actors: individuals, governments, employers and financial-services providers. Uncertainty about the future complicates planning for all these actors: if things turn out better than expected, who will reap the gains? If things turn out worse, who will bear the cost? No one wants to bear risk, but, in most cases, someone has to. Risks in pension systems have, in the past, been poorly measured or even just ignored.
This paper – the first of several that will examine how different kinds of uncertainty affect pensions – looks at life-expectancy risk. If life expectancy continues to grow in the future, how much of the cost of this will be borne by individual retirees in the form of reduced benefits or later retirement? The innovation of this paper is the focus on uncertainty in life-expectancy projections, not on the well known effects of forecast mortality improvements on pension-system finances.
Forthcoming work will look at five other kinds of risk that affect pension systems:
• Myopia risk: many individuals are short-sighted and so they consume too much when of working age and save too little for later, especially for retirement. This would lead to low pensions and costs for taxpayers and contributors if these retirees were entitled to old-age safety-net benefits. • Social and labour-market risks: life events — such as persistent low earnings, long-term
unemployment, caring for children or older relatives, divorce, widowhood — mean that workers may build up little in the way of retirement income. Again, the risk could be borne by individual retirees, by governments or by the contributors to pension systems.
• Purchasing-power risk: changes in costs and standards of living may not be adequately reflected in adjustments to pensions in payment, leaving older retirees particularly vulnerable. If pensions in payment fall under the poverty threshold, old-age safety nets would be activated.
• Policy risk: the political process may result in unanticipated changes in pension entitlements before or during retirement, perhaps leaving individuals with little or no time to respond by changing their labour-market or savings behaviour.
• Investment risk: pensions that are financed on a funded basis — that is, where assets are accumulated to pay income during retirement — involve risks related to the performance of the underlying investments.
SUMMARY
Two-thirds of pension reforms in OECD countries in the last 15 years contain measures that will
automatically link future pensions to changes in life expectancy. This quiet revolution in pension policy
means that the financial costs of longer lives will be shared between generations subject to a rule, rather than spreading the burden through potentially divisive political battles as happened in the past.
As a result, nearly half of OECD countries – 13 out of 30 – now have an automatic link between pensions and life expectancy in their retirement-income systems, compared with only one country (Denmark) a decade ago. Indeed, the spread of this policy has a strong claim as the major innovation in pension policy in recent years. The link to life expectancy has been achieved in four different ways:
• Seven countries – Australia, Hungary, Norway, Poland, Mexico, the Slovak Republic and Sweden have introduced mandatory defined-contribution plans.
• Italy, Poland and Sweden have substituted notional accounts for traditional, defined-benefit public schemes. Notional accounts are designed to mimic some of the features of defined-contribution plans: in particular, pension entitlements are calculated in a similar way to annuities. • Some countries have retained defined-benefit public schemes while introducing a link between life expectancy and pensions. Finland, Germany and Portugal will adjust benefit levels with life expectancy.
• Two countries will link qualifying conditions for pensions to life expectancy: the pension age in Denmark and the number of years of contributions needed for a full pension in France.
This paper projects life expectancy 50 years into the future. The central forecast is for additional life expectancy for men at age 65 (the typical standard pension age) to increase from 15.1 to 18.5 years. For women, the projected growth is from 18.7 to 22.2 years. However, these forecasts are uncertain. In the best 5% of cases, life expectancy for men is projected to be 20.1 years or more, compared with 17.1 years or less in the worst 5% of cases. The degree of uncertainty for women is similar to that for men.
These calculations underpin an analysis of how pension entitlements vary under the different scenarios for life expectancy and then on how life-expectancy risk is shared between individual retirees and pension providers (and, ultimately, contributors, taxpayers etc.)
The results show great diversity among the countries with links between life expectancy and pensions. The small mandatory contribution in Norway means only 10% of the financial cost of longer lives is borne by retirees. In Australia, this proportion is about 30% because the means-tested public pension limits the impact of longer lives on pension entitlements. The public, earnings-related pension in Hungary, which is not linked to life expectancy, will continue to provide the majority of retirement incomes.
At the other end of the spectrum, 100% or more of life-expectancy risk is borne by individual retirees in Finland, Poland and Portugal because the most important parts of the pension system are all linked to life expectancy.
It is hard to see why people approaching retirement should not bear at least some of the cost of their generation living longer than previous generations: living longer is in itself desirable. The optimum amount of life-expectancy risk that individual retirees should bear is therefore not zero. However, each individual has a lifecycle that includes periods as a contributor and as a beneficiary. There is a trade-off: greater certainty over retirement benefits versus greater certainty over the amount of contributions or taxes paid when working. Together, these factors suggest that individual retirees should bear some but not all life-expectancy risk.
The paper concludes by analysing which of the 17 OECD countries without a link to life expectancy in their pension systems might consider adopting such a policy and what lessons they might learn from the experience of countries that have already implemented it.
RESUMÉ
Les deux tiers des réformes des systèmes de retraite dans les pays de l’OCDE ces 15 dernières années comportent des mesures prises pour indexer de manière automatique les futures retraites sur l’évolution de l’espérance de vie. Cette révolution qui s’opère tranquillement dans les politiques de pensions signifie que les coûts financiers engendrés par des vies plus longues seront partagés entre les générations en appliquant une règle plutôt que de répartir cette charge sous l’action de conflits politiques, tel que dans le passé.
Par conséquent, près de la moitié des pays de l’OCDE – 13 sur 30 – ont maintenant des liens automatiques entre les pensions et l’espérance de vie dans leurs régimes de retraite, comparé à seulement un pays (Danemark) il y a dix ans. En effet, cette politique apparaît comme étant une des innovations plus importantes en matière de politiques de pensions ces dernières années. Le lien fait à l’espérance de vie a été réalisé de quatre manières différentes :
• Sept pays – Australie, Hongrie, Norvège, Pologne, Mexique, République slovaque et Suède ont introduit des régimes à cotisations définies obligatoires.
• L’Italie, la Pologne et la Suède ont remplacé des comptes fictifs pour des traditionnels régimes publics à prestations définies. Les comptes fictifs sont élaborés pour imiter quelques-unes des caractéristiques des régimes à contributions définies: particulièrement, les droits à pension sont calculés de la même manière que les annuités.
• Quelques pays ont retenu des régimes publics à prestations définies tout en introduisant un lien entre l’espérance de vie et les retraites. La Finlande, l’Allemagne et le Portugal ajusteront les prestations en fonction de l’évolution de l’espérance de vie.
• Deux pays vont lier les conditions d’éligibilité aux prestations de retraite à l’espérance de vie : l’âge de la retraite au Danemark et le nombre d’années de cotisations requis pour une retraite complète en France.
Ce document prévoit ce que sera l’espérance de vie dans 50 ans. La principale prévision réside dans une augmentation de l’espérance de vie passant de 15.1 à 18.5 ans chez les hommes âgés de 65 ans (âge normal de la retraite). Pour ce qui est des femmes, la croissance prévue va de 18.7 à 22.2 ans. Toutefois, ces prévisions sont incertaines. Dans le meilleur 5% des cas, l’espérance de vie pour les hommes est prévue de passer à 20.1 ans ou plus, comparé à 17.1 ans ou moins dans le pire 5% des cas. Le degré d’incertitude concernant les femmes est semblable pour les hommes.
Ces calculs étayent une analyse mesurant comment les droits à pension varient selon les différents scénarios pour l’espérance de vie et comment le risque lié à l’espérance de vie est partagé entre les individus retraités et les prestataires de retraites (et au bout du compte les cotisants, les contribuables, etc).
Les résultats montrent une grande diversité parmi les pays ayant lié l’espérance de vie et les retraites. Les petites cotisations obligatoires en Norvège signifient que seulement 10% du coût financier que représentent des vies plus longues incombe aux retraités. En Australie, le rapport est d’environ 30% parce que le régime public de retraite avec conditions de ressources limite l’impact causé par des vies plus
longues sur les droits à pensions. En Hongrie, le régime public de pensions en fonction des revenus qui n’est pas lié à l’espérance de vie continuera de fournir la grande partie des revenus de retraite.
A l’autre extrême, les individus retraités supportent 100% ou plus du risque lié à l’espérance de vie en Finlande, en Pologne et au Portugal parce que les composantes les plus importantes du système de pensions sont liées à l’espérance de vie.
Il est difficile de voir pourquoi les individus approchant de la retraite ne devraient pas assumer ne serait-ce qu’une partie du coût qu’implique le fait que leur génération vive plus longtemps que les générations précédentes : après tout, vivre plus longtemps est un avantage. Le montant optimum du risque lié à l’espérance de vie que les retraités devraient supporter n’est donc pas nul. En revanche, chaque individu a un cycle de vie qui comprend des périodes où il a été cotisant et d’autres où il a été bénéficiaire. Il y a là un équilibre avec un degré élevé de certitude en ce qui concerne les prestations de retraite par rapport à un degré élevé de certitude en ce qui concerne le montant des cotisations ou des impôts payés pendant la période travaillée. Ensemble, ces facteurs suggèrent que les individus à la retraite devraient supporter une partie mais pas la totalité du risque lié à l’espérance de vie.
Le document conclut en analysant quels seraient, parmi les 17 pays de l’OCDE qui n’ont pas instauré de lien à l’espérance de vie dans leurs régimes de retraite, ceux qui pourraient éventuellement songer à adopter une telle politique et quelles leçons ils pourraient tirer des expériences des autres pays qui ont eux déjà mis en place cette mesure.
TABLE OF CONTENTS
ACKNOWLEDGEMENTS... 3
FOREWORD... 4
SUMMARY... 5
LIFE-EXPECTANCY RISK AND PENSIONS: WHO BEARS THE BURDEN? ... 11
PART I RECENT PENSION REFORMS AND LIFE-EXPECTANCY RISK ... 14
I.1 What have countries done?... 14
I.1.1 Defined-contribution plans ... 15
I.1.2 Notional accounts... 15
I.1.3 Adjusting benefit levels ... 15
I.1.4 Adjusting qualifying conditions... 16
I.2 How do these reforms change the allocation of risk?... 16
I.2.1 Longevity risk ... 16
I.2.2 Life-expectancy risk... 17
PART II FORECASTING MORTALITY AND LIFE EXPECTANCY ... 18
II.1 Methods of forecasting future mortality rates ... 18
II.2 Measuring life-expectancy risk, stage one: past changes in mortality rates by age ... 20
II.3 Measuring life-expectancy risk, stage two: distribution of changes in mortality rates by age... 21
II.4 Stage three: uncertainty in mortality and life expectancy forecasts ... 23
PART III LIFE-EXPECTANCY RISK AND PENSION ENTITLEMENTS... 25
III.1 Life expectancy and future pension levels... 25
III.1.1 How pension levels change under central mortality projections ... 25
III.1.2 Uncertainty in future pension levels ... 26
III.2 Life expectancy and future pension wealth... 27
III.2.1 Interpreting the results ... 27
III.2.2 Uncertainty in pension wealth ... 29
III.3 What determines the allocation of life-expectancy risk? ... 31
III.3.1 Countries with defined-contribution plans... 31
III.3.2 Countries with notional accounts... 32
III.3.3 Countries that adjust DB pension levels to life expectancy... 32
III.3.4 Countries that adjust qualifying conditions to life expectancy ... 34
III.3.5 Mitigating the impact of life-expectancy increases without transferring risk... 35
PART IV CONCLUSIONS AND IMPLICATIONS FOR PENSION POLICY ... 36
IV.1 Pension reforms ... 36
IV.2 Linking pensions to life expectancy ... 36
IV.3 Who now bears the life-expectancy risk? ... 37
IV.4 How should life-expectancy risk be allocated?... 38
IV.5 Which countries next?... 39
BOXES
Box 1. How population projections for the United Kingdom have changed over time... 19 Box 2. Alternative methods of forecasting mortality and life expectancy ... 20 Box 3. Calculating annuity factors ... 28
TABLES
Table 1 Summary: how pensions depend on life expectancy, 17 OECD countries... 15 Table 2 Distribution of mortality improvements for men over five-year periods, 1945-2002,
G7 countries... 22 Table 3 Distribution of cumulative mortality improvements for men: Monte Carlo simulation
over 50 years... 23 Table 4 Life expectancy at age 65 in 2002, distribution of 50-year projections and change
from baseline... 23 Table 5 Average pension entitlement as a percentage of mean earnings with 2002 mortality
rates and under three scenarios for future life expectancy... 26 Table 6 Average pension wealth as a multiple of mean earnings with 2002 mortality rates
and under three scenarios for future life expectancy ... 30
FIGURES
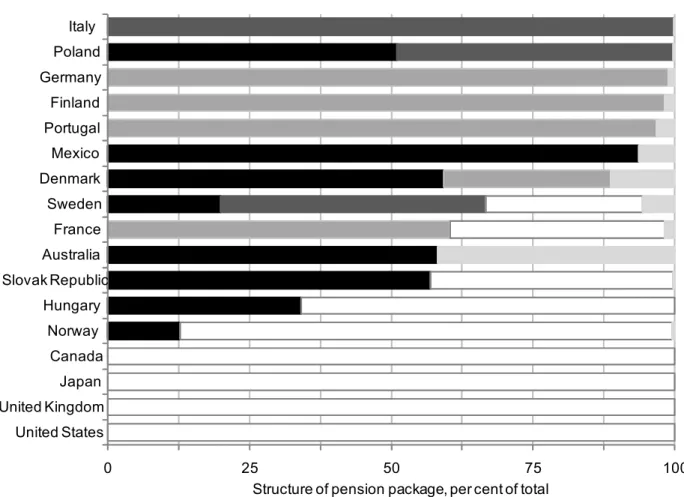
Figure 1 Who bears life-expectancy risk in mandatory pension programmes? ... 12 Figure 2 Changes in mortality rates for men by age and period, G7 countries, 1945-2002... 21 Figure 3 Structure of the pension package in 17 OECD countries... 33
LIFE-EXPECTANCY RISK AND PENSIONS: WHO BEARS THE BURDEN?
Edward Whitehouse
“I’ve often said that this is a high-class problem. It’s the result of something wonderful: the fact that we are living a lot longer.” (Bill Clinton, President of the United States, 1999)
“What dreams may come when we have shuffled off this mortal coil must give us pause: there’s the respect that makes calamity of so long life.” (Hamlet, Act 3, scene 1)
1. Older people today are living longer and healthier lives than previous generations did. When public pension systems were first established, people could typically look forward to only a few years of life in retirement (even if they were lucky enough to reach pension age). But in 2004, life expectancy at age 65 in OECD countries averaged 15 years for men and 19.5 years for women.
2. The impressive increase in life expectancy in the course of the last century should surely be celebrated as one of the great achievements of modern societies: “something wonderful” indeed. However, this trend poses huge challenges for economic, social and health policies in general, and for pension systems in particular. This might be called the “calamity of so long life”.
3. The challenges of growing life expectancy are both financial and political. While it is obvious that many pension systems needed or still need reforming to ensure long-term affordability, it is much less clear how the burden of such adjustments should be divided between today’s taxpayers, contributors and retirees and future retirees. Furthermore, the estimates of life-expectancy increases on which pension decisions have been based have, regrettably, often turned out to be wrong. The growth of life expectancy, especially at retirement age, has consistently been underestimated.
4. The disconcerting effect on pension policymaking has been the need for repeated reforms, as changes to parameters and rules succeeded in stabilising the financial situation only for short periods. However, many of the reforms of the past 10-15 years mean that pensions will take automatic account of both projected increases in life expectancy and the uncertainty surrounding the estimates of these increases. Indeed, the rapid spread of such life-expectancy adjustments in pension schemes has a strong claim to be the major innovation of pension policy in recent years.
5. This policy has both economic and political attractions. The automaticity of adjustments means that governments no longer face nasty surprises in pension financing when life-expectancy projections change. Increasing life expectancy provides a neat and logical justification for cutting future benefits that may be politically more palatable than alternative reforms that would also reduce pensions.
6. This paper investigates reforms to mandatory retirement-income provision that have introduced some kind of automatic adjustment to increases in life expectancy. It goes on to explore how they have changed the way in which the financial risk of increasing life expectancy is distributed. The aim is to measure the degree to which individual retirees shoulder the extra burden of greater life expectancy on the pension system or whether the cost is borne solely by pension providers (and, hence, by younger taxpayers and contributors).
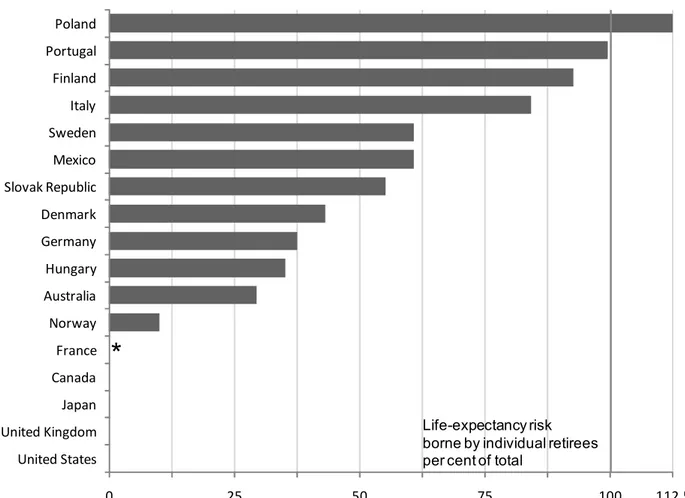
7. The empirical results, which are summarised in Figure 1, show huge variation between OECD countries in the allocation of life-expectancy risk. At least some of the life-expectancy risk is borne by individual retirees in 13 OECD countries. But this varies from 10% of the total in Norway and 30% in Australia up to 100% in Portugal and over 100% in Poland. (In the latter, the amount individuals get out of the pension system is higher the shorter is life expectancy.)
Figure 1 Who bears life-expectancy risk in mandatory pension programmes?
0 25 50 75 100 112.5 United States United Kingdom Japan Canada France Norway Australia Hungary Germany Denmark Slovak Republic Mexico Sweden Italy Finland Portugal Poland
*
Life-expectancy risk borne by individual retirees per cent of totalNote: See Part III below for details of the calculations. It is not possible to calculate a comparable figure for France even though there is an adjustment to qualifying conditions for pension related to life expectancy.
8. In the other 17 OECD countries, life-expectancy risk in mandatory pension programmes remains with pension providers. Typically, this is the government.1
9. In many of the 17 countries where life-expectancy risk remains with pension providers, cuts in future benefits or tightening of future eligibility conditions to reflect projected increases in life expectancy are planned. Nonetheless, past experience teaches that these projections will turn out to be wrong. Unlike the other 13 OECD countries, the link between life expectancy and pensions is not automatic, and so life-expectancy risk remains with pension providers rather than individual retirees.
10. The rest of the paper is structured as follows. Part I begins by describing the many reforms undertaken in OECD countries that have included life-expectancy adjustments as part of the package of changes to retirement-income provision. It also classifies the different sorts of risk associated with changes in mortality rates and life expectancy. The first factor in this taxonomy is whether the changes affect whole
generations or individuals within generations. The second element is whether they occur before or after
people have retired and begun to draw their pensions.
11. Part II briefly surveys different methods for estimating future mortality rates at different ages and, hence, life expectancy. Because this paper is about risk, the focus of the discussion is on the likely degree of uncertainty in life-expectancy forecasts, based on past experience, rather than on central
projections of future life expectancy.
12. These empirical estimates, along with the OECD pension models, are used in Part III to measure the effect of uncertainty over life expectancy on the pension entitlements of future retirees in different OECD countries. (It is this analysis that underpins the measure of the allocation of life-expectancy risk in Figure 1.) Part IV concludes with a discussion of policy implications of the results.
1. However, there are mandatory or quasi-mandatory occupational schemes in Iceland, the Netherlands, Sweden and Switzerland where pension sponsors are effectively employers, who, either individually or collectively, bear life-expectancy risk.
PART I.
RECENT PENSION REFORMS AND LIFE-EXPECTANCY RISK
13. When public pension schemes were established in the 20th century, retirees tended to be economically vulnerable and in need of financial support in old age. These pension schemes were usually financed wholly or mainly a pay-as-you-go basis, meaning that current contributions went to pay for current benefits in the expectation that the next generation of workers would pay for the current generation of workers in old age.
14. Today, the situation has changed. Pensioners are no longer the most vulnerable group in society: they are, on average in the OECD countries, neither richer nor poorer than the rest of the population (see, for example, Förster and Mira d’Ercole, 2005). And population ageing is jeopardising the social contract between generations embodied in pay-as-you-go financing of pensions. Today’s workers are pay high contributions and taxes to provide for the growing share of older people in the population with little realistic expectation of receiving such high benefits once they themselves retire.
15. As a consequence of these social and economic changes, most OECD countries have changed their pension systems since 1990. In around half of them, there have been major reforms that will significantly affect future entitlements (see OECD, 2007a, Part II.1 and Whiteford and Whitehouse, 2006 for a review). Typically, these reforms aimed at containing expenditures and stabilising contribution rates. Common measures were cuts in benefits, suspension of benefit increases or attempts to reverse the trend to early retirement. Other, more technical changes reduced future pensions by changing the way that earnings are measured to calculate benefits.
16. In many cases, reforms were parametric, keeping the overall structure and philosophy of public earnings-related schemes intact. Pensions, albeit reduced, were paid at constant levels according to pre-established rules regardless of how long the individual cohorts were expected to live. The risk that pension payments would become very expensive because retirees lived longer and longer continued to be fully borne by the pension system, that is by contributors and/or taxpayers.
17. Many other countries’ pension reforms were systemic: they changed the way in which future benefits will be determined. These systemic reforms are discussed next.
I.1 What have countries done?
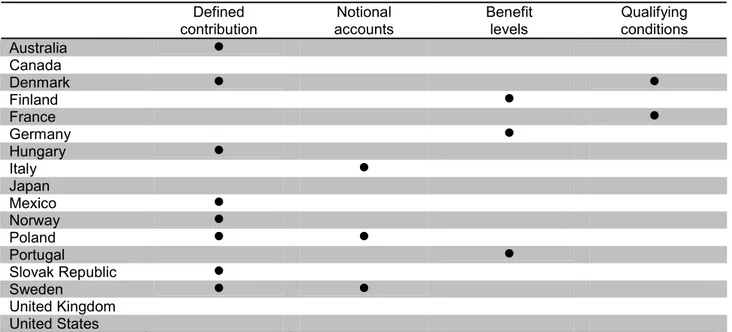
18. Table 1 summarises the four different ways in which future pensions will be affected by changes in life expectancy as a results of OECD countries’ pension reforms. The table includes the 13 OECD countries that have such a link in their pension systems. Despite this common feature of these reforms, this paper is the first time that the four different policies have been analysed together. For comparison, the
I.1.1 Defined-contribution plans
19. Since the late 1990s, Hungary, Poland, the Slovak Republic, and Sweden have introduced funded defined-contribution (DC) plans as a substitute for part of their public, earnings-related pension schemes. Australia’s DC plan was added in 1992 to the existing means-tested public pension. Norway introduced a mandatory DC pension from the beginning of 1996, again on top of public provision for retirement. In Mexico, the public earnings-related pension was entirely replaced by DC plans in 1997. In Denmark, DC occupational plans have, for a long time, covered the vast majority of the workforce.
20. In a DC plan, contributions and investment returns accumulate in an individual account. At retirement, the pension capital needs to be transformed into a regular pension payment, known as an annuity. In DC schemes, adjustments to life-expectancy changes are automatic. Benefits will be lower the higher life expectancy is at the time of retirement because of the longer expected duration of the pension payment, which is reflected in the annuity rate offered by the provider.
Table 1 Summary: how pensions depend on life expectancy, 17 OECD countries Defined
contribution accounts Notional Benefit levels Qualifying conditions
Australia ! Canada Denmark ! ! Finland ! France ! Germany ! Hungary ! Italy ! Japan Mexico ! Norway ! Poland ! ! Portugal ! Slovak Republic ! Sweden ! ! United Kingdom United States
Note: The table looks only at mandatory parts of the pension system. Voluntary, private DC plans have broad coverage in Canada, Germany, the United Kingdom and the United States (see the discussion in OECD, 2007a, Part II.2).
Source: OECD (2007a).
I.1.2 Notional accounts
21. Italy, Poland and Sweden have replaced DB, earnings-related public pensions with notional-accounts schemes. Although they are pay-as-you-go financed, notional accounts mimic some of the features of funded DC schemes. At retirement, the notional capital is transformed into an annuity, but at a rate set by the government. Again, this calculation is designed to reflect changes in life expectancy over time.
I.1.3 Adjusting benefit levels
22. Traditional defined-benefit (DB) schemes pay the same retirement benefit regardless of changes in life expectancy over time. Nevertheless, some countries with DB plans have recently introduced
measures that will adjust either the benefit level or the qualifying conditions to reflect changes in life expectancy.
23. Starting with the benefit level, Finland and Portugal (which have traditional DB schemes) will link future benefit levels directly to changes in life expectancy around the normal pension eligibility age.
24. In Germany, the adjustment will be more complex, reflecting the financial sustainability of the pension system as measured by the ratio of pensioners to contributors. If life expectancy increases, then,
ceteris paribus, the number of pensioners per contributor increases and so benefits will fall.
I.1.4 Adjusting qualifying conditions
25. Another way to adjust for increasing life expectancy is to raise the standard retirement age and/or the number of contribution years necessary to get a full benefit. Denmark will link the pension eligibility age to life expectancy from 2027 (once an increase from 65 to 67 is already in place).
26. France, in the 2003 pension reform, linked the required number of years of contributions to get a full, unreduced pension to life expectancy. As in Denmark, this will begin in the future once already planned increases are in place.
I.2 How do these reforms change the allocation of risk?
27. All of these pension reforms have changed the way that the financial consequences of changes in life expectancy are allocated between the different actors in the pension system. In the discussion of risk transfer, it is important, however, to distinguish between what are here called longevity and life-expectancy risks.2
I.2.1 Longevity risk
28. Longevity risk occurs in a world without annuities, where people build up savings during their working lives and then spend them down during retirement. Because how long people will live is uncertain, there is a risk that they might outlive their retirement capital. In OECD countries, such a scenario is now largely a theoretical one: both public and private pension schemes tend to pay benefits in the form of lifelong benefits.
29. These annuities are insurance against longevity risk. The risk of living a long time, and so needing more resources in retirement, is pooled among the annuitants or pension-scheme members. The main policy issue relating to longevity risk is whether annuity markets work properly, which is addressed by the “money’s worth” literature. This issue is not treated further in this paper.3
2. The definitions of “life-expectancy” and “longevity” risk adopted here are much the most common usage in the literature. Some papers, however, use the terms interchangeably. Finally, some authors prefer to
I.2.2 Life-expectancy risk
30. On the other hand, life-expectancy risk relates to the increase in projected length of life of a cohort or generation (whereas longevity risk relates to individuals). This paper distinguishes life-expectancy changes in two periods: first, the time between when pension entitlements were earned and when the beneficiary retires; and, secondly, increases in life expectancy that occur during the retirement of a particular cohort.
31. The risks of unexpected changes in life expectancy during retirement are borne by those who finance the pension scheme, which is either younger taxpayers in the case of pay-as-you-go schemes, or by private pension providers in the case of funded schemes (with the ultimate burden being borne by the owners of those pension companies, contributors to the pension fund, or even taxpayers more generally, depending on the role played by government in guaranteeing private pensions).
32. More interesting issues are raised by uncertainty over life expectancy between the time that people make pension contributions and the time that they draw the pensions. The degree of uncertainty is also far greater for workers than for people during retirement because of the longer time period.
33. In DC and notional accounts schemes, most of the life-expectancy risk is borne by the individual. The annuity provider (which is the government under notional accounts schemes), will set the rate at which the accumulated balances are converted into a flow of pension payments using projected life expectancy at the time of retirement. The annuity provider, of course, bears the financial post-retirement risk that the projections on which the annuity calculation was based turn out to be wrong. But the individual bears the pre-retirement risk that the accumulated amount is too low to yield a sufficient pension benefit because life expectancy has increased.
34. In traditional DB and points schemes, life-expectancy risk is born by the pension provider — government or employer — and so ultimately by taxpayers, shareholders etc. The benefits that individuals accrue do not change as life expectancy changes. But some of the reforms described above have shifted some of the financial risk of increasing life expectancy to individuals. This has been done in a number of ways, which have significantly different effects on pension contributors and beneficiaries.
35. Before looking at this issue in detail, the complicated issue of forecasting mortality and life expectancy has to be considered. If the extent of future increases of life expectancy is known with a high degree of certainty, individuals can plan for their retirement in advance. People may choose to put more money aside for retirement or they may plan on working longer to reach higher benefit levels. But what if life expectancy grows more rapidly than anticipated? Retirees may find themselves confronted with much lower benefits than they expected and only few possibilities to adapt their savings behaviour at such a late stage in life. Part II of the paper, which follows, will examine how life-expectancy increases are projected and, based on past experience, will show the degree of uncertainty in these forecasts.
PART II.
FORECASTING MORTALITY AND LIFE EXPECTANCY
36. Past projections of life expectancy have turned out to be wrong. Given the difficulties of any kind of forecast, so much is unsurprising. However, life-expectancy projections have consistently
under-predicted mortality improvements. For example, the National Academy of Sciences, in a study of
UN population projections, showed under-predictions of the population at older ages in Europe and North America of around 10% just 15 years forward (National Research Council, 2000).
37. Box 1 explores the experience of the United Kingdom: undoubtedly, other OECD countries have seen similar underestimates. The unwelcome experience of error in projections has encouraged the development of new techniques for forecasting life expectancy as a way of improving the information on which pension-policy decisions are made.
II.1 Methods of forecasting future mortality rates
38. Two broad approaches have been used to project mortality (see Box 2). The first, “biological” approach attempts to build likely future mortality from medical scenarios. However, this approach has consistently underestimated life expectancy. Therefore, demographers have more recently focused on simple extrapolation of past trends, arguing (based on past experience) that there is no reason to expect medical progress to slow.
39. Lee and Carter (1992) both formalised and popularised extrapolative methods, illustrating their technique by projecting past mortality trends to future mortality rates in the United States until 2065.4 Their method has since been used to look at a range of other countries.5 The approach has also been
adopted by official forecasters, such as the United States Census Bureau in its population forecasts based on the 2000 census (Hollmann, Mulder and Kallan, 2000).
40. This paper also uses extrapolative techniques: the way in which the forecasts were generated is explained over the next few pages. The process is divided into three stages. The first looks at the raw data on past mortality-rate changes. The second stage processes the data to generate a probability distribution for the change in mortality rates at different ages over five-year periods. The third stage uses standard statistical techniques to generate forecasts of the likely outcome for mortality rates over a longer forecasts period: in this case, 50 years. The impact on life expectancy is illustrated using these different projections.
Box 1. How population projections for the United Kingdom have changed over time
The Government Actuary’s Department is responsible for projecting the population of the United Kingdom, which, among many other things, provides the basis for forecasts of future public spending on pensions. A result of these projections that is easy to understand is the future number of people aged 65 and over. The chart shows the number of older people predicted in the future from 2011 to 2061. The different lines show the different years in which the projections were published. In 1981, for example, the number aged 65+ was expected to be just over 9 million in 2011, rising to a peak of just over 12 million in 2036 and declining thereafter. The 1985 and 1989 forecasts had a similar pattern, albeit with half a million extra pensioners in 2011 and a million more in 2036 than predicted earlier.
Official projections of population aged 65+ for the years 2011-2061, United Kingdom
10 12 14 16 18 P opu la tion 65 + ( m ill io ns ) 2010 2020 2030 2040 2050 2060 1981 1985 1989 1992 1996 2000 2004 Year
Source: Government Actuary’s Department, United Kingdom.
The 1992 and 1996 projections involved a substantial revision: the peak population aged over 65 was 15 million in the latter, compared with the 12 million that had been expected in 1981. In contrast, the later forecasts alter the pattern over time of the number of older people. In the 2000 forecast, instead of a decline in the number of 65+ year olds, this was expected to remain constant after 2036. The 2004 projection, in yet another contrast, showed a continued increase in the population aged over 65 from 2011 to 2061.
The scale of these changes in forecasts is huge. For 2036, for example, the earliest forecast (when the future pensioners were aged 10 and above) has increased by 36%: from around 12 million to 16.5 million. For 2051, the increase in projections over time has been greater still: 65%.
Box 2. Alternative methods of forecasting mortality and life expectancy
The future for human mortality and life expectancy is the subject of a heated debate. Advocates of pure extrapolative methods argue that there is no biological reason to place a limit on human life. Analysts have repeatedly claimed that humankind has reached the biological limit only for mortality improvements to surpass their projections, sometimes within five years or fewer (Oeppen and Vaupel, 2002). Others have placed a limit on human life expectancy with varied bio-medical justifications.
For example, success in treating infectious diseases during the first half of the 20th century reduced the burden of mortality in OECD countries hugely, particularly at younger ages, through both treatments and immunisation and vaccination programmes. Improved sanitation and the use of refrigerators also played a major part in reducing the burden of infectious disease. A second wave of mortality improvement, beginning in the 1960s, came from better treatment of cardio-vascular (heart) disease. Some epidemiologists argue that any major future mortality improvements will have to come at older ages (thereby reducing their effects on life expectancy at birth) and will need to address chronic, degenerative conditions (such as Alzheimer’s disease), that have not yielded as easily to medical advances as did bacterial infections.
Other analysts have pointed to a wave of health risks that might curtail future mortality improvements. For example, Olshansky et al. (2005) argue that the “epidemic” of obesity in most OECD countries will slow future increases in life expectancy. Concerns over future potential influenza pandemics or the spread of multi-drug resistant bacterial infections (reversing the effect of treatments developed in the 20th century) are widely reported in the mainstream as well as the professional press.
II.2 Measuring life-expectancy risk, stage one: past changes in mortality rates by age
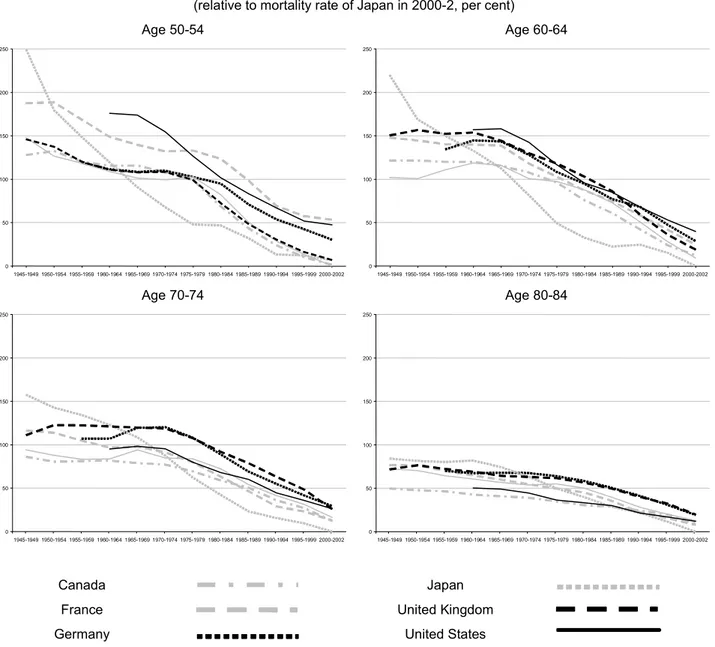
41. The starting point for any extrapolative method of projecting mortality rates is the raw data on past experience of changing mortality. A selection of these data for the G7 countries is shown in Figure 2. The horizontal axis of each chart shows the time period, ranging from 1945-49 to 2000-02. The vertical axis shows the mortality rate in that period relative to the best-performing country at the end of the data period. The rationale for normalising the results in this way is to investigate whether or to what extent mortality rates at different ages have converged between countries over time (for example, through the spread of best practice in both treatments and prevention of disease). For reasons of space, the data shown are for men. Nonetheless, the patterns for women are similar.
42. The charts show common trends across the seven countries. At age 50-54, for example, there has been a rapid and consistent improvement in mortality. At ages 60-64 and 70-74, until the late 1960s or early 1970s, there was little improvement in mortality in most countries. At the highest age range considered, 80-84, mortality improvements have been less rapid than at younger ages. Japan had the highest mortality rates at the beginning of the period, and the lowest at the end. There is clear evidence of convergence in mortality rates. However, some significant differences between countries remain at the end of the period. For example, at the 50-54 age range, mortality rates in France and the United States are around 50% higher than they are in Canada, Italy, Japan and the United Kingdom.
Figure 2 Changes in mortality rates for men by age and period, G7 countries, 1945-2002
(relative to mortality rate of Japan in 2000-2, per cent)
Age 50-54 Age 60-64 0 50 100 150 200 250 1945-1949 1950-1954 1955-1959 1960-1964 1965-1969 1970-1974 1975-1979 1980-1984 1985-1989 1990-1994 1995-1999 2000-2002 0 50 100 150 200 250 1945-1949 1950-1954 1955-1959 1960-1964 1965-1969 1970-1974 1975-1979 1980-1984 1985-1989 1990-1994 1995-1999 2000-2002 Age 70-74 Age 80-84 0 50 100 150 200 250 1945-1949 1950-1954 1955-1959 1960-1964 1965-1969 1970-1974 1975-1979 1980-1984 1985-1989 1990-1994 1995-1999 2000-2002 0 50 100 150 200 250 1945-1949 1950-1954 1955-1959 1960-1964 1965-1969 1970-1974 1975-1979 1980-1984 1985-1989 1990-1994 1995-1999 2000-2002 Canada France Germany Italy Japan United Kingdom United States
Source: OECD calculations using the Human Mortality Database (University of California, Berkeley and Max Planck Institute for
Demographic Research).
II.3 Measuring life-expectancy risk, stage two: distribution of changes in mortality rates by age
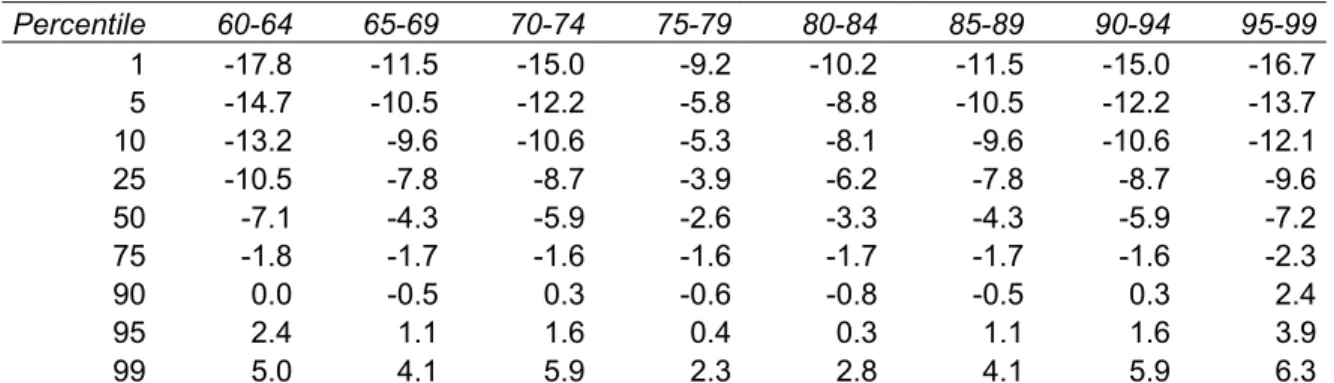
43. The second stage of the modelling of mortality and life-expectancy uncertainty is to look at the distribution of past changes in mortality rates between each five-year measurement period. The data are pooled; the changes in all seven countries are aggregated, giving 72 observations in total for each age band (allowing for missing data: see Figure 2). The results of this second stage of the analysis are shown in Table 2.
44. Using the 60-64 age range as an illustration, the results show a large range of changes in mortality rates over different 5-year periods: in 1% of cases, mortality rates fell by 17.8% or more, while, at the other end of the scale, mortality actually increased by 5% in 1% of cases. The median declines in
mortality show an inverted U-shape with age: falls in excess of 7% per five years at ages 60-64 and 95-99, compared with just 2.6% for age 75-79. This confirms the findings of Kannisto et al. (1994) that the rate of mortality decline had been accelerating over recent decades for ages 80 to 100. Mortality declines at older ages now take place more rapidly than at lower ages, reversing the historical pattern.6
45. The widely-used Lee-Carter method (cited previously) uses regression analysis on these data to project the distribution of future mortality rates based on past experience. Although it has been demonstrated that this approach gives better central predictions of life expectancy than methods used earlier, the predicted distribution of future mortality rates and life expectancy around the central forecast is very small (Alho, 1992).
46. For example, Antolín (2007) used the Lee-Carter method for six OECD countries. For the Netherlands, the central projection for life expectancy at age 65 in 2050 was 16.7 years. The range of uncertainty in the results was very small: it is predicted that there is a 95% probability that life expectancy at age 65 will be 16.1 years or more and a 95% probability that it will be 17.2 years or less. Similar ranges of uncertainty were found for France, Spain, Sweden and the United Kingdom.
47. The implication of this methodology is therefore that we know with a strong degree of certainty how life expectancy will turn out in the future, which past experience suggests is incorrect. Moreover, given the state of uncertainty — Will we see an obesity epidemic? What rate of progress can we expect in treating cancers, or the mental problems of old age? Can we expect a “bird-flu” pandemic? — it seems intuitively absurd to believe that we can be so exact with our predictions about life expectancy 50 years into the future.
48. So, the regression approach seems to promise better estimates of life expectancy than we have had in the past, but is implausibly certain about them. This is not an abstract problem: if we really were that certain about the future, the case for having automatic adjustments for life expectancy in the pension system would be much reduced. We might as well just pre-announce how we were going to deal with the increase in life expectancy through parametric reforms. In order to get around this problem, and to get more plausible estimates about how uncertain the future is, this paper uses a “non-parametric” approach to model the future.
Table 2 Distribution of mortality improvements for men over five-year periods, 1945-2002, G7 countries
Percentile 60-64 65-69 70-74 75-79 80-84 85-89 90-94 95-99 1 -17.8 -11.5 -15.0 -9.2 -10.2 -11.5 -15.0 -16.7 5 -14.7 -10.5 -12.2 -5.8 -8.8 -10.5 -12.2 -13.7 10 -13.2 -9.6 -10.6 -5.3 -8.1 -9.6 -10.6 -12.1 25 -10.5 -7.8 -8.7 -3.9 -6.2 -7.8 -8.7 -9.6 50 -7.1 -4.3 -5.9 -2.6 -3.3 -4.3 -5.9 -7.2 75 -1.8 -1.7 -1.6 -1.6 -1.7 -1.7 -1.6 -2.3 90 0.0 -0.5 0.3 -0.6 -0.8 -0.5 0.3 2.4 95 2.4 1.1 1.6 0.4 0.3 1.1 1.6 3.9 99 5.0 4.1 5.9 2.3 2.8 4.1 5.9 6.3
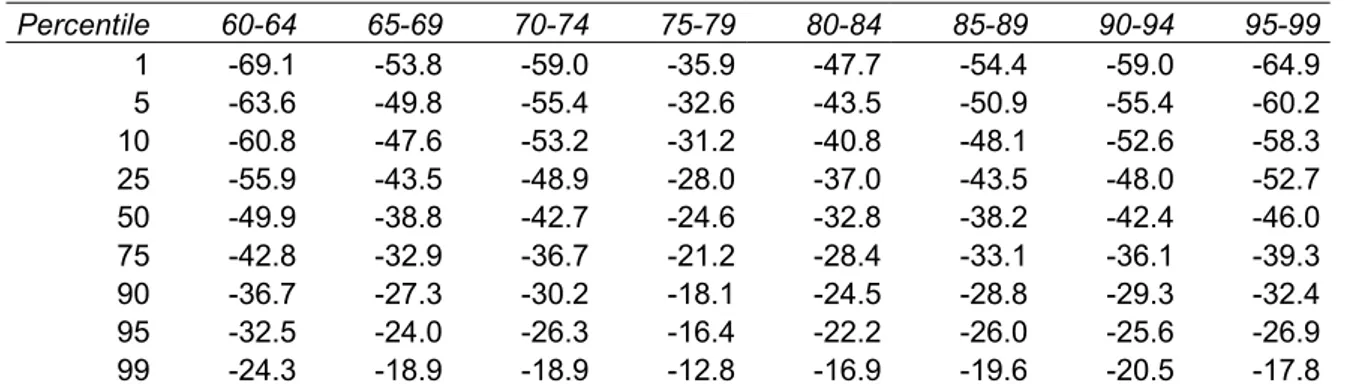
II.4 Stage three: uncertainty in mortality and life expectancy forecasts
49. The third and final step of the projection of future life expectancy uses probability analysis. It is based on Monte-Carlo simulation. The Monte-Carlo method provides approximate solutions to a variety of mathematical problems by performing statistical sampling experiments. It uses pre-defined probability distributions of risk variables and sampling from a random number sequence to perform modelling over many simulations or trials.
50. The projections are generated from 2 000 draws7 of random numbers applied to the distributions
in Table 2 above. In each case, a series of 10, five-year period changes in mortality rates were generated and then aggregated. The results of the exercise are shown in Table 3. Each cell of the table shows the change in mortality rates projected for the 50-year period. At age 60-64, for example, the projection is for a decline (with 98% certainty) of mortality rates of between 24 and 69%. In other words, there is a 1% probability that the decline will be of 24% or less, and a 1% probability that the decline will exceed 69%.
Table 3 Distribution of cumulative mortality improvements for men: Monte Carlo simulation over 50 years
Percentile 60-64 65-69 70-74 75-79 80-84 85-89 90-94 95-99 1 -69.1 -53.8 -59.0 -35.9 -47.7 -54.4 -59.0 -64.9 5 -63.6 -49.8 -55.4 -32.6 -43.5 -50.9 -55.4 -60.2 10 -60.8 -47.6 -53.2 -31.2 -40.8 -48.1 -52.6 -58.3 25 -55.9 -43.5 -48.9 -28.0 -37.0 -43.5 -48.0 -52.7 50 -49.9 -38.8 -42.7 -24.6 -32.8 -38.2 -42.4 -46.0 75 -42.8 -32.9 -36.7 -21.2 -28.4 -33.1 -36.1 -39.3 90 -36.7 -27.3 -30.2 -18.1 -24.5 -28.8 -29.3 -32.4 95 -32.5 -24.0 -26.3 -16.4 -22.2 -26.0 -25.6 -26.9 99 -24.3 -18.9 -18.9 -12.8 -16.9 -19.6 -20.5 -17.8
Source: OECD calculations using the Human Mortality Database (University of California, Berkeley and Max Planck Institute for
Demographic Research).
51. What do these changes in mortality rates mean for the range of uncertainty in projections of life expectancy? The changes in mortality rates at different ages are applied to the OECD average mortality rates for 2002 to generate life expectancy both currently and in 50 years’ time. The results are shown in Table 4.
Table 4 Life expectancy at age 65 in 2002, distribution of 50-year projections and change from baseline
Baseline 5% 25% Median 75% 95%
Life expectancy (years)
Men 15.1 20.1 19.1 18.5 18.0 17.1
Women 18.7 23.7 22.8 22.2 21.7 20.9
Change (years)
Men 0.0 +5.0 +4.0 +3.4 +2.9 +2.0
Women 0.0 +5.0 +4.1 +3.5 +3.0 +2.2
Source: OECD calculations using the Human Mortality Database (University of California, Berkeley and Max Planck Institute for
Demographic Research) and baseline mortality rates for 2002 from the United Nations/World Bank population database.
52. Current life expectancy for men at age 65 is 15 years on average in the OECD countries while for women it is nearly 19 years. The median projection for 50 years hence using the simple, extrapolative method is 18.5 years for men and over 22 years for women, increases of around 3.5 years over the period. The 90% confidence interval is for an increase in life expectancy at age 65 of between 2 and 5 years for men over the forecast period and a slightly narrower range for women. The inter-quartile range is for an increase of between 3 and 4 years for both men and women.
53. Projections about what will happen to pension entitlements in the future have to take account of increases in life expectancy. In the past, these projections have turned out to be wrong, and policymakers have repeatedly been “surprised” by the extent of increases in life expectancy, even for those aged 65. New techniques have improved future mortality projections. But getting a good mean projection of life expectancy is insufficient without an understanding of the probability distribution around that mean.
54. The Monte-Carlo simulations reported in this Part of the paper suggest that men reaching 65 in 50 years time will live to be 83.5 on average, compared with around 80 for those reaching 65 now. However, there is a 5% probability that they will only have a life expectancy of 82, and a 5% probability that they will live to be 85 on average. The range of uncertainty is similar for women.
55. These different outcomes will have different effects either on pension recipients or on those who finance pensions, depending on the design of the pension system. Part III of the paper uses these estimates to see who bears the financial risks resulting from uncertain future changes in life expectancy.
PART III.
LIFE-EXPECTANCY RISK AND PENSION ENTITLEMENTS
56. The forecasts of mortality risk derived in the previous section are now used to analyse how life-expectancy risk might affect future pension benefits. The simulation of future mortality rates, which was based on pooled data for the G7 countries, is now used for all OECD countries. This means that the degree of life-expectancy risk assumed in the analysis is the same for all countries, allowing the allocation of the risk to be identified separately from the potential degree of risk.
57. In addition to the simulations of mortality outlined above, the analysis uses the OECD pension models. It adopts the same methodology (see OECD, 2005, 2007a), including the “steady-state” assumption of following workers who enter the labour market today through to their retirement. The models calculate pension entitlements under today’s pension rules (including legislated changes) over a full career from age 20 until workers reach the normal pension age in the respective country.
III.1 Life expectancy and future pension levels
58. To assess the impact of life-expectancy risk on pension entitlements, benefits are modelled under four different sets of mortality rates. The baseline is the mortality rates by sex and age for 2002 from the UN/World Bank population database. This shows pensions should life expectancy remain unchanged in the future. The other three use the projections developed above: the median projection and high and low life expectancy respectively (the 5th and 95th percentiles of the distribution). These are calculated at the approximate point when a person entering the labour market today would reach normal pension age.
59. Table 5 shows the average pension entitlement in these four scenarios, covering all mandatory parts of the pension system. The average is calculated using the earnings distribution as weights (see OECD, 2007a for a discussion). Thus, it takes account of the fact that there are more people with lower earnings than with average earnings and fewer people with high earnings. The average pension level is then expressed as a multiple of economy-wide average earnings, and so can be interpreted in a similar way to the familiar replacement rate.
III.1.1 How pension levels change under central mortality projections
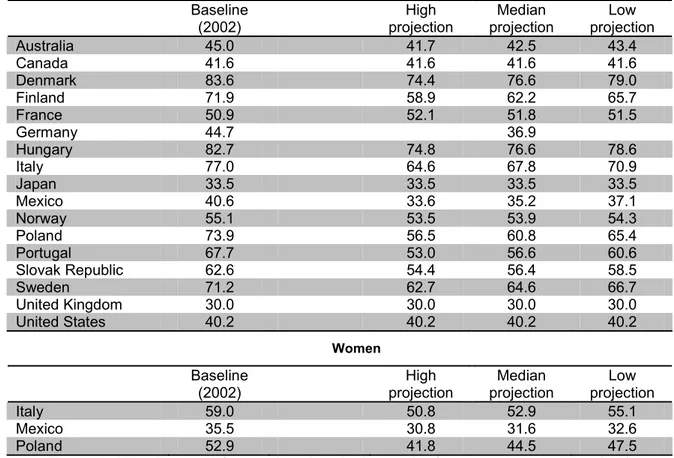
60. In the four countries without adjustments to life expectancy – Canada, Japan, the United Kingdom and the United States – the pension is the same in all four scenarios. In the other cases, pensions will be lower with projected improvements in life expectancy than with life expectancy at its 2002 level.
61. Comparing the 2002 baseline mortality with the median projections, pensions fall the most in Portugal – by 11% of average earnings – and Poland – by 13% of average earnings for men and 8% for women. In relative terms, the decline is similar in Germany to these two countries, but in absolute terms the fall is only around eight percentage points in Germany.
62. The smallest decline – just one percentage point – is in Norway. In France, the replacement rate is expected to increase by a small amount over time as life expectancy increases. While individuals will have to work longer to receive the same public pension, they will receive a higher occupational pension as a consequence of working longer.
63. In Italy, Mexico and Poland, women will be able to retire at 60 while normal pension age for men is already age 65 (or it will be by the time new labour-market entrants retire). In all three countries, women’s pensions are expected to fall by less in absolute terms than men’s as life expectancy improves over time.
III.1.2 Uncertainty in future pension levels
64. Comparing average pensions under the low and high life-expectancy scenarios gives an indication of the degree of uncertainty over future pension entitlements that result from life-expectancy adjustments.
65. The largest difference in replacement rates between the two scenarios is for men in Poland. Replacement rates are projected to be 56.5% in the high life-expectancy scenario, compared with 65.4% under the low projection, giving a differential of nine percentage points. This difference is six points or more in Finland and Portugal.
Table 5 Average pension entitlement as a percentage of mean earnings with 2002 mortality rates and under three scenarios for future life expectancy
Men Baseline
(2002) High projection projection Median projection Low
Australia 45.0 41.7 42.5 43.4 Canada 41.6 41.6 41.6 41.6 Denmark 83.6 74.4 76.6 79.0 Finland 71.9 58.9 62.2 65.7 France 50.9 52.1 51.8 51.5 Germany 44.7 36.9 Hungary 82.7 74.8 76.6 78.6 Italy 77.0 64.6 67.8 70.9 Japan 33.5 33.5 33.5 33.5 Mexico 40.6 33.6 35.2 37.1 Norway 55.1 53.5 53.9 54.3 Poland 73.9 56.5 60.8 65.4 Portugal 67.7 53.0 56.6 60.6 Slovak Republic 62.6 54.4 56.4 58.5 Sweden 71.2 62.7 64.6 66.7 United Kingdom 30.0 30.0 30.0 30.0 United States 40.2 40.2 40.2 40.2 Women Baseline
(2002) High projection projection Median projection Low
Italy 59.0 50.8 52.9 55.1
Mexico 35.5 30.8 31.6 32.6
Poland 52.9 41.8 44.5 47.5
66. At the other end of the spectrum, the smallest differentials – 0.8 and 1.6 percentage points respectively – are found in Norway and Australia. Replacement rates are marginally higher in France in the high life-expectancy, which is due to the effect of the longer contribution period increasing occupational-pension benefits.
67. Women’s pension entitlements are less susceptible to life-expectancy risk than men’s are in the three countries with a lower pension age for women.
III.2 Life expectancy and future pension wealth
68. Changes in pension entitlements are not sufficient in themselves to assess the risk borne by different actors in the provision of retirement income. As life expectancy increases, the pension is paid out for longer, and so is more valuable to the individual, and equally more costly to the provider.
69. Pension wealth is a comprehensive measure of the value of pensions, because it takes account of the how the payment evolves over time and the expected duration of pension payment. The latter, in turn, depends on national life expectancy and pension eligibility age. Box 3 explains in formal terms how pension wealth is calculated. To summarise, pension wealth is the “stock” or present value of the pension, whereas the replacement rate or the pension level measures the “flow” of benefits in any one year (see also Queisser and Whitehouse, 2006 for a more detailed discussion). As with the pension entitlements, the results are averaged across workers on different levels of earnings. Pension wealth is expressed as a multiple of annual, economy-wide average earnings.
III.2.1 Interpreting the results
70. Before presenting the pension-wealth results, it is useful first to look at two benchmark types of pension plan to ease interpretation of both measures: average pension level and average pension wealth.
71. Pension levels and pension wealth vary under different scenarios for mortality rates in different ways depending on the type of pension plan. Consider first a pure DB scheme, where the benefits are “defined” as some function of individual earnings. Replacement rates and pension levels do not vary with life expectancy, precisely because the benefit is defined. However, increased life expectancy increases pension wealth because of the longer projected duration over which benefits will be paid. This pattern – constant replacement rate and varying pension wealth – holds for all schemes without life-expectancy adjustments.
72. A second benchmark is a pure DC scheme, where pension contributions are defined. As life expectancy increases, annuity providers reduce the value of the pension paid each period to reflect the longer duration of payment. Replacement rates and pension levels decline as life expectancy increases. Pension wealth, however, remains the same under different scenarios for mortality rates.
73. These two benchmarks illustrate how life-expectancy risk is allocated. If pension wealth is constant under different mortality scenarios, all life expectancy risk falls on the individual retirees in the form of a changed replacement rate. If replacement rates are constant under different mortality scenarios, the individual retirees bear none of the life expectancy risk. The pension providers — or rather, those who finance the pensions — bear all the risk. Consequently, pension wealth varies with life expectancy.
Box 3. Calculating annuity factors
A “pension” is a stream of benefits paid over time until some contingency occurs, usually the death of the beneficiary or of the spouse of the beneficiary. This flow of benefits can be converted into a “stock” of lifetime pension capital, which is often called pension wealth. The calculation is based on the “annuity factor”: multiplying the pension entitlement by the relevant annuity factor gives pension wealth.
The annuity calculation is based on the survival function, i.e., the probability of being alive at a particular time t conditional on being alive at the starting point, in this case, the age at which the pension is first drawn. The survival function, s, is the product (Π) of one minus the mortality rates from the time the pension is withdrawn to the relevant age. Formally, the survival function to time t is
∏
= − = t i i t s 0 ) 1 (λ
where λ is the hazard function or mortality rate, that is, the probability of dying in a particular year conditional on surviving to the beginning of the year. Time is indexed i from the time the pension is drawn (0) to the time at which the survival probability is measured, t.
Life expectancy, LE, is simply the sum of the survival functions from the age at which the pension is first drawn –
R – to a terminal age, T, which is age 100 in the mortality data used in this paper
∑
= = T R i i s LEThe present value of an annuity depends on the probability of being alive to claim the pension in each period, as measured by the survival function. The calculation also needs to discount future incomes, because there is an opportunity cost to delaying consumption. The discount rate is denoted z in the following formulae.
Finally, account must also be taken of the adjustment of pensions in payment to reflect changes in costs or standards of living: “indexation” or “uprating” policy. The value of the adjustment to pensions in real terms is shown below as u. Since the riskless interest rate, z, is a real rate, u will be zero if benefits are indexed to prices. For uprating in line with earnings or combinations of earnings and prices, the value of u will depend on the assumption for earnings growth. For example, u would be 2% if pensions were earnings indexed and real earnings were assumed to grow at 2% per year. If pensions were not indexed at all, then u would be minus the assumed inflation rate.
In each future period, the present value of the pension flow (PVPF) is
i i
i z u
s
PVPF = (1+ )− (1+ )
where s is the survival function, z is the discount rate and u is the amount by which real pensions are increased each year. The value of the pension payment received in a future period is the initial payment, discounted, adjusted through uprating procedures and multiplied by the probability that the pension is still around to receive the benefit. Summing these present values of flows gives the present value of the stock of the pension. This is the annuity factor
∑
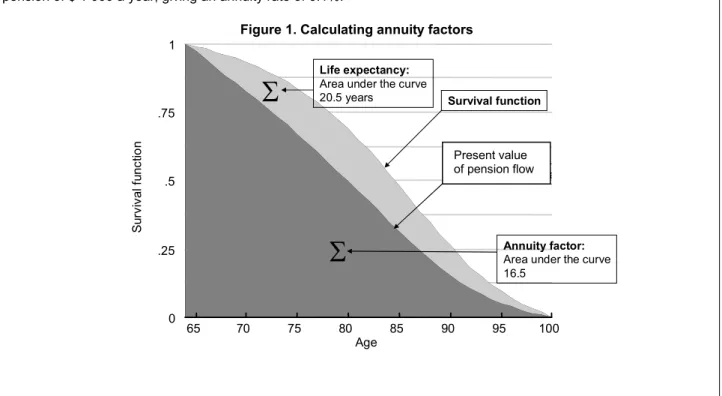
= − + + = T R i i i i z u s A (1 ) (1 )The steps in these calculations are illustrated graphically in Figure 1. The curve above the light grey area is the survival function for a man retiring at age 64 with the OECD average mortality rates for 2040. Life expectancy is the area under the curve, that is, the light grey plus dark grey areas, which comes to 20.5 years. The discounted survival function is below the survival function. The area under this curve – the dark grey area – is the annuity factor, which is 16.5 in this case.
The annuity rate is the inverse of the annuity factor. In the example, the annuity factor is 16.5, meaning that a pension of $ 1 000 a year has a present value of $ 16 500. Equally, a lump sum of $ 16 500 would be needed to buy a pension of $ 1 000 a year, giving an annuity rate of 6.1%.
Figure 1. Calculating annuity factors
0 .25 .5 .75 1 S ur viv al fu nc tio n 65 70 75 80 85 90 95 100 Age Survival function
Discounted survival function
Σ
Annuity factor:Area under the curve 16.5
Σ
Life expectancy:Area under the curve 20.5 yearsIII.2.2 Uncertainty in pension wealth
74. In Canada, Japan, the United Kingdom and the United States, there is no life-expectancy adjustment and so the pension systems conform to the first – the pure DB – benchmark outlined above.
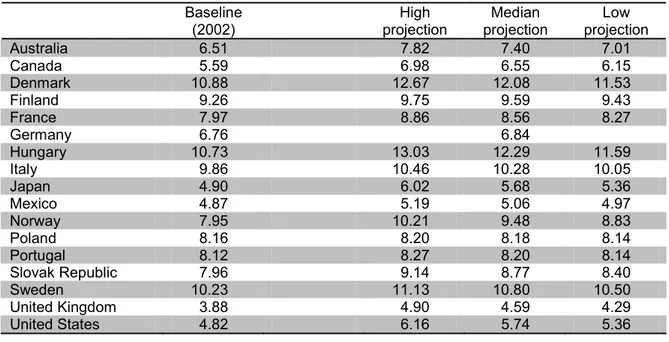
75. Replacement rates are constant across the different scenarios for mortality rates. Pension wealth, therefore, is higher under the favourable mortality scenario. Comparing the high and low life-expectancy results, pension wealth for men is 14-15% higher in the United Kingdom and United States, and 12-13% higher in Canada and Japan. (The differences between countries reflect cross-national variation in pension ages and mortality rates.)
76. Because women tend to live longer than men do, the differentials in pension wealth between low and high life-expectancy scenarios are smaller than for men. This means that mortality improvements have a proportionately smaller effect on women because of their longer expected retirement duration in the baseline case.
77. Pension wealth in the countries without life-expectancy adjustments is forecast to increase over time. Under the central projection, pension wealth is projected to be 16-19% higher for men than with 2002 baseline mortality rates in these four countries. Mainly due to the effect of longer female life expectancy, the growth in pension wealth for women is estimated to be slightly smaller than for men under the median mortality projection.
Present value of pension flow
Table 6 Average pension wealth as a multiple of mean earnings with 2002 mortality rates and under three scenarios for future life expectancy
Men Baseline
(2002) High projection projection Median projection Low
Australia 6.51 7.82 7.40 7.01 Canada 5.59 6.98 6.55 6.15 Denmark 10.88 12.67 12.08 11.53 Finland 9.26 9.75 9.59 9.43 France 7.97 8.86 8.56 8.27 Germany 6.76 6.84 Hungary 10.73 13.03 12.29 11.59 Italy 9.86 10.46 10.28 10.05 Japan 4.90 6.02 5.68 5.36 Mexico 4.87 5.19 5.06 4.97 Norway 7.95 10.21 9.48 8.83 Poland 8.16 8.20 8.18 8.14 Portugal 8.12 8.27 8.20 8.14 Slovak Republic 7.96 9.14 8.77 8.40 Sweden 10.23 11.13 10.80 10.50 United Kingdom 3.88 4.90 4.59 4.29 United States 4.82 6.16 5.74 5.36 Women Baseline
(2002) High projection projection Median projection Low
Australia 7.79 8.95 8.60 8.30 Canada 6.72 7.97 7.60 7.27 Denmark 12.67 14.40 13.92 13.51 Finland 11.73 11.51 11.55 11.61 France 9.72 10.19 9.98 9.75 Germany 8.36 8.11 Hungary 13.46 15.88 15.32 14.81 Italy 9.82 11.00 10.97 10.98 Japan 5.89 6.65 6.37 6.11 Mexico 5.04 5.58 5.43 5.29 Norway 9.39 11.76 11.11 10.53 Poland 8.87 8.45 8.58 8.72 Portugal 10.01 9.63 9.72 9.83 Slovak Republic 10.02 10.93 10.69 10.49 Sweden 11.60 12.42 12.22 12.08 United Kingdom 4.51 5.53 5.26 5.00 United States 5.84 7.12 6.76 6.42
Note: The eligibility age for the public pension in Denmark is assumed to be 68.4 in the median case and 69.3 and 67.6 in the high and low life-expectancy cases respectively.
The sustainability adjustment in Germany depends on the demography of the pension system. It is not, therefore, possible to measure how this will change under different life-expectancy scenarios. See text for further discussion.