Making market information services
work better for the poor in Uganda
Abstract
To assist smallholder farmer commercialisation, a new generation of low-cost market information services (MIS) has been developed in Uganda. These MIS services take advantage of new information and communication technologies (ICT). They help farmers to monitor market conditions in local, national, and export markets. Although there is much interest in market information from farmers, traders, and service providers, there is scepticism from donors about the effectiveness and sustainability of market information services. This study evaluated how farmers access and use market information to improve their market decision-making and support group marketing. Survey results found that farmers were able to access and use market information successfully. The cost of the service was relatively low and was able to serve more than 4.5 million farming households on a weekly basis. Up to 58% of farmers who used market information services indicated they achieved financial gains, with average gains of 16% above prevailing market prices for individual farmers, and 24% for farmers in groups.
Key words: marketing groups; market information services; Uganda. Subjects: economy and rural development; tools and methods.
Résumé
Adapter les systèmes d'information de marché aux besoins des plus pauvres en Ouganda
Pour ame´liorer les performances commerciales des petits producteurs, une nouvelle ge´ne´ration de Syste`me d’Information de Marche´ (SIM)« low cost » est apparue, base´e sur les nouvelles Technologies de l’information et de la communication (TIC). Ces SIM visent a` aider les petits producteurs a` suivre l’e´volution des conditions des marches locaux, nationaux et a` l’export. Bien que ce type d’outils suscite l’inte´reˆt des producteurs, des interme´diaires et des fournisseurs de service, le scepticisme demeure chez les bailleurs, quant a` leur efficacite´ et leur soutenabilite´. Cette e´tude tente d’e´valuer dans quelle mesure l’acce`s a` l’information de marche´ ame´liore les de´cisions des producteurs et encourage la commercialisation en groupe. Le SIM qui fait l’objet de notre analyse permet de diffuser une information hebdomadaire a` 4,5 millions de me´nages agricoles pour un couˆt relativement faible. Les re´sultats de notre analyse montrent que 58 % des producteurs utilisateurs du SIM ont enregistre´ des gains financiers, c’est-a`-dire un prix de vente supe´rieur de 16 % a` celui du marche´ pour les producteurs individuels et jusqu’a` 24 % dans le cas des ventes en groupe.
Mots cle´s : groupes de commercialisation ; Ouganda ; services d’information de marche´. The`mes : e´conomie et de´veloppement rural ; me´thodes et outils.
Shaun Ferris1 Patrick Engoru2 Elly Kaganzi3 1Catholic Relief Services
21161 Baltimore USA
2
International Centre for Tropical Agriculture Kampala Uganda <[email protected]> 3CHF International Rwanda Kigali Rwanda <[email protected]> doi:10.1684/agr.2014.0708
Reprints: S. Ferris To cite this article: Ferris S, Engoru P, Kaganzi E, 2014. Making market information services work better for the poor in Uganda. Cah Agric 23: 336-43. doi :10.1684/agr.2014.0708
M
arket information services aim to increase the effi-ciency of agricultural mar-kets and reduce market failure caused by information asymmetry. In this article, we define basic market infor-mation as commodity price data. In its simplest form, the regular dissemina-tion of commodity spot prices assists farmers to monitor market conditions, make better decisions on what and where to sell produce, and negotiate for improved prices with traders. In the 1970s, most developing coun-tries established public market infor-mation services which were operated by a government department. Unfor-tunately, poor performance of these public Market Information Systems (MIS) led to most of them being terminated (Shepherd, 1997). How-ever, a renewed interest in public/ private MIS systems has emerged in the past decade, as new technologies have made such services faster, better, and cheaper. Despite the low cost of such operations, donors and govern-ment agencies show little interest in supporting new MIS initiatives. This is partly a result of the desire for private service providers and a lack of evidence of the link between market information, better marketing deci-sions, and increased farmer incomes. This quantitative/qualitative survey aimed to evaluate how farmers have used market information in Uganda, with a review covering: i) how farmers accessed market information; ii) the most effective delivery channels; iii) the costs and accuracy of the service; iv) benefits to farmers; and v) whether gains were amplified through combin-ing access to market information and collective marketing.Method used to
evaluate the national
market information
service
This study was undertaken in 10 districts of Uganda (figure 1) to assess the use and efficacy of the Uganda market information service, during the period between May 1999 and July 2006 (Ferris et al., 2006). The
market information service in Uganda has been operational for seven years, with strong user and private sector support, and this survey was designed to determine whether the MIS should continue to operate as a public service, become a purely private agency, or develop a public/private partnership business model.
The survey team conducted approxi-mately 460 questionnaires. These ques-tionnaires were undertaken with 100 individual farmers, 30 large farmers, 100 farmer groups, 50 rural traders, 50 travelling traders, 50 wholesale urban traders, 10 agro-processors, 10 radio managers, 30 banks, 20 nongovern-mental organisations (NGOs), 10 local government representatives, and a focus group with researchers. The distribution of surveys was divided equally across the 10 districts. The selection of districts was made to cover the full range of market access, poverty,
and agro-ecozones within Uganda. The sampling was made randomly, with 2-3 farmers and farmer groups identi-fied at 10-20-km intervals along the major roads within each of the districts. Care was taken to select some farmers and farmer groups who were near to the road, as well as some who were more distant from the road,i.e., at least 3-4 miles from the main highways.
Results and discussion
The majority of farmers interviewed were smallholders with plot sizes ranging from 2.3 acres in the central and western parts of the country to 6.8 acres in less populated, northern areas. Annual incomes ranged from US$97 in the northern districts, which had been affected by chronic civil insecurity, to US$ 756 in the western districts of the country (figure 2).Kitgum Kotido Moroto Lira Soroti Kumi Kapchorwa Mbale Pallisa Kamuli Tororo Iganga Jinja Mukono Kampala Mpigi Mubende Luwero Apac Masindi Masindi Nebbi Gulu Moyo Arua Hoima
Butibugy Kobaale Kiboga
Kabarole Kasese Masaka Mbarara Rakai Kalangala Bushenyi Rukungiri KisokeKabale
Figure 1. The 10 surveyed districts in Uganda (highlighted in darker shaded areas). Figure 1. Les 10 districts étudiés en Ouganda (en couleur foncée).
The diagnostic data indicated that four of the top income-earning crops were non-traditional export products
(figure 3). This shift away from
the traditional cash crops, such as coffee, tea, sugar, and cotton, indi-cates the increasing commercialisation of food crops, especially maize, beans, and groundnuts that have become important in both domestic and regio-nal markets. The success of these crops was much to do with long-term support from development projects in non-traditional crop production, through interventions such as USAID1’s
IDEA2 project, combined with
increased levels of ‘‘local procurement’’ for food aid by the World Food Programme (WFP) (Chemonics
Interna-tional, 2004).
Marketing structures
and strategies
As part of the drive to commercialise smallholder farmers in Uganda, con-siderable efforts have been placed on formalising market linkages and improving the marketing competence of farmers and farmer organisations
(McGuigan et al., 2005). One of
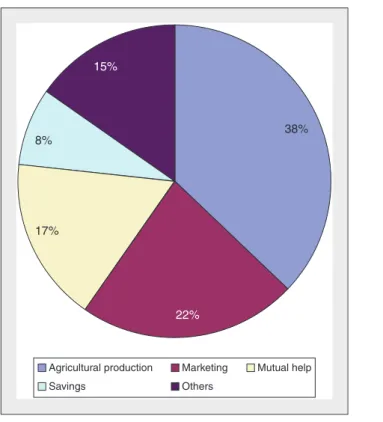
the most widely adopted strategies for strengthening the commercial capacity of farmers has been to organise farmers into collective mar-keting groups. In 2006, 65% of farmers in Uganda were members of at least one group and two thirds of these groups stated their main aim was to improve their agricultural production and marketing practices (figure 4).
Developing new market
information models
To support the commercial aspirations of farmer groups, the International Centre for Tropical Agriculture (CIAT) and partners, including IITA3, CTA4, USAID, and FEWSNET5, developed a range of low-cost market information services at the (i) local– district level, (ii) national, and (iii) regional levels. The aim of these services was to provide farmers, rural traders, and processors with an independent, reli-able, and up-to-date guide of prevailing market prices and market conditions. This was done to support farmers in their sales negotiations and to strengthen their ability to make more informed market decisions. This study
focussed on the effectiveness of the National Marketing Information Service which was re-launched in 1999, follow-ing the collapse of the government service. The new marketing national MIS service disseminated prices on 25 products and 20 markets with informa-tion being disseminated to farmers and rural traders on a weekly basis through rural FM radio, mobile phones, email, and the internet.
Delivering market
information to farmers
in Uganda
From the 1960s to the 1990s, Uganda had one government radio station for broadcasting news, which was free for government services. However, when the national station became fee-based, broadcasting of MIS ceased. The liber-alisation of the airwaves in 1993 then crowded out the state radio, as more than 120 local FM stations were established across the country
(Tanburn and Kamuhanda, 2005).
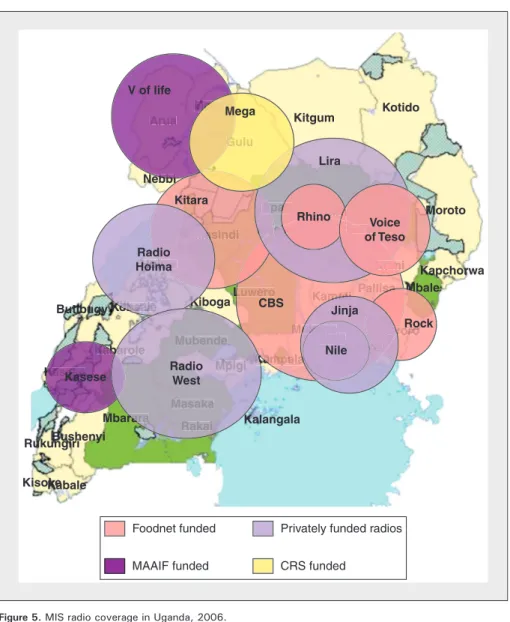
These rural radio stations, often with a footprint of 10-50 kms, were able to broadcast programmes in the local language and were thus extremely popular with local communities. The market information service established in 1999 capitalised on this new rural FM network and the survey in 2006 revealed that 13 radio stations regularly broadcast market information. Whilst all of the new MIS broadcasts were publicly funded in 1999, by 2006, half of the stations (shown in purple in
figure 5), were broadcasting the
pro-gramme using their own funds. Stations broadcasted the MIS data since this was popular with their customer base. The rise in setting up rural radio has been very successful and 94% of farmers owned a radio in 2006. The rise in radio ownership was due to the rapid expansion of local radio stations and access to low-cost radio sets. This indicates the power of rural radio as a vehicle for communication to the rural community. Farmers confirmed that, with regards to ‘‘educational informa-tion’’, they were most interested in farming and market news. Not surprisingly, the survey showed the preferred source of accessing market information; in 2006, for 68% of farmers, this was through listening to the regular radio market information 1USAID: United States Agency for International
Development.
2IDEA: Project name Investment in Developing
Export Agriculture.
3IITA: International Institute of Tropical Agriculture. 4
CTA: Technical Centre for Agricultural and Rural Co-operation ACP-EU.
5
FEWSNET: Famine Early Warning System. MDG - Target 1,400 1,200 1,000 800 600 400 Income U Shillings x1,000 200 0 Central East Regions in country n = 202
North South West
Season 1 Season 2 Seasons 1 and 2
Figure 2. Average farm income based on season and region. Figure 2. Revenu moyen des exploitations selon la saison et la région. US$1 = 1,850 Uganda shillings (UGX).
broadcasts using their own radio sets
(figure 6).
In 1995, the government liberalised the phone network, which led to the establishment of three nationwide mobile networks. This policy shift revolutionised ideas on how to com-municate with the rural community
and by 2006, 24% of farmers owned a mobile phone. An even more impress-ive 86% of farmers claimed access to a phone. In contrast, the penetration of computers to farmers was virtually zero; no farmers owned a computer and no farmers were using cyber cafe´s to access market information.
These findings support the strategy used by the MIS team in Uganda to focus the dissemination of information to farmers via radio and mobile phone. The coverage for both communication systems is extremely high for a develop-ing country and this shows the potential for using these technologies as tools for communicating and pro-viding services to farmers. Mobile phones are particularly interesting as this method offers two-way communi-cation which farmers can use to follow market opportunities and, in the future, transact market deals. For traders, we found that the most useful service for small rural and travelling traders was radio, whereas for the larger urban traders, they preferred to receive market information through email and the internet.
Costs of the market
information service
A key question for the donor group was whether market information was a cost-effective means of supporting the marketing decisions of farmer groups. A simple analysis of the national market information service based on start-up and recurrent costs found that costs, averaged across a three-year period, with an estimated coverage to 4,000,000 households per week, and based on radio coverage and listenership, were approximately 1.8 US cents per household per year. This is a relatively low-cost service compared with US$75 required to support extension workers who phy-sically visit households.
In an attempt to evaluate the useful-ness, accuracy, and reliability of the information disseminated through the national MIS service, farmers were asked to score the quality of the service and to indicate how the information was used in trading
(figure 7). Responses showed that
93% of farmers scored the MIS within the ‘‘good’’ to ‘‘fair’’ range, a strong endorsement of the service in terms of getting information to the client group and of the group in being able to understand and use this information. Results showed that market informa-tion was used by both individual farmers and farmer groups to make decisions on production and market-ing (table 1). Up to 90% of farmers in 35 30 25 20 15 10 5 0 Maize P e rcenta g e response ( n = 195)
Products farmers sold rank 1 for income
Beans Coffee Bananas G-nuts Sorghum Soybean Potato Millet
Figure 3. Leading income-generating crops sold by farmers.
Figure 3. Principales cultures génératrices de revenus vendues par les agriculteurs.
15%
17%
22%
38% 8%
Agricultural production Marketing Mutual help
Savings Others
Figure 4. Main aims of farmer groups.
groups regularly used the information to monitor market prices prior to selling produce and many farmers used the information to make deci-sions on what types of produce to grow, where to sell, and when to sell. Based on this analysis, there is clearly a strong role being played by MIS in strengthening greater business acumen for farmer groups.
Financial benefits of market
information
The more difficult question to answer is the causality of farmer income gains
as a result of receiving and using market information. Gaining clarity in attribution of this issue is problematic because of confounding factors involved in any one transaction, caused by price volatility, changes in market access, produce volumes, and produce quality at the time of sale. Given these limitations, individual farmers and farmers in groups were asked to recall how they used market information in previous negotiations and how this affected their sale prices. The first point to make is that 42% percent of the farmers indicated that even when they regularly listened to the market news services, they were unable to influence sale prices and
increase their income above prevail-ing prices by usprevail-ing market informa-tion. Farmers who were able to use MIS ‘‘effectively’’ (meaning that they were able to receive, collate, and use price information to negotiate with traders) can be reviewed in a series of descriptions. An important finding in this analysis was that 56% of farmers working in groups, compared to 30% of farmers trading as individuals, were able to negotiate for better prices using market information. The levels of income gains were also higher for farmers in groups compared to individual farmers (table 2).
With regards to specific crops, farmers adopted a number of sales strate-gies through MIS-based negotiations
(table 3).
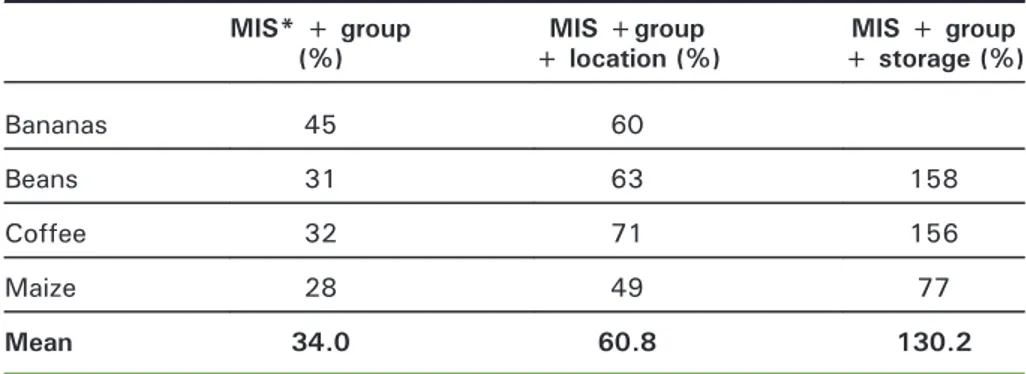
The information intable 4provides a range of cases where MIS was used by farmers selling beans. The strategies resulted in a range of losses and gains relative to prevailing prices; from -60 to +250%. The greatest gains were made through combinations of using MIS with group storage and groups selling produce into new markets, although these figures do not take into account additional marketing costs.
Maize farmers showed sales gains ranging from 0-150% above prevailing market prices. These levels of gain may appear unexpectedly high, due to the use of percentage increases. Therefore, an example has been reconstructed to provide information on the potential benefits to farm-gate incomes for a typical smallholder maize farmer in Uganda. If we assume that a farmer sells one metric ton of maize for 200,000 Uganda Shillings (UGX), a price gain of 20% would provide an additional income of UGX 40,000 ($21.62). Given that most farmers have 0.5-1 hectare of land, with a production capacity of 2-3 mt/ha, a successfully negotiated sale, that captures current prices, may add an additional $40-$80 to an annual income. This has significant social benefits to the farmers’ family, parti-cularly those living in the poorer and northern parts of the country. Farmers selling in groups enjoyed such gains more frequently than those selling as individual farmers.
The analysis suggests that the likeli-hood of improving market
perfor-mance increases when farmers
combine MIS with collective marketing.
Kitgum Kotido Moroto Lira Soroti Kumi Kapchorwa Mbale Pallisa Kamuli Tororo Iganga Jinja Mukono Kampala Mpigi Mubende Luwero Apac Masindi Masindi Nebbi Gulu Moyo Arua Hoima
Butibugy Kobaale Kiboga
Kabarole Kasese Masaka Mbarara Rakai Kalangala Bushenyi Rukungiri KisokeKabale Pal Pal Pa Pal Pal Pa Pa P Palisi a Kam
Kamuliuliuliuuliuluulululuull M M M Mu Mu Mu Mu M M M Ka Kam Kam Kamamamamamamamaamammpmmmmmpapppppapapapppalpappalpalpalpalppalpalppalaaaaaa
Luwero Kaaaaaaa L K K K K K K K Kab Ka K K K Kas Ka Ka Ka Kas Ka Ka Ka Ka Ka K Ka Ka Ka Ka K K Ka K eseeseeseeseeeeseeseeseeseeseeessseeee
K Kab K K K K K K K M M M M M M M M M M M M
rroroorooroorrororororororroooo sa orr M M M M Mb M M sa muliuliuli
ga g g uk uk uk uk uk uko a To ga o ga muliul u u a r or M as a indi i ebbi Moy Mo M M M M M M M M M M M M M M M M M M Aru A a Nebbi Apa si sin si Ap Maaa Ap s s s M Lir L L L a ac ndi a i in i M M M mi Kum K m a orotiiii Soro Ku oro Ku a a a MMMMMM a a Gulu G Moyo G Moy H Hoi Hoi Hoi Hoi Hoi Hoi Hoioi Hoo Ho Ho Hoi Ho Hoi H iim Kob K Kob Kob Kob Kob Kob Kob Ko Kob K Ko
K bbbaalbaalaaaaalaalaaalaalaaaalaalaalaalalaleeeeeeeeee KKKKKKKKKK M Maa ma im K Kob K K K K K K Ki a K K K K K K K K K K K K K K Mpi M M Mppipippigigigigi Mubendeeeeeeeeee barolel Mas M M aka raraaaa Rakaiiiiii b K K K K K K K ba ra K K b b Igan Jin Jinjaja I k konoo J Ji j J Ji ngg k k ko a Lira Rhino Nile Jinja Rock Radio West Radio Hoima Kasese CBS Kitara Mega V of life Voice of Teso
Foodnet funded Privately funded radios
MAAIF funded CRS funded
Figure 5. MIS radio coverage in Uganda, 2006. Figure 5. Couverture radio du SIM en Ouganda, 2006.
FOODNET: Post-harvest and market research network for East and Central Africa; MAAIF: Ministry of Agriculture, Animal Industry and Fisheries; CRS: Catholic Relief Services.
These are encouraging signs for the extension agents in Uganda, who are placing considerable effort on estab-lishing farmer groups, and strengthen-ing their capacity to produce for collective sales.
Farmers also observed that since they started receiving market information, they now pay more attention to more sophisticated buying conditions such as grain moisture content and kernel quality. Moisture content is one of the most important criteria used by formal buyers. The more commercial farmers
are seeking to harvest at the correct time, dry their crops, and clean the grain to access premium prices. These are encouraging signs for develop-ment agents in Uganda, who are placing considerable effort on farmer groups and crop quality. Market information is a low-cost means of supporting these types of processes, and if the more commercial farmers have confidence in this type of information, it will play a useful role in the transition from sales of ungraded, low quality produce,
towards a more standardised product that will receive premium prices and be attractive for buyers not only in Uganda but in the region.
Conclusions
and implications
In contrast to most countries in Africa, Uganda has invested considerable efforts, since 1999, in developing improved market information ser-vices, a basic service that allows farmers to monitor market conditions and make more informed decisions on what and where to sell. Findings revealed that most farmers owned radios and regularly listened to the weekly market information news. The high level of penetration of informa-tion into the community showed the importance of radio, especially in Uganda which has eight major language groups. Providing MIS through local FM radio promotes local business services and supports different language groups (Van Bussel, 2005). At the time of this study, less than 25% of farmers owned a mobile phone and few farmers were using SMS to monitor market prices. In contrast, rural and travelling traders were increasingly accessing MIS through mobile phone SMS services in Uganda. These findings suggest that although FM radio was the most appropriate media channel in 2006, mobile phones are likely to become an important means of MIS delivery in the near future. Service providers prefer the phone-based systems as they are cheaper to operate and provide a simpler business model in terms of revenue streams. The mobile phone also offers an opportunity for two-way communication and the combination of communication and linked services supports trade.
Probably the most important finding of the survey was that farmers were using the MIS data to monitor market changes and make decisions on which crops to grow, which market to sell in, when to sell, and at what price. The survey revealed a number of beha-vioural changes based on the provi-sion of simple, but trusted, market information. This qualitative analysis was recently supported by a rigorous Very good 5
Good 4
Fair 3
Poor 2
Collection Accuracy Rel to farmers
Rel to traders Timeliness Analysis Dissemination Very poor 1
Figure 7. Farmer rating of the current agricultural market information in Uganda.
Figure 7. Appréciation des agriculteurs sur l'actuelle information sur les marchés agricoles en Ouganda. 75 80 60 50 40 30 20 10
Radio Traders Family
Sources
% response
Friends Others 0
Figure 6. The main sources of market information of farmers.
quantitative analysis of the effects of the Ugandan MIS service, which found that access to regular market information improved farmer prices
(Svensson and Yanagizamwa, 2009).
In this article, the results showed that access to regular market information accessed through radio was associated with a 15% higher farm-gate price.
The report also indicated that farmer groups benefited from MIS more than individual farmers, which supports the general consensus that learning and applying new skills is achieved more rapidly through collective approaches
(Gallagher, 2003). The power of group
marketing was considerably increased when farmer groups sold into new
markets and highest gains were observed when farmers stored goods for speculative trading based on monitoring seasonal price movements. The benefits of storage, particularly in growth markets such as maize from 2000-2006 in Uganda, indicate the power of how MIS can help farmers make more sophisticated decisions. At present, most farmers sell early in the season to avoid losses. Future projects should place greater emphasis on post-harvest handling, such that more farmer groups can take advantage of storing their produce.
For farmers who used market informa-tion effectively, the changes in beha-viour observed within this survey were achieved with virtually no face-to-face training with farmers. The Ugandan MIS used several training-based radio programs, as the costs for distance-learning methods were considerably cheaper than direct training. This suggests that more emphasis should be placed on provid-ing extension messages through radio and mobile phone media. The use of radio-based training to support market information use and collective market-ing was tested by IITA and NRI6 in the Lira district of Uganda in 2001, through a series of radio pro-grammes entitled ‘‘Market to Market’’. The results from this study indicated that farmers were highly motivated to test new approaches, such as collective marketing and market price monitoring, when these approaches and services were supported with radio-based training.
Of greatest interest to long-term fund-ing by agencies and government, was the consistent evidence of increased marketing competence and improved market performance based on the combination of collective marketing that was informed by access to market prices and market news. Many indivi-dual farmers made consistent gains and therefore, not being part of a group does not preclude farmers from being more competitive market actors. However, the number of farmers who gained was higher in groups and the market gains, though modest, were being made by poor farmers. Hence, market information is able to penetrate areas beyond traditional extension
Table 1.
Relevance and usefulness of market information.
Tableau 1. Pertinence et utilité de l'information de marché. Farmers
(%)
Farmer groups (%)
Learning about produce sale price 76 89
Deciding what to plant 63 80
Deciding which market to sell produce 73 83
Deciding when to sell 59 46
Negotiating with traders for better prices 40 39
Source : NAADS MIS review 2005.
Table 2.
Price gains of farmers as individuals and in groups.
Tableau 2. Hausses de prix pour les agriculteurs individuels ou en groupes.Individual farmers (%)
Farmers in groups (%)
Percentage of farmers who gained 30 (n=200) 56
Average percent increase gain above prevailing prices for all farmers in each category
16 24
Table 3.
Price gain as a function of product type.
Tableau 3. Hausses de prix par type de produits.MIS* + group (%) MIS +group + location (%) MIS + group + storage (%) Bananas 45 60 Beans 31 63 158 Coffee 32 71 156 Maize 28 49 77 Mean 34.0 60.8 130.2
* Spot prices and trend information were used in negotiating for better prices with traders.
services and make direct positive impact on the lives of the poor. For policy makers, this indicates that investment in basic MIS services is beneficial.&
References
Chemonics International, 2004. APEP First Annual Report. Washington (DC): USAID.
Ferris RSB, Engoru P, Wood M, Kaganzi E, 2006. Evaluation of the market information services in Uganda and recommendations for the next five
years. Contract for PMA/ASPS. Kampala (Uganda): Danish Embassy.
Gallagher K, 2003. Fundamental Elements of a Farmer Field School. LEISA 19 : 5-6.
Mc Guigan C, Zake F, Luswata-Kibanda D, Nyabuntu P, Ssemwanga J, 2005. Developing and promoting trading principles for the Ugandan Agro-business sector. BSMD project document. Kampala (Uganda): Market Development Project. www.bsmd.or.ug
Shepherd AW, 1997. Market information services. Theory and practice. Rome: Food and Agriculture Organisation of the United Nations.
Svensson J, Yanagizawa D, 2009. Getting prices right: the impact of the market information service in Uganda. Journal of the European Economic Association 7 : 435-45.
Tanburn J, Kamuhanda R, 2005. Making service markets work for the poor: The experience of Uganda. DFID/ILO supported consultancy Report for Business Services. Kampala (Uganda): Market Development Project.www.bsmd.or.ug
Van Bussel P, 2005. Business services market development experiences and lessons. BSMD Synthesis Paper. Kampala (Uganda): Market Develop-ment Project.www.bsmd.or.ug
Table 4.
Illustrative description of marketing strategies for beans in Uganda.
Tableau 4. Exemples de stratégies de marketing pour les haricots en Ouganda.Crop type Description of transaction % change in price*
Beans The group was offered a low price of 300 shs/kg, but the group secured a buyer at 500 UGX/kg
67
Beans Members in our group sold our beans at 400 UGX/kg, but other farmers in the village were selling at 300 UGX/kg
33
Beans Our group leader enabled us to sell our beans in a group and we received 500 shs/kg, people who were not in a group received 400 UGX/kg
25
Beans People in the village sold beans at 350-400 UGX/kg, but the group found a buyer at 500 UGX/kg
25
Beans Bean prices were 7,000 UGX per debe, but market information was 8,000 UGX, so I sold my stock quantity at high price
12.5
Beans A local producer bought my beans at 500 UGX/kg at a time when the majority of farmers were selling at 400 UGX/kg. This was because I told him that I had knowledge of the price in Masaka town.
25
Beans Buyers were offering 400 UGX/kg for beans in our village but when a price of 500 UGX/kg was announced on the radio, the group negotiated at that price
25
* All prices rounded to nearest decimals.