HAL Id: hal-01543661
https://hal-mines-paristech.archives-ouvertes.fr/hal-01543661
Submitted on 25 May 2018
HAL is a multi-disciplinary open access
archive for the deposit and dissemination of
sci-entific research documents, whether they are
pub-lished or not. The documents may come from
teaching and research institutions in France or
abroad, or from public or private research centers.
L’archive ouverte pluridisciplinaire HAL, est
destinée au dépôt et à la diffusion de documents
scientifiques de niveau recherche, publiés ou non,
émanant des établissements d’enseignement et de
recherche français ou étrangers, des laboratoires
publics ou privés.
Columnar and Equiaxed Solidification of Al-7 wt.% Si
Alloys in Reduced Gravity in the Framework of the
CETSOL Project
Gerhard Zimmermann, Laszlo Sturz, Henri Nguyen-Thi, Nathalie
Mangelinck-Noël, Y. Z. Li, Charles-André Gandin, Romain Fleurisson, Gildas
Guillemot, Shaun Mcfadden, Robin Patrick Mooney, et al.
To cite this version:
Gerhard Zimmermann, Laszlo Sturz, Henri Nguyen-Thi, Nathalie Mangelinck-Noël, Y. Z. Li, et al..
Columnar and Equiaxed Solidification of Al-7 wt.% Si Alloys in Reduced Gravity in the Framework
of the CETSOL Project. JOM Journal of the Minerals, Metals and Materials Society, Springer Verlag
(Germany), 2017, 69 (8), pp.1269-1279. �10.1007/s11837-017-2397-4�. �hal-01543661�
Columnar and equiaxed solidification of Al-7wt%Si alloy in reduced gravity in the frame
of the CETSOL project
G. Zimmermann1*, L. Sturz1, H. Nguyen-Thi2, N. Mangelinck-Noel2, Y.Z. Li², C.-A. Gandin3, R. Fleurisson3,
G. Guillemot3, S. McFadden4,5, R.P. Mooney4, P. Voorhees6, A. Roosz7, A. Ronaföldi7, C.
Beckermann8, A. Karma9, C.-H. Chen9, N. Warnken10, A. Saad11, G.-U. Grün12, M. Grohn13, I. Poitrault14, T.
Pehl15, I. Nagy16, D. Todt17, O. Minster18, W. Sillekens18 1) ACCESS e.V., Intzestrasse 5, D-52072 Aachen, Germany
2) Universite Aix Marseille, CNRS, IM2NP, Campus St-Jerome 142, F-13397 Marseille, France 3) MINES Paris Tech CEMEF, 1 Rue Claude Daunesse, F-06904 Sophia Antipolis, France 4) Trinity College Dublin, Dept. of Mechanical and Manufacturing Engineering, Dublin 2, Ireland 5) Ulster University, Magee Campus, Londonderry, BT48 7JLNorthern Ireland, United Kingdom 6) Northwestern University Evanston, 2220 Campus Drive, US-Evanston, IL 60208, USA
7) University of Miskolc, Dept. of Physical Metallurgy, H-3515 Miskolc- Egyetemvaros, Hungary 8) University of Iowa, 2402 Seamans Center, IA 52242 Iowa City, USA
9) Northeastern University, Physics Department, 360 Huntington Ave, MA 02115Boston, USA
10) University of Birmingham, School of Metallurgy and Materials, Birmingham B15 2TT, United Kingdom 11) TRANSVALOR, 694, av. du Dr. Maurice Donat, F-06255 Mougins Cedex, France
12) HYDRO Aluminium Rolled Products GmbH, Georg-von-Boeselager-Strasse 21, D-53117 Bonn, Germany 13) Incaal GmbH, Beethovenweg 8, 52388 Nörvenich, Germany
14) ArcelorMittal Industeel, 56 Rue Clémenceau, F-71201 Le Creusot Cedex, France 15) Arconic-Köfém Ltd., 1-15 Verseci Street, 8000 Székesfehérvár, Hungary 16) INOTAL Aluminiumfeldolgozo, Fehervari ut 26, H-8104 Varpalota, Hungary 17) NEMAK Györ Kft., Ipari Park, Nyirfa sor, H-9027 Györ, Hungary
18) ESTEC, Keplerlaan 1, 2201 AZ Noordwijk, Niederlande *) corresponding author: g.zimmermann@access-technology.de
Abstract
During casting often a dendritic microstructure is formed, resulting in a columnar or equiaxed grain structure, or leading to a transition from columnar to equiaxed growth (CET). Especially the detailed knowledge of the critical parameters for CET is important, because the microstructure determines significantly the materials properties. To provide unique data for testing of fundamental theories of grain and microstructure formation, solidification experiments in microgravity environment were performed within the ESA MAP project CETSOL. Reduced gravity allows for pure diffusive solidification conditions, i.e., suppressing melt flow and sedimentation and floatation effects. On-board the International Space Station ISS Al-7wt%Si alloys with and without grain refiners were solidified in different temperature gradients and with different cooling conditions. Detailed analysis of the microstructure and the grain structure showed columnar growth in case of non-refined alloy. CET was detected
only for refined alloys, either as a sharp CET in case of a sudden increase of the solidification velocity, or as a progressive CET in case of a continuous decrease of the temperature gradient. The unique experimental data were used for numerical modelling of CET with three different approaches: (i) a front tracking model using an equiaxed growth model, (ii) a 3D CAFE model, (iii) a 3D dendrite needle network (DNN) method. Each model allows predicting the columnar dendrite tip undercooling and the growth rate with respect time. Furthermore, the positions of CET and the spatial extent of the CET, being sharp or progressive, are in reasonably good quantitative agreement with experimental measurements.
Introduction
Materials properties of cast components are determined strongly by their microstructures. During casting often a dendritic microstructure is formed. As a result of competition between the growth of several arrays of dendrites, columnar or equiaxed grain structures, or a transition from columnar to equiaxed growth is observed. The precise investigation on grain formation is hampered by buoyancy-driven flow and by movement of crystals growing in the melt. To allow for pure diffusive solidification conditions, i.e. suppressing melt flow and sedimentation effects, experiments in microgravity environment were performed, which provide unique data for testing fundamental theories of grain and microstructure formation.
Such activities are the task of the research project Columnar-to-Equiaxed Transition in SOLidification Processing (CETSOL) in the framework of the Microgravity Application Promotion (MAP) programme of the European Space Agency (ESA). At present, the CETSOL team consist of seven European scientific partners, three partners from the United States of America and seven partners from industry (see list of co-authors).
Microgravity experiments with Al-7wt%Si alloys
i) Experimental set-up and process parameters
Several experiments in microgravity were carried out successfully to investigate especially the columnar-to- equiaxed transition under diffusive conditions for heat and mass transport:
First, within a Batch1 six solidification experiments were performed in the Materials Science Laboratory (MSL) with the Low Gradient Furnace (LGF) module on-board the International Space Station (ISS). Rod-like samples with diameter 7.8 mm and length 245 mm made of Al-7wt%Si alloys, with (gr) and without grain refiner particles, were used and integrated in a special sample cartridge assembly (SCA) together with 12 thermocouples positioned along the sample (Figure 1). The main parts of the LGF are the ‘cold zone’ which consists of 3 heaters, the ‘hot zone’ which consists of 4 heaters, and an adiabatic zone in between. By controlling the temperatures of the heaters a temperature gradient along the sample axis develops. Melting or solidification of the metallic alloy is realized by a movement of the furnace insert along the axis of the fixed sample with a defined speed. Table 1 summarizes the main parameters of the Batch1 flight experiments. At the beginning of the solidification phase the furnace is in its end position and the set heater temperatures allow for an initial temperature gradient along the sample axis of about 0.9K/mm. The solidification stage I with v1=10μm/s for z1=20mm was identical for all experiments (see Table 1) and is expected to generate a columnar dendritic growth. A transition to equiaxed growth should be
triggered in the solidification stage II, either by increasing the furnace movement to v2=200μm/s (B1-FM1 to B1- FM3) or mainly decreasing the temperature gradient by applying a cooling rate of dT/dt=4K/min at the heaters of the hot zone (B1-FM4 to B1-FM6).
Yuze or Nathalie, I like to use here the sketch given in Fig. 1 of Ref. [3]. In case you agree, can you please provide me a version to be integrated into the manuscript. Thank you.
Fig. 1. Schematic setup of the sample cartridge assembly (SCA) inserted in the low gradient furnace (LGF) available in the Materials Science Laboratory (MSL) on board the International Space Station (ISS). The SCA contains the Al–7wt.%Si alloy inserted as a 7.8 mm diameter 245 mm long cylinder. The LGF is sketched at its initial position with respect to the SCA. The positions of the 12 thermocouples TC1 to TC12 regularly distributed from 72.5 to 182.5 mm from the cold end of the sample are also provided.
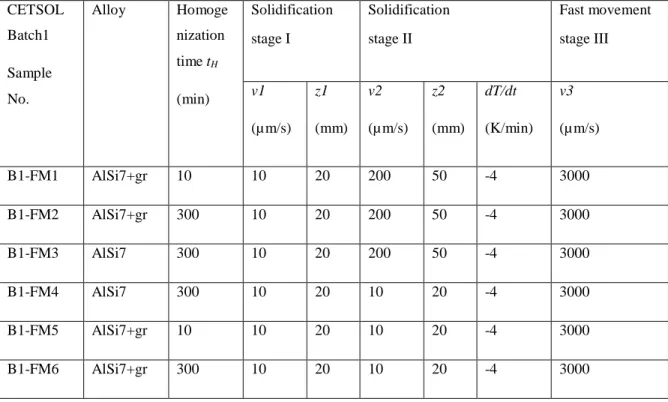
CETSOL Batch1 Sample No. Alloy Homoge nization time tH (min) Solidification stage I Solidification stage II Fast movement stage III v1 (µm/s) z1 (mm) v2 (µm/s) z2 (mm) dT/dt (K/min) v3 (µm/s) B1-FM1 AlSi7+gr 10 10 20 200 50 -4 3000 B1-FM2 AlSi7+gr 300 10 20 200 50 -4 3000 B1-FM3 AlSi7 300 10 20 200 50 -4 3000 B1-FM4 AlSi7 300 10 20 10 20 -4 3000 B1-FM5 AlSi7+gr 10 10 20 10 20 -4 3000 B1-FM6 AlSi7+gr 300 10 20 10 20 -4 3000
Table 1: Process parameters of the CETSOL1 MSL-LGF Batch1 flight experiments.
Second, within a Batch2a seven solidification experiments were performed in the Materials Science Laboratory (MSL) with the Solidification and Quenching Furnace (SQF) module on-board the ISS. As well as for Batch1 rod- like samples with the same dimensions made of Al-7wt%Si alloys, with (gr) and without grain refiner particles, were used and integrated in a sample cartridge assembly (SCA) together with 12 thermocouples positioned along
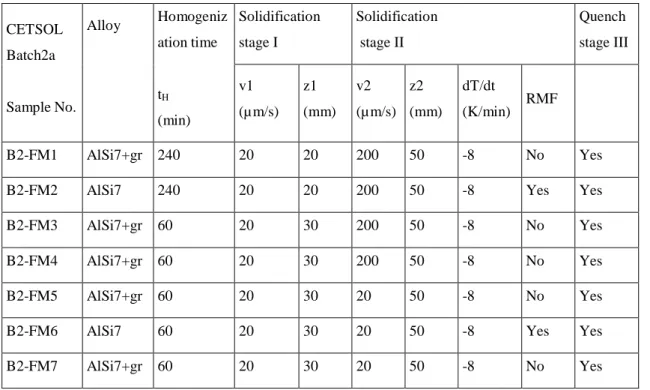
the sample. The SQF consists of a ‘hot’ zone (4 heaters), an actively cooled ‘cold’ zone realized by a Liquid Metal Ring (LMR) and an adiabatic zone in between. By controlling the temperatures of the heater a higher temperature gradient along the sample axis than in Batch1 was achieved. Melting or solidification of the metallic alloy was realized by a movement of the furnace insert along the axis of the fixed sample with a defined speed. Table 2 summarizes the main parameters of the Batch2a flight experiments. At beginning of the solidification phase the furnace is in its end position and the set heater temperatures allow for an initial temperature gradient along the sample axis of about 4K/mm and 3K/mm (B2-FM4 and B2-FM7). The solidification stage I with v1=20μm/s for z1=20mm or z1=30mm is expected to generate a columnar dendritic growth. A transition to equiaxed growth should be triggered in the solidification stage II, either by increasing the furnace movement to v2=200μm/s (B2- FM1 to B2-FM4) or decreasing the temperature gradient by applying a cooling rate of dT/dt=8K/min at the heaters of the hot zone (B2-FM5 to B2-FM7). For the non-refined samples FM2 and FM6 a moderate rotating magnetic field (RMF) with frequency f=57Hz and magnetic inductivity B=0.5mT was applied to promote eventually fragmentation. CETSOL Batch2a Sample No. Alloy Homogeniz ation time tH (min) Solidification stage I Solidification stage II Quench stage III v1 (µm/s) z1 (mm) v2 (µm/s) z2 (mm) dT/dt (K/min) RMF B2-FM1 AlSi7+gr 240 20 20 200 50 -8 No Yes
B2-FM2 AlSi7 240 20 20 200 50 -8 Yes Yes
B2-FM3 AlSi7+gr 60 20 30 200 50 -8 No Yes
B2-FM4 AlSi7+gr 60 20 30 200 50 -8 No Yes
B2-FM5 AlSi7+gr 60 20 30 20 50 -8 No Yes
B2-FM6 AlSi7 60 20 30 20 50 -8 Yes Yes
B2-FM7 AlSi7+gr 60 20 30 20 50 -8 No Yes
Table 2: Process parameters of the CETSOL MSL-LGF Batch2a flight experiments.
ii) Experimental Results
Based on the temperature measurements along the sample axis cooling curves for all Batch1 and Batch2a samples were determined. Also, the average liquidus isotherm velocities and the temperature gradients ahead of the liquidus isotherm were deduced as function of time. It was found that grain refinement and RMF have almost negligible influence on the heat flow.
From axial and longitudinal cross-sections of the samples the microstructure and grain structures were identified. Quantitative evaluation of the microstructure showed the development of eutectic percentage as well as the dendrite arm spacing along the sample axis. From electrolytically etched cross-sections observed in a polarized microscope the different grain structures were identified. Additionally from quantitative EBSD measurements the size (equivalent diameter), the crystallographic orientation and the elongation factor of each grain was determined. Some results for the Batch1 benchmark experiments are already published [1 - 4] and are summarized here briefly: • In non-refined alloy (samples B1-FM3 and B1-FM4; see Table 1) no CET was observed, but columnar
dendritic growth with some fragmentation. The fragments have a size comparable to the dendrite sidebranch spacing and cannot promote CET during solidification in microgravity environment.
• CET was obtained only for refined alloys (see Table 1). In case of the sudden increase of the solidification velocity (samples B1-FM1 and B1-FM2) a sharp CET within a few mm distance was observed, based on the evaluation of the grain size. In case of a decrease of the temperature gradient resulting also in a moderate increase of solidification velocity the formation of elongated and equiaxed grains is found (samples B1-FM5 and B1-FM6). At the end of this transition region of several tenth of mm fully equiaxed grains are detected. Therefore, a progressive CET mode exists.
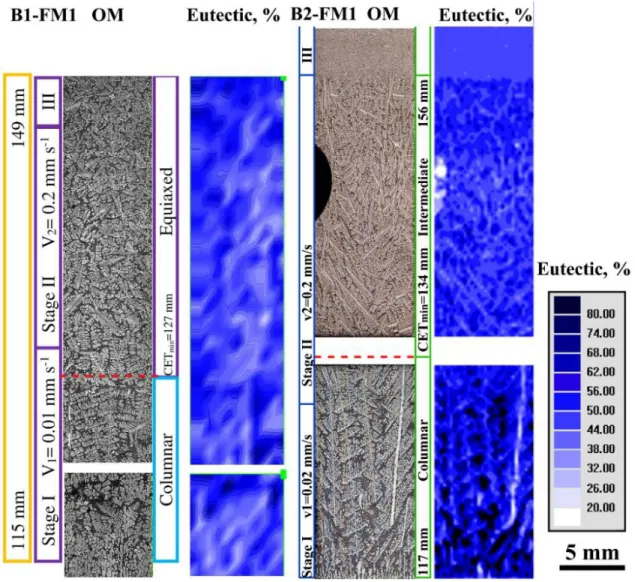
The evaluation of the Batch2a samples is still in progress. As a recent result, in the following section a comparative analysis of two flight samples – one from Batch1 (B1-FM1) and one from Batch2a (B2-FM1) – is given. Figure 2 shows the microstructure and the eutectic percentage map of the longitudinal sections situated in the sample at the junction between stage I and II for samples B1-FM1 and B2-FM2. The successive solidification stages (I, II and III) are marked out on the left side as the positions defined by the position of the liquidus isotherm calculated as in our previous work [3].
For both samples, a columnar structure is obtained during stage I. Some quite large eutectic regions (darker areas in Fig. 2) are found in stage I, which are formed due to the solute rejection during solidification and accumulation in the interdendritic regions. The microstructure significantly changes from stage I to stage II in both samples. First, equiaxed and finer, compared to stage I, dendrite grains are obtained in stage II. Moreover, no large eutectic zones are observed anymore. As a consequence, the eutectic distribution is much more uniform, the eutectic percentage is also lower in stage II. In comparison of the two samples, finer structures are obtained in B2-FM1, in every stage, than what can be observed in B1-FM1.
For both samples, the increase of furnace velocity results in a sharp increase of the liquidus isotherm velocity. At lower growth velocity in stage I, competition with neighboring dendrites forms large solute-enriched liquid pockets at interdendrite region that are later transformed into eutectic. In stage II, the velocity increase leads to a fine dendritic microstructure and stronger dendrite competition that creates a more homogeneous eutectic distribution. Moreover, when comparing the two samples, we can see that for the same growth velocity, higher temperature gradient leads to a shorter mushy zone during solidification, which accordingly decreases the growth and ripening time of the dendritic microstructure in this region. Therefore, for other comparable parameters, the increase of the temperature gradient leads to a finer microstructure.
Fig. 2: Longitudinal microstructures by optical microscopy OM (left) and eutectic percentage distribution maps (right) for flight samples B1-FM1 and B2-FM1. The blank region represents the material loss during sample preparation.
Considering the grain structure observed by optical microscopy, both samples are columnar during stage I and equiaxed in stage II, which confirms a columnar-to-equiaxed transition in both experiments, triggered by the increase of the solidification velocity. However, the equiaxed grains in B2-FM1 appear to be more elongated than in B1-FM1. The longest length of the initial columnar zone is defined as the CET inception [5], and noted CETmin
in Fig. 2. This position is 127 mm for B1-FM1 and 134 mm for B2-FM1.
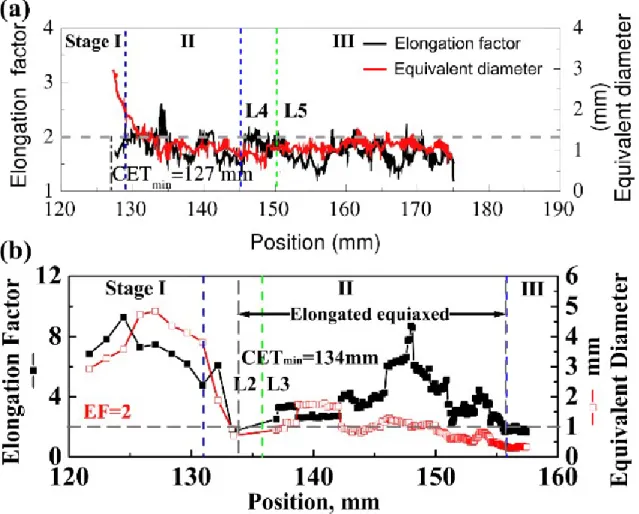
For quantitative evaluation of the CET, the grain structure is also investigated using EBSD measurements. Fig. 3 shows the grain equivalent diameter and elongation factor longitudinal profiles calculated from the EBSD maps. For both samples, the equivalent diameter decreases from stage I to stage II as expected with an increase of growth rate. In the case of B1-FM1, the elongation factor remains constant and lower than 2 except at one isolated position after CETmin, indicating an equiaxed zone covering the stage II and a sharp CET according to Hunt’s model [6].
factor mainly stays close above 2 after CETmin up to 156 mm. Therefore, the equiaxed grains are elongated in this
region defining a progressive CET. It should be noted that an important deviation of the elongation factor is observed for this sample at about 148 mm. This is due to the existence of the porosity observed on Fig. 2, which was excluded during the calculation of the elongation factor.
A higher velocity enhances the constitutional undercooling ahead of the solidification front, leading to the CET in both samples. However, the higher temperature gradient of 4K/mm is the major reason for progressive CET in B2- FM1. Indeed, grain nucleation takes place and stops the columnar growth in both samples. However, due to the higher temperature gradient in B2-FM1, nucleation takes place in a shorter undercooled region, preventing copious and simultaneous nucleation necessary to obtain sharp CET [7].
Fig. 3: Longitudinal profiles of the averaged elongation factor and equivalent diameter of the experimental grain contours from EBSD patterns for (a) B1-FM1 and (b) B2-FM1.
Numerical modelling of CET
The flight experiments provide unique data for columnar-to-equiaxed transition in Al-7wt%Si alloy for pure diffusive solidification conditions, i.e. without melt flow and sedimentation effects. That’s why they are used to improve several approaches for numerical modelling of CET, i.e.:
• Columnar Front Tracking model with an equiaxed growth model; • Cellular Automaton – Finite Element (CAFE) method;
• Dendritic Needle Network (DNN) method.
i) CET modelling using front tracking approach
An approach that combines Front Tracking (FT) of columnar growth [8] and an Equiaxed Volume Averaging method [9] was employed to model CET. This model allows to track explicitly the undercooled columnar front and to model equiaxed nucleation from grain refiners. Results of numerical modelling for some of the CETSOL Batch1 experiments are published [1, 4, 10]. For sample B1-FM2 with grain refiner the simulated prediction of the CET position is in very close agreement with that measured experimentally. Also, for B1-FM2 and B1-FM3 samples the progress of the columnar front was modelled. It was found that the thermal gradient and formation of undercooled zone ahead of the columnar front were similar for both experiments. Therefore, the effect of grain refiners was crucial for the CET in B1-FM2.
Meanwhile the 1D Bridgman furnace front tracking model [11, 12] has been significantly modified to simulate columnar and equiaxed growth in the Batch1 flight experiments. The model is suitable for low Biot number (<0.1) applications. Axial and radial heat flow in the crucible has been incorporated using a 2D axisymmetric model. Also, an equiaxed growth model based on the well-established JMAK model [13-15] has been developed and implemented. Post-numerical processing codes have been developed to help disseminate results effectively. The equiaxed growth model is currently being redeveloped to improve computational efficiency. The overriding objective of the thermal modelling carried out has been to provide enlightenment regarding experiment design, conditions pertinent to CET, and cross validation in respect of previous modelling efforts.
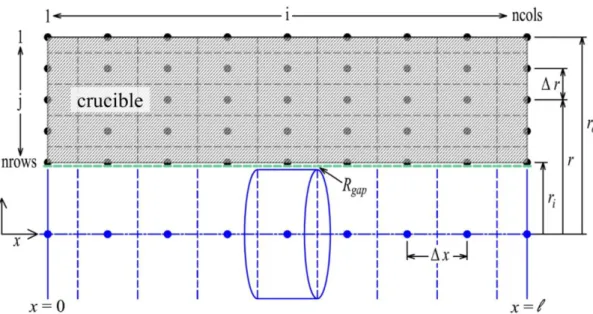
Fig. illustrates the hybrid of the 2D (annular shaped control volumes, in black, containing the crucible, ∆r=0.7125 mm) and the 1D (disc-shaped control volumes, in blue, containing the sample, ∆x=0.5 mm) axisymmetric model domains. The models are independent but share: (i) a common boundary, (ii) grid resolution in the axial direction, and (iii) their numerical time step, ∆t=0.001 s.
Fig. 4: BFFTM domain with 2-dimensional axisymmetric crucible.
The equiaxed growth model applies JMAK theory to independently simulate growth of spherical envelopes of equiaxed mush ahead of a columnar front. The thermal history from twelve thermocouples, located inside grooves on the crucible, is used to drive dynamic boundary conditions in the numerical model. Other key inputs to the model are nuclei density (No=1.6×10¹⁰ m–3), and mean (4 °C) and standard deviation (0.5 °C) of nucleation
undercooling (in a log-normal distribution). The current model is still computationally inefficient at large nuclei densities (>2×10¹⁰ nuclei/m3), however, a new algorithm is currently in development that solves this problem.
Figure 5 illustrates the mechanism for equiaxed growth ahead of a progressing columnar front within the BFFTM domain. Useful outputs from the model include columnar dendrite tip undercooling, growth rate, temperature gradient with respect time, and sharp or mixed CET. Good agreement (within 1 mm) is found between the simulated and experimentally measured CET position.
Fig. 5: Spherical equiaxed envelopes growing in undercooled liquid and positive temperature gradient ahead of a columnar front (×) in the BFFTM domain
ii) CET modelling using CAFE method
The Cellular Automaton – Finite Element (CAFE) method was proposed to model complex phenomena occurring during solidification processes through the integration of microscopic laws. Resolutions developed at microscopic and macroscopic scales are modelled [16-19]. The conservation equations for energy, solute mass and momentum are solved on a tetragonal FE mesh, which is defined on the domain of interest. A grid of cubic cells is superimposed on to the FE mesh and used by the CA method. Each cell is precisely located in one of the FE element and the macroscopic fields may be interpolated at the cell scale if required.
Results of 2D CAFE modelling of the grain structure evolution and the occurrence of the CET for some of the CETSOL Batch1 experiments are already published [2, 20, 21]. Qualitative agreement was obtained for the position of CET and the CET transition mode, which is sharp in B1-FM1 and progressive in B1-FM5 sample. Further comparisons of the distributions of grain elongation factor and equivalent diameter were conducted and revealed also a fair quantitative agreement.
Now, the CAFE model was extended to the simulation of the B1-FM1 experiment in 3D. Simulation is restricted to the material without considering the whole equipment and its effect on temperature evolution. The sample is virtually divided and simulation of the solidification process is limited to the single domain of interest corresponding to positions from thermocouple TC5 to TC12. Initially, the whole simulation domain is made of a homogeneous liquid of nominal concentration. A Dirichlet boundary condition is used to impose the temperature at the position of the thermocouples. At the macroscopic scale, the energy and solute mass conservations are solved assuming constant densities and fixed solids. Simulation is based on the FE method with about 42,000 isotropic and homogeneous elements and about 9,000 nodes using linear interpolation. At the microscopic scale, the Wang- Beckerman model of microsegregation is used with primary arm spacing λ1 = 1,000 µm [20] and secondary arm spacing λ2 = 78 µm [20]. Nucleation occurs at the bottom of the simulated part of the sample (TC5). Growth kinetics is approximated with the Ivantsov’ solution and the marginal stability criterion using σ = (4𝜋 2 )-1. The CA
simulation is developed with 3 million cells with characteristic size 80 µm. The time step is taken equal to 1 s. The parallelized computation took approximately 90 minutes on 40 CPUs. Results of the simulation can be seen on Figure 6 for various solidification times.
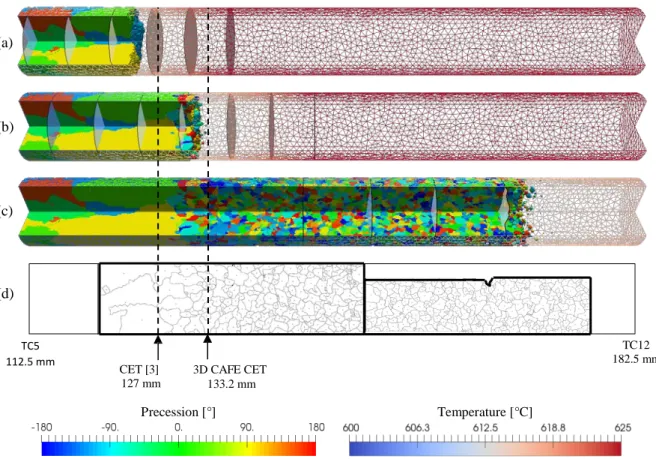
Due to the local temperature history and the nucleation parameters, only a columnar grain structure can first develop, the dendrite growth undercooling being too small to favor nucleation of equiaxed grains. After 2,000 s (see Table 1), velocity is increased and so is the columnar front undercooling. Liquid cells exist ahead of the columnar front containing a nucleation site sufficiently undercooled to give birth to equiaxed grains. As can be seen by comparison of the simulation and experimental grain structure, qualitative comparison is reached. Moreover, the CET position is accurately and precisely predicted. The CET is measured at 133.2 mm using the same criterion as in reference 3 with 3D data inducing a larger error (Figure 6). The relative error with the experiments is less than 5%. Previous exhaustive explanations [20, 21] of the CET appearance remain valid. The velocity jump increases the constitutional undercooling leading to heterogeneous nucleation of equiaxed grains blocking the columnar front.
To further improve the present computations, the methodology developed within the DNN model (see next chapter) for computation of the dendrite tip growth kinetics is presently under implementation in the CAFE model.
(a) (b) (c) (d) TC5 112.5 mm CET [3] 127 mm 3D CAFE CET 133.2 mm TC12 182.5 mm Precession [°] Temperature [°C]
Figure 6: CAFE simulation of the solidification grain structure of the B1-FM1 sample between thermocouples TC5 (112.5 mm) and TC12 (182.5 mm). Isothermal surfaces from 602 °C to 626 °C with a step of 4 °C are shown. A quarter of the cylinder was removed by post-processing in order to offer an exploded view at various times of (a) columnar growth at t = 1,800 s, (b) nucleation and growth of equiaxed grains triggered by a sudden increase of the withdrawal rate at t = 2,140 s and (c) the equiaxed structure forming at t = 2,400 s. The position of the CET favourably compare with the (d) experimental grain structure observed in a longitudinal metallographic cross section [3].
iii) CET modelling using DNN method
To model the columnar-to-equiaxed transition (CET) in microgravity experiments, we use a three-dimensional (3D) multi-scale Dendritic Needle Network (DNN) method that tracks the diffusion-controlled dynamics of branches of the hierarchically structured dendritic network to model the solidification of dendritic alloys on the grain scale. This approach models explicitly the growth kinetics of all branches of the hierarchical dendritic network (including primary, secondary, and tertiary branches) that interact diffusively via the solutal field. The DNN model describes the dendritic tip as a paraboloid [22, 23] and the dynamic of each dendrite is prescribed by two conditions that determine the evolution of its tip velocity V and radius ρ [24, 25].
We model the two CETSOL experiments B1-FM1 and B1-FM5 (see Table 1). To investigate the CET, the DNN model is discretized in space on a finite difference cubic grid and the code is implemented on graphics processing
units (GPUs) using the Compute Unified Device Architecture (CUDA). To keep the simulations computationally tractable, we study the CET in a 3D rectangular slab geometry of dimensions Lx x Ly x Lz with Ly = 7mm ≈ d, Lx
chosen large enough to include the CET, and the slab thickness Lz = 1mm chosen much smaller than Ly or Lz but
large enough to accurately model 3D dendrite growth kinetics.
The tip selection parameter σ = 0.058 is used in this study [23, 24]. We model the growth of randomly oriented grains ahead of the columnar front by incorporating nucleation on foreign inoculant particles randomly located in the melt. We choose a nucleation undercooling ∆Tn = 4K [2] and an effective density 1.25/mm3 [1]. We use the
measured temperatures at the 12 thermocouples along the sample as input data into the model. The initial condition consists of an array of columnar dendrites [23] with an undercooling ∆Tcini that was varied in the range of 2K to
8K.
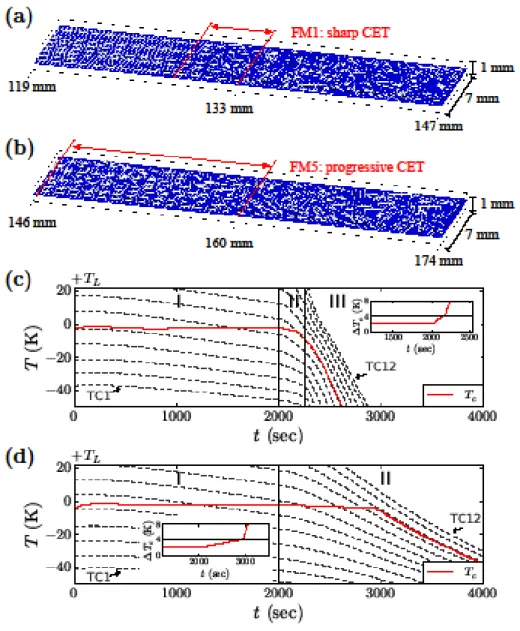
The results of the DNN simulations for samples B1-FM1 and B1-FM5 are shown in Fig. 7. Figs. 7a-b show the grain structures for the FM1 (a) and FM5 (b) samples. Figs. 7c-d show the corresponding temperature-time curves collected from the 12 thermocouples (thin black dashed lines) and the temperature of the most advanced columnar front Tc (solid red lines) in FM1 (c) and FM5 (d) samples. We measured the starting CET position (CETmin) and
the ending CET position (CETmax) in simulations, where CETmin is defined as the position along the sample where
the first nucleant particle is initiated, and CETmax is defined as the final position of the tip of the most advanced
surviving columnar dendrite. In the CETSOL experiments [1-3], a sharp CET is observed in FM1 (CETmin =
125mm and CETmax = 129mm) and a more progressive CET is observed in FM5 (CETmin = 130mm and CETmax =
156mm). In reasonably good quantitative agreement with those measurements, the simulated grain structures predict that the CET is relatively sharp in FM1 (Fig. 7a with CETmin = 129mm and CETmax = 133mm) and more
progressive in FM5 (Fig. 7b with CETmin = 146mm and CETmax = 160 mm). In the insets of Fig. 7c and Fig. 7d,
we show zoomed in views of the front undercooling ∆Tc versus time profiles (solid red lines) compared to the
nucleation undercooling ∆Tn = 4K (horizontal solid black lines) in FM1 and FM5 samples, respectively. Only
when ∆Tc > ∆Tn (t > 2150 s in FM1 and t > 2900 s in FM5), nucleation is able to take place ahead of the columnar
front, thereby allowing equiaxed grains to develop and block columnar growth.
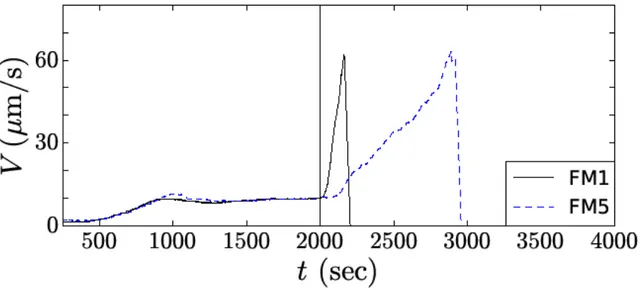
Figure 8 further shows the time evolution of the velocity of the most advanced columnar front in simulations. The growth velocity increases initially during a transient growth regime occurring early in stage I (t < 1000 s), which is associated with a coarsening of the primary spacing. After this transient growth regime, the columnar front reaches a steady-state growth regime with a constant velocity for the rest of stage I. Upon faster cooling during stage II, the front velocity increases again leading to a transient growth regime with a non-uniformity of the primary spacing before the onset of the CET as clearly seen in Fig. 7a. Two types of CET are observed in simulations as mentioned above (a sharp CET in FM1 and a progressive CET in FM5). We attribute this difference to the different cooling processes applied at stage II (t = 2000-2250 s in FM1 and t = 2000-4000 s in FM5). For all times after the start of stage II, the front undercooling ∆Tc is always larger in FM1 than FM5 because of the faster movement of
the furnace during this stage, which boosts the nucleation ahead of the columnar front and results in a sharper CET. Summarizing, DNN modeling predictions for the positions and spatial extent of the CET are in reasonably good quantitative agreement with experimental measurements in two Batch1 samples (B1-FM1 and B1-FM5) that exhibit sharp or progressive CET depending on the thermal conditions. As a next step in this project, DNN simulations will be extended to cylindrical bulk samples. This will allow us to compare simulated 3D grain
structures to measurements of grain size and orientation using serial sectioning [26]. Furthermore, the DNN method will be used to model the growth of equiaxed dendrites solidified in microgravity in the transparent model alloy Neopentylglycol-dCamphor during the sounding rocket mission MASER-13.
Fig. 7: DNN simulations of dendritic network and grain structures for Al-7wt%Si samples for B1-FM1 (a) and B1-FM5 (b) samples (see Table 1).A sharp CET is observed in FM1 (CETmin = 125mm and CETmax = 129mm)
and a more progressive CET is observed in FM5 (CETmin = 130mm and CETmax = 156mm) [2]. (c) and (d) show
the temperature curves recorded from 12 thermocouples (thin black dashed lines labelled TC1 to TC12 ) and the temperature of the most advanced columnar front Tc (solid red lines) in FM1 (c) and FM5 (d). The insets of (c) and (d) show zoomed in views of the time evolution of the columnar front undercooling ∆T c. The solid line
Figure 8: Time evolution of the velocity of the most advanced columnar front for Batch1 FM1 and FM5 in DNN simulations. The front velocity increases during the growth competition of columnar dendrites leading to an increase of primary spacing (t < 1000 s). After this transient regime, the columnar front grows at a constant velocity. The front velocity increases again upon faster cooling during stage II and drops abruptly when columnar growth is blocked by the nucleated equiaxed grains.
Conclusion
This paper summarizes results obtained so far from solidification experiments on-board the International Space Station ISS by the CETSOL team. In the Materials Science Laboratory Al-7wt%Si alloys with and without grain refiners were solidified in diffusive conditions. Detailed analysis of the microstructure and the grain structure showed columnar growth with some fragments in case of non-refined alloy. CET was detected only for refined alloys. In case of the sudden increase of the solidification velocity a sharp CET within a few mm distance was observed. A progressive CET mode exists in case of a continuous decrease of the temperature gradient. Then, a longer transition region with elongated equiaxed grains exists, followed by fully equiaxed growth.
The unique experimental data basis was used for numerical modelling of CET with three different methods: (i) A front tracking model using an equiaxed growth model which applies JMAK theory, predicts the columnar dendrite tip undercooling, the growth rate, the temperature gradient with respect time, and sharp or progressive CET. Good agreement is found between the simulated and experimentally measured CET position.
(ii) Using a CAFE model both segregation and grain structures, as well as CET, were numerically modelled in 3D. The CET transition mode, be it sharp or progressive, is retrieved. Distributions of grain elongation factor and equivalent diameter are fairly reproduced. Moreover, the CET positions are predicted accurately and precisely. (iii) To predict CET a 3D multi-scale Dendrite Needle Network (DNN) method was used. The model was applied to two Batch1 flight samples with sharp and progressive CET (B1-FM1 and B1-FM5), using a simplified slab-like
geometry. The DNN modeling predictions for the positions and spatial extent of the CET are in reasonably good quantitative agreement with experimental measurements in both cases.
Outlook
The experimental data basis for description of CET under diffusive conditions will be extended in the next years. Therefore, within the CETSOL project solidification experiments with three different hypo-eutectic AlCu alloys, with and without grain refiner, will be performed in reduced gravity on the ISS. Applying different cooling conditions may result in different types of CET. Selected parts of these samples and of the already processed Al- 7wt%Si samples will additionnally be used for a 3D-reconstruction of the grain structure by serial sectioning [26, 27]. Such 3D features of the structures will be investigated to improve the knowledge of the grain competition, microstructure formation and CET, and these results will be coupled with further numerical simulations, especially in 3D.
To investigate the dynamics of columnar and equiaxed growth as well as of the CET the transparent organic alloy Neopentylglycol-(d)Camphor system is used, which solidifies like a metal. As part of the CETSOL project the sounding rocket experiment MEDI (Multiple Equiaxed Dendrite Interaction) was performed on MASER-13 sounding rocket flight to study in-situ free dendrite growth and solutal interaction between close crystals under microgravity conditions without sedimentation of the equiaxed crystals and melt flow [28]. Now, the experiment serves as benchmark-experiment for modelling of equiaxed growth at different length scales. This alloy system will also be used for future experiments in the Materials Science Glovebox on-board the ISS. Therefore, on behalf of ESA, the TRANSPARENT facility is under development [29]. In experiments with different (d)Camphor compositions especially the time-dependent evolution of CET for different cooling conditions will be investigated using optical CCD cameras. Again, the results will be used to improve modelling of dendrite growth and interaction.
References
[1] G. Zimmermann, L. Sturz, B. Billia, N. Mangelinck-Noël, H. Nguyen Thi, Ch.-A. Gandin, D.J. Browne and W.U. Mirihanage, JOP Conference Series 327 (2011). doi:10.1088/1742-6596/327/1/012003
[2] G. Zimmermann, L. Sturz, B. Billia, N. Mangelinck-Noël, D.R. Liu, H. Nguyen Thi, N. Bergeon, Ch.-A. Gandin, D.J. Browne, Ch. Beckermann, D. Tourret and A. Karma, Materials Science Forum 790-791, 12 (2014) [3] D.R. Liu, N. Mangelinck-Noël, C.A. Gandin, G. Zimmermann, L. Sturz, H. Nguyen Thi and B. Billia, Acta Mater. 64, 253 (2014)
[4] W. U. Mirihanage, D. J. Browne, G. Zimmermann and L. Sturz, Acta Mater. 60, 6362 (2012) [5] C.A. Gandin, Acta Mater. 48, 2483 (2000)
[6] J.D. Hunt, Materials Science and Engineering 65, 75 (1984)
[7] Y.Z. Li, N. Mangelinck-Noël, H. Nguyen-Thi, G. Zimmermann, L. Sturz, T. Cool, E.B. Gulsoy and P.W. Voorhees, submitted to proceedings of SP17 (2017)
[8] D.J. Browne and J.D. Hunt, Numer. Heat Trans. B45, 395 (2004) [9] W.U. Mirihanage and D.J. Browne, Comput. Mater. Sci. 46, 777 (2009)
[10] W.U. Mirihanage, D.J. Browne, L. Sturz and G. Zimmermann, IOP Conf. Series: Materials Science and Engineering 27 (2011). doi:10.1088/1757-899X/27/1/012010
[11] R. P. Mooney, S. McFadden, M. Rebow and D. J. Browne, Trans. Indian Inst. Met. 65, 527 (2012) [12] R. P. Mooney, S. McFadden, Z. Gabalcová and J. Lapin, Appl. Therm. Eng. 67, 61 (2014)
[13] W. A. Johnson and R. F. Mehl, Trans. Aime 135, 396 (1939) [14] M. Avrami, J. Chem. Phys. 9, 177 (1941)
[15] A. N. Kolmogorov, Bull. Acad. Sci. URSS (Sci. Math. Nat.) 3, 355 (1937)
[16] T. Carozzani, H. Digonnet and Ch.-A. Gandin, Model. Simul. Mater. Sci. Eng. 20, 015010 (2012)
[17] T. Carozzani, Ch.-A. Gandin, H. Digonnet, M. Bellet, K. Zaidat and Y. Fautrelle, Metall. Mater. Trans. A44, 873 (2013)
[18] T. Carozzani, Ch.-A. Gandin and H. Digonnet, Model. Simul. Mater. Sci. Eng. 22, 015012 (2014) [19] Ch.-A. Gandin, T. Carozzani, H. Digonnet, S. Chen and G. Guillemot, JOM 65, 1122 (2013)
[20] D. R. Liu, N. Mangelinck-Noël, Ch.-A. Gandin, G. Zimmermann, L. Sturz, H. Nguyen Thi and B. Billia, Acta Materialia 93, 24 (2015)
[21] D.R. Liu, N. Mangelinck-Noël, Ch.-A. Gandin, G. Zimmermann, L. Sturz, H. Nguyen-Thi and B. Billia, IOP Series: Materials Science and Engineering 117, 012009 (2016)
[22] D. Tourret, A. Karma, A.J. Clarke, P.J. Gibbs and S.D. Imhoff, IOP Conference Series: Materials Science and Engineering 84, 012082 (2015)
[23] D.Tourret and A. Karma, Acta Materialia 120, 240 (2016)
[24] D. Tourret, A.J. Clarke, S.D. Imhoff, P.J. Gibbs, J.W. Gibbs and A. Karma, JOM 67(8), 1776 (2015) [25] D. Tourret and A. Karma, Acta Materialia 61, 6474 (2013)
[26] J. Alkemper and P.W. Voorhees, Acta Materialia 49, 897 (2001). [27] J.L. Fife and P.W. Voorhees, Acta Materialia 57, 2418 (2009)
[28] L. Sturz, M. Hamacher and G. Zimmermann, submitted to proceedings of SP17 (2017)
[29] A. Ludwig, J. Mogerisch, M. Kolbe, G. Zimmermann, L. Sturz, N. Bergeon, B. Billia, G. Faivre, S. Akamatsu, S. Bottin-Rousseau and D. Voss, JOM 64, 1097 (2012). doi:10.1007/s11837-012-0403-4
Acknowledgement
This work has been carried out as part of the CETSOL European Space Agency microgravity application program (ESTEC contract number 14313/01/NL/SH). The authors would like to acknowledge funding by the German BMWi/DLR (FKZ 50WM1443), the financial support of the Enterprise Ireland via ESA PRODEX Progra mme (contract number 4000107132). The authors acknowledge Hydro-Aluminium Rolled Products GmbH for providing the alloys for the flight samples.