W. Freudling1, P. Møller1, F. Patat1, S. Moehler1, M. Romaniello1, E. Jehin2, K. O’Brien2, C. Izzo1, and E. Pompei2
1 ESO, Karl-Schwarzschild-Strasse 2, 85748 Garching, Germany; [email protected]
2 ESO, Alonso de Cord´ova 3107, Vitacura, Santiago, Chile
Abstract. Photometric calibration observations are routinely carried out with all ESO imaging cameras in every clear night. The nightly zeropoints derived from these observations are accurate to about 10%. Recently, we have started the FORS
Absolute Photometry Project (FAP) to investigate, if and how percent-level
abso-lute photometric accuracy can be achieved with FORS1, and how such photometric calibration can be offered to observers. We found that there are significant differ-ences between the sky-flats and the true photometric response of the instrument which partially depend on the rotator angle. A second order correction to the sky-flat significantly improves the relative photometry within the field. We demonstrate the feasibility of percent level photometry and describe the calibrations necessary to achieve that level of accuracy.
1 Introduction
The two FORS instruments FORS1 and FORS2 are, among their multiple functionalities, optical imaging cameras at the VLT. They are all-dioptric instruments for the wavelength range from 330 to 1100 nm and provide an image scale of 0”.2/pixel, or 0”.1/pixel with the high resolution collimator. Since the FORSes are not direct imaging cameras, they suffer from sky con-centration and other effects which complicate accurate photometry. The goal of the FORS Absolute Photometry (FAP) project is to characterize the pho-tometric performance of the FORS instruments and investigate if and how the routine calibration of the instruments can be changed to offer improved photometric zero points. Our work has so far concentrated on the FORS1 camera, but most of the findings will equally apply for FORS2.
2 Data
To characterize the photometric response, we analyzed archival data taken with FORS1, and obtained new observations of the Stetson fields Mark A, L92, L113 and PG1633. To allow investigation of the flatfield response, data were taken with a dither pattern shown in Fig. 1.
36 W. Freudling et al.
Fig. 1. Dither pattern of the FAP observations on the Mark A field. The pattern includes two rotated frames. The pattern was chosen so that an illumination cor-rection to the flatfield can be derived from all stars within the FORS1 field-of-view which were observed more than once
3 Results
A detailed description of the results of FAP is given in [1]. Here, we give a brief summary of the most important findings.
3.1 Twilight Flats
The master flats routinely produced by the pipeline from twilight flats differ from night to night or even within a night by up to 5%. Some of the pattern seen in the flats rotate with the adaptor angle, which is shown in Figs. 2 and 3. For highly accurate photometry, it is necessary to remove this rotating pattern from the flatfields.
Fig. 2. A sequence of FORS1 B sky-flats, divided by the mean of the flats. The rotator adapter angles (−105◦,−73◦,−35◦, 0◦, +30◦, and +70◦) are indicated by arrows in the upper right corner. It can be seen that the dark band across the detector rotates with the adapter. The intensity scale range is 3%
Fig. 3. The sky-flats shown in Fig. 2 counter-rotated by the adaptor angle and averaged. The visible structure is the rotating part of the flat fields. The intensity scale range is 1%
38 W. Freudling et al.
3.2 Response
After the rotating and fluctuating pattern has been removed from flatfields, they still can be used to correct science observations for variations in the throughput on scales of a small fraction of the detector. The flatfield response on larger scales has to be determined independently. Correcting flatfields for a large scale illumination pattern will also remove any effect of the sky con-centration. This response on large scales can accurately be derived from the dithered observations of standard fields. As an example, the flatfield response of the R-band filter for FORS1 is shown in Fig. 4.
3.3 Error Budget
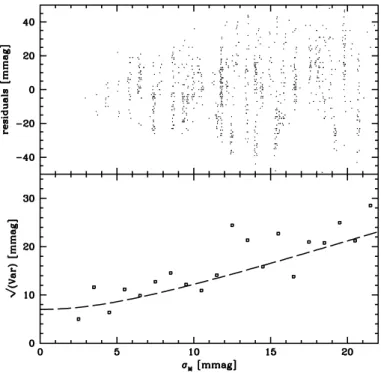
The main contribution to the photometric error are the magnitude mea-surement errors, fluctuation in the extinction, uncertainties in the standard magnitudes and remaining flatfielding errors. A careful analysis of the error budget (see Fig. 5) shows that when the commonly used master flats are corrected as described above, the remaining flatfielding error are significantly less than 1%.
Fig. 4. An illumination pattern of a R-band flat derived from standard fields dithered on a 5×5 grid, with a step size of 20% of the field of view. Such illumination correction should be applied to all FORS flats if percent-level photometric accuracy is required. The intensity scale range is 2%
Fig. 5.Upper panel: Residuals from extinction fits as a function of the combination
of magnitude measurement errors and errors in the listed standard magnitudes.
Lower panel: the variance of the residuals. The dashed line is the error model which
includes statistical errors as well as extinction fluctuations. The error model does not include any residual flatfielding errors. A detailed analysis suggests an upper limit on residual flatfielding and other sources of errors of less than 10 mmag
3.4 Calibrating Nights with Two and Three Standard Fields
Stetson standard star fields [2, 3] contain a large number of photometric standard stars suitable for 8m-class telescopes. Appropriate regions selected from within the Stetson fields contain typically 20–30 standard stars within the FORS field of view. With such a large number of standard magnitudes, the main source of errors in the determination of the extinction is the short term fluctuations in the extinction. The photometric zero point can be determined with an accuracy of about 10 mmag with three standard observations in perfectly photometric nights (see Fig. 6) This demonstrates that percent-level photometric calibration is feasible with the FORSes when appropriate standard fields are used.
40 W. Freudling et al.
Fig. 6. Distribution of the residuals from extinction fits when two (dashed
his-togram) or three (dotted hishis-togram) standard fields are used. The solid line is a
Normal distribution with σ of 10 mmag. The plot demonstrates that under ideal conditions, three photometric standard fields are sufficient to achieve percent-level accuracy
Summary and Outlook
FAP has shown that it is possible to achieve percent-level photometry with
FORS1 with moderate effort. Over the next year, we plan to prepare new photometric standard fields suitable to obtain more accurate photometric solutions and simultaneously derive flatfield corrections and to incorporate new flatfielding algorithms into the FORS pipeline.
References
1. W. Freudling, M. Romaniello, F. Patat, P. Møller, E. Jehin, K. O’Brien: in “The
Future of Photometric, Spectrophotometric, and Polarimetric Standardization”,
ed. C. Sterken, ASP, 364, 2007, pp. 113 2. P.B Stetson: PASP 112, 925 (2000)
3. P.B. Stetson: 2006, fields listed at http://cadcwww.dao.nrc.ca/cadcbin/wdbi. cgi/astrocat/stetson/query