COMMUNAUTÉ FRANÇAISE DE BELGIQUE
ACADÉMIE UNIVERSITAIRE WALLONIE-EUROPE
UNIVERSITÉ DE LIÈGE -GEMBLOUX AGRO-BIO TECH
Development of innovative and practical
management tools to improve sustainability of
milk production and quality of dairy products
VALERIE ARNOULD
Essai présenté en vue de l’obtention du grade
de docteur en sciences agronomiques et ingénierie biologique
Promoteur : Dr. Ir. Nicolas Gengler Co-promoteur : Dr. Ir. Hélène Soyeurt 2015-2016
COMMUNAUTÉ FRANÇAISE DE BELGIQUE
ACADÉMIE UNIVERSITAIRE WALLONIE-EUROPE
UNIVERSITÉ DE LIÈGE -GEMBLOUX AGRO-BIO TECH
Développement d’outils de gestion innovatifs et
utiles aux éleveurs soucieux d’améliorer leur
système de production et la qualité de leurs
produits
VALERIE ARNOULD
Essai présenté en vue de l’obtention du grade
de docteur en sciences agronomiques et ingénierie biologique
Promoteur : Dr. Ir. Nicolas Gengler Co-promoteur : Dr. Ir. Hélène Soyeurt 2015-2016
Copyright
Aux termes de la loi belge du 30 juin 1994, sur le droit d’auteur et les droits voisins, seul l’auteur a le droit de reproduire partiellement ou complètement cet ouvrage de quelque façon et forme que ce soit ou d’en autoriser la reproduction partielle ou complète de quelque manière et sous quelque forme que ce soit. Toute photocopie ou reproduction sous autre forme est donc faite en violation de la dite loi et des modifications ultérieures.
Valérie Arnould. Development of innovative and practical management tools to improve
sustainability of milk production and quality of dairy products. Gembloux, Belgium, Gembloux Agro-Bio Tech, University of Liège.
A
BSTRACTIn the current complex economical context, novel strategies are needed to help local dairy farmers to face the European dairy sector crisis. This thesis was initiated in the framework of ManageMilk project and was globally aimed to investigate the possibility to develop some innovative and practical management tools helping dairy farmers in their daily decisions. To develop such management tools, several conditions must be fulfilled. Firstly, used data must be relevant. According to the literature, the milk composition, and in particular, the milk fatty acid (FA) profile, appears to be a suitable trait allowing useful information about the dairy cow’s health status or about the management system efficiency. These data must also be easily available at low cost from milk recording organization. Recently, the MIR spectrometry offers the possibility to build routinely cheaper and more important databases. To develop management tools, milk samples have to be collected using comparable sampling methods. Unfortunately, in order to decrease the milk quality control costs, the International Committee for Animal Recording allows alternative sampling schemes including the collection of samples from morning or evening only milkings. This alternative sampling scheme can interact with phenotypic and genetic parameters. Therefore, additionally to the development of conversion equations, this thesis is establishing if morning or evening only milkings are genetically different traits. Last condition concerns a useful phenotypic and genetic variability. Milk FA profile is, among others, altered by genetics. So, one paper of this thesis concerns the setup of a useful genetic evaluation model able to estimate accurately the genetic part of milk fat composition variations. Routine genetic evaluation of production traits in dairy cattle commonly uses random regression model (RRM). Recently, “splines” have been advocated as a good alternative to Legendre polynomials (LP) for analyzing test-day yields in RRM. Therefore, several models are compared. Obtained results show the possibility to propose a practical and robust method for estimating accurate daily major FA production from single milking, useful for a further development of practical management tools helping dairy farmers in their daily decisions.
Valérie Arnould. Développement d’outils de gestion innovants et utiles aux éleveurs soucieux
d’améliorer leur système de production et la qualité de leurs produits. (PhD Dissertation en Anglais). Gembloux, Belgium, Gembloux Agro-Bio Tech, Université de Liège.
R
ESUMEDans un contexte économique difficile, de nouvelles stratégies doivent être proposées à nos producteurs laitiers locaux afin de leur permettre de faire face à la crise européenne du secteur laitier. Cette thèse s’inscrit dans le cadre du projet belgo-luxembourgeois ManageMilk dont l’objectif global est la contribution au développement d’outils innovatifs et utiles aux éleveurs laitiers dans leurs décisions quotidiennes. Le développement de tels outils est soumis à plusieurs conditions nécessaires. La première condition est la construction d’une base de données pertinente. La composition du lait et, plus particulièrement le profil en acides gras (AG) du lait, apparaît comme autant de sources d’information utiles reflétant la santé du bovin et l’efficacité du système de production. Les données enregistrées doivent être facilement récoltées et ce, à moindre coût. Récemment, la mise au point de la technologie de spectrométrie MIR permettait la construction, en routine, de bases de données, plus importantes et moins onéreuses que les systèmes d’analyses traditionnels. Les échantillons de lait utilisés doivent également être prélevés selon des protocoles similaires. Cependant, dans le but de réduire les coûts du contrôle laitier, le Comité International d’Enregistrement des Animaux permet la collecte d’échantillons proportionnés selon le moment de traite. Le dernier objectif de cette thèse est donc l’étude de l’effet du moment de traite sur les paramètres génétiques des caractères étudiés. Selon les résultats obtenus, il est possible de construire une méthode pratique et robuste permettant l’estimation de la production d’AG à partir des données d’une seule traite. La dernière condition concerne les variabilités phénotypique et génétique des caractères précités. Les évaluations génétiques appliquées en routine utilisent essentiellement des modèles de régression aléatoires. Selon certaines recherches, l’utilisation de « splines » permettrait de corriger certains défauts des polynômes de Legendre. La comparaison de différents modèles permettant l’étude/estimation des paramètres génétiques de la production laitière est également réalisée dans le cadre de cette étude. En conclusion, les données AG laitiers peuvent être utilisées en tant qu’outils de gestion d’une production laitière bovine.
« Soit A, un succès dans la vie. Alors A = x+y+z. Où x = travailler. y = s'amuser. z = se taire. »
A
CKNOWLEDGMENTS This PhD thesis is the result of many years of work. This thesis would not have been achieved without the help, the advices, and the support of people to whom I would like to express my sincerely gratitude.First, I would like to acknowledge Nicolas G. and Hélène S. for offering me in 2007 the opportunity to study animal breeding and to collaborate with so many people. Thank you for your support and guidance through this work.
Secondly, I would like to extend my sincere gratitude to all my jury members: Marie-Laure Fauconnier (President of the jury, Gembloux Agro-Bio Tech, University of Liège), Nicolas Gengler (my promoter, Gembloux Agro-Bio Tech, University of Liège), Hélène Soyeurt (my co-promoter, Gembloux Agro-Bio Tech, University of Liège), Yves Beckers (Gembloux Agro-Bio Tech, University of Liège), Pierre Dardenne (CRA-W, Belgique), and Jeanne Bormann (ASTA, Luxembourg).
I would like to also acknowledge the institutions that supported my project:
- The Walloon Regional Ministry of Agriculture (Ministère de la Région Wallonne, Direction Générale de l’Agriculture: D31-1178, section 1) for funding the first years of this study;
- The Fonds National de la Recherche Luxembourg that funded the four last years of the PhD project: ManageMilk: AFR PHD-09-119-RE;
- CONVIS s.c. and more essentially Christoph Peifer-Weihs, Carole Weydert, Romain Reding, Armand Braun, Jeff Stirn, Tom Dusseldorf and others;
- The Consortium des Equipments de Calcul Intensifs (CECI) that provided computational resources and that is funded by the National Fund for Scientific Research (Brussels, Belgium) under grant No.2.5020.11.
My gratitude also goes to:
- Hélène S. for her advices and her presence. Thank you so much for encouraging me all over these years and, more especially during these 2 last years. Thank you for your valuable and very helpful comments;
- Frederic C. for his helpful advices since 2006;
- Jean S. for offering the possibility to build ManageMilk in 2010;
- Yves B., Pierre D., and Jeanne B. for their advices and their participation in this thesis committee;
- My colleagues from the “Genetics Team”: Catherine, Pierre, Alain, Sylvie, Amaury, Jérémie, Hana, Aurélie, Marie-Laure, Alain, and all the people working in the Animal
their participation in the different publications;
- All the co-authors of the papers presented in this thesis ; - Yannick, Maëlle, my family, and close friends for their support
R
EMERCIEMENTS A ma famille, mes amis, mes collègues…Au bout de 17 ans cumulés de fac (eh oui, déjà…), il n’est pas évident de faire une liste des gens à remercier. La liste ne sera sans aucun doute pas exhaustive. On espère toujours rédiger au moins une page et finalement, une seconde page n’est pas de trop, et nous sommes toujours certains d’avoir oublié quelqu’un.
Mes premiers remerciements vont à ma famille, mes parents qui m’ont encouragée et donnée la chance de faire mes études à la faculté de Gembloux. Merci de m’avoir appris à persévérer et à faire des échecs, une force. Merci à mon frère d’être toujours là pour moi, pour notre complicité.
Merci à Yannick, mon Amour, pour son soutien. A la veille de ce grand jour que j’aurais adoré partager avec Toi, j’ai une pensée toute particulière pour Nous.
Merci à notre puce, Maëlle, qui du haut de ses 5 ans, est un réel soutien à elle toute seule. Merci à Isabelle, mon Amie, pour ses conseils, ses encouragements.
Merci à Stéphanie, pour son soutien et ses encouragements lors de ces 2 dernières années. Merci à Livia pour ses encouragements et son soutien dans cette dernière ligne droite.
Merci à mes collègues, stagiaires, étudiants, qui sont passés et restés plus ou moins longtemps. Mes collègues de Gembloux, mes collègues de zootechnie d’abord, pour leur contribution à la joyeuse ambiance de nos bureaux. Mes collègues de la « Nicolas’s Team » pour les bons moments et les bons souvenirs gardés en mémoires, nos voyages en conférences, … Pour avoir essuyé quelques petits « pétages » de plombs, et moments « OFF » (Catherine, Marie, Jérémie, Pierre, Hedi, Sylvie, Frédéric, Alain, Hélène, Aurélie, Laura, Hana, Marie-Laure, etc.). Merci à Frédéric de m’avoir permis de réintégrer les murs de la faculté en 2006, d’abord en Biologie animale et microbienne et que j’ai eu le plaisir de retrouver plus tard en zootechnie. Merci pour ton amitié, ta disponibilité, et tes conseils toujours constructifs. Merci à Nicolas de m’avoir tout d’abord proposé un poste au sein de son équipe, et de m’avoir encouragée dans la création de ManageMilk. Merci tout particulier à Hélène pour sa confiance, son encadrement, ses conseils, nos discussions et réflexions et tous nos moments constructifs. Merci encore pour son soutien précieux au cours des derniers mois de thèse…
compréhension ; Véronique, ma « coloc de bureau » pour sa bonne humeur ; Romain R., Jeanne B. et Jean S. pour leur confiance en moi et pour leur assistance dans la création et l’aboutissement de ManageMilk. Merci à Rocco, Charles, Frédérique, Martine, Quentin, Luc, etc. Merci à l’AWE, en particulier à Carlo, Alain et Gerry, pour leurs données, et leurs conseils.
Merci au CRA-W, départements Qualité et Production, en particulier, Pierre D., Frédéric D., Nam N., Eric F..
Enfin, plus loin dans le temps, mes amis de fac, qui me laissent tant de souvenirs et de sourires : Odile, Quentin, Daniel, Isabelle, Hélène, etc. Ils se reconnaîtront. Cette thèse signera probablement la fin de mon long séjour dans ces « vieux murs de Gembloux » mais restera l’aboutissement d’une longue succession de bons souvenirs…
T
ABLE OFC
ONTENTLIST OF ABBREVIATIONS ... 1
CHAPTER I.GENERAL INTRODUCTION ... 3
1.1. Context ... 5
1.2. Outline ... 7
1.3. Framework ... 8
Bibliography ... 9
CHAPTER II. ... 11
REVIEW :MILK COMPOSITION AS MANAGEMENT TOOL OF SUSTAINABILITY ... 11
2.1. Abstract ... 13
2.2. Résumé ... 13
2.3. Introduction ... 14
2.4. Health management ... 16
2.4.1. Acetonemia and energy balance ... 16
2.5. Indicators of mammary inflammationt... 20
2.6. Feeding and environmental management ... 23
2.7. Using milk components as multiple (health and environmental) indicators in dairy cattle management ... 25
2.8. Conclusion ... 27
Acknowledgements ... 27
Bibliography ... 28
CHAPTER III. ... 33
GENETIC VARIABILITY OF MILK FATTY ACIDS ... 33
3.1. Abstract ... 35
3.1.1. Genetic variability of milk fatty acids. ... 35
3.2. Introduction ... 35
3.3. Quantitative approach ... 38
3.3.1. Breed differences ... 38
3.3.2. Individual genetic variability ... 40
Acknowledgments ... 49
Bibliography ... 50
CHAPTER IV. ... 59
OBJECTIVES ... 59
CHAPTER V. ... 65
SHORT COMMUNICATION:GENETIC VARIATION OF SATURATED FATTY ACIDS IN HOLSTEINS IN WALLOON REGION OF BELGIUM ... 65
5.1. Abstract ... 67
Acknowledgements ... 78
Bibliography ... 78
CHAPTER VI. ... 81
SHORT COMMUNICATION:EFFECTS OF ALTERNATIVE MILK RECORDING SCHEMES ON THE GENETIC PARAMETERS OF MILK FATTY ACIDS. ... 81 6.1. Abstract ... 83 6.2. Conclusions ... 93 Acknowledgements ... 94 Bibliography ... 94 CHAPTER VII. ... 99
PREDICTIONS OF DAILY MILK AND FAT YIELDS, MAJOR GROUPS OF FATTY ACIDS, AND C18:1 CIS-9 FROM SINGLE MILKING DATA WITHOUT A MILKING INTERVAL ... 99
7.1. Simple summary ... 101
7.2. Abstract ... 101
7.3. Introduction ... 102
7.4. Materials and methods ... 104
7.4.1. Available Data ... 104
7.4.1.1. Overall strategy ... 104
7.4.1.2. Calibration Data ... 104
7.4.1.3. Validation Data ... 108
7.4.2. Development of Statistical Models for Estimating Daily Yields from AM or PM milking .... ... 108
7.5. Results and discussion ... 110
7.5.2. Phenotypic Correlation ... 115
7.5.3. Models Selected Using PROC GLMSELECT ... 117
7.5.4. Goodness of Fit ... 119 7.5.5. Model Validation ... 121 7.5.6. Milking Interval ... 122 7.6. Conclusions ... 123 Acknowledgements ... 124 Bibliography ... 125 CHAPTER VIII. ... 129
GENERAL DISCUSSION,CONCLUSION AND PERSPECTIVES ... 129
8.1. General Discussion ... 131
8.1.1. Condition 1: Relevant traits for management purposes ... 131
8.1.1. Condition 2 : Easy and cheap acquisition of large-scale individual traits ... 133
8.1.2. Condition 3: Easy comparison between used data independent of the recording system 134 8.1.3. Condition 4: Genetic and phenotypic variability of selected traits ... 139
8.2. Conclusion ... 144
8.3. Perspectives ... 145
Bibliography ... 148
LIST OF TABLES ... 155
LIST OF FIGURES ... 159
1
L
IST OF ABBREVIATIONSAIC Akaike’s information criterion AM Ante meridian (morning) BIC Bayesian information criterion BHBA ß-hydroxybutyrate
CLA Conjugated linoleic acid cDIM Class of days in milk DC Daily content DIM Days in milk
DGAT-1 Diacylglycerol O-acyltransferase EBV Estimated breeding value
FA Fatty acids
FPratio Ratio of milk fat/protein
FTIR Fourier transform infrared spectrometry GHG Greenhouse gases
ICAR International Committee for Animal Recording LCFA Long chain fatty acids
LTF Lactoferrin
LP Legendre polynomial MCFA Medium chain fatty acids MIR Mid-infrared
MI Milking interval
MUFA Mono-unsaturated fatty acids NPN Non-protein nitrogen
2 PUFA Poly-unsaturated fatty acids QTL Quantitative trait loci R Correlation value
R² Coefficient of determination
R²cv Cross-validation coefficient of determination RMSE Root mean squared error
RPD Ratio of SECV to SD
RRM Random regression model
RRTDM Random regression test-day model SCC Somatic cells count
SCD Delta-9 desaturase SCFA Short chain fatty acids SCS Somatic cell count SD Standard deviation
SEC Standard error of calibration SECV Standard error of cross-validation SFA Saturated fatty acids
SNP Single-nucleotide polymorphisms
SP Spline
SSE Sum of squares error
TD Test-day
3
CHAPTER I:GENERAL INTRODUCTION
5
1.1. Context
Over recent years Europe encounters a serious agricultural, and in particular, dairy crisis. According to the European Commission and the European Council, the crisis in the European dairy sector is a result of a combination of several factors such as the Russian embargo on Europe agri-food products, a lower than expected Chinese demand for dairy products, the increasing production of volumes of milk in Europe after the abolition of the milk quota system, as well as an overall observed increasing production of milk in New Zealand and Australia.
In this complex economical context, the policy of the European Commission Rural Development aims to improve sustainability of agriculture, as well as to improve the quality of life in rural areas and the diversity of rural economies. Therefore, milk recording organizations in Europe, have a strong role to play in the development of management tools helping to improve sustainability of dairy farms.
CONVIS s.c., as an agricultural and breeding cooperative in Luxembourg, is a provider of services such as performance testing for breeding animals, consultancy in animal husbandry related areas such as feeding and farm management. CONVIS s.c. is a service provider for the official milk recording, offers advisory services for animal breeding, performs evaluations of cost and analysis of production characteristics. Thus, CONVIS s.c. actively supports the Luxembourgish dairy farmers by making available, relevant management tools in order to improve sustainability of dairy farms.
Compared to other European countries, Luxembourg presents some particularities. Among the European Member States, Luxembourg has the smallest number of agricultural holdings (2,200) in 2010 (Eurostat, 2010). Over the 2000-2010 timeframe, 540 farms ceased their activities. In parallel, as widely observed across the EU-28, Luxembourg also encountered an important decrease in the number of people working on farm falling by 21% between 2000 and 2010 (4,960 workers).The used agricultural land experienced the opposite trend by an increase to 131,110 hectares in 2010 (+2.9 % vs. 2000). The most common farms are farms with at least 50 hectares of agricultural land representing about half (49%) of the number of agricultural holdings and occupied 86% of the country’s agricultural land in 2010. Further, in
6
terms of the number of holdings, dairy farms are the most common category of farms: they accounted for 27% of the country’s farm population and 47% of the Standard Output in 2010 (Standard Output is defined as the average monetary value of the agricultural output at farm gate price of each agricultural product in a given region). Consequently, developing management tools for farmers in Luxembourg is relevant.
From this general context, this thesis which is the result of a collaboration between CONVIS s.c. and the Animal Science Unit of Gembloux Agro-Bio Tech (University of Liège, Belgium) aims to contribute to the development of innovative and practical management tools helping dairy farmers to improve the sustainability of their farms.
In particular, the innovative aspect of this thesis is to strengthen the use of data routinely recorded to develop such tools. The use of test-day records is an interesting opportunity to develop management tools. Indeed, test-day yield records from the milk recording system provide an important source of information for both breeding and management (Caccamo et al., 2008). Historically, herd management improvement and breeding values’ estimation have been separate processes but the use of dairy records should be more than a simple reporting of yield performance or inputs for the estimation of breeding values (Bastin et al., 2009). However, there are clear advantages of using the same data and statistical procedures for both management purposes and genetic evaluation (Caccamo et al., 2008).
Further, in practice, routine measurement of milk components offers the potential for early detection of systemic and/or local alteration and, consequently, provides assistance for strategic and management decisions. Mid-infrared (MIR) spectrometry is already used routinely by milk recording organizations and milk laboratories to quantify the contents of fat, protein and lactose in milk samples. However, this use could be easily extended to other milk components. Indeed, several papers (Soyeurt et al., 2006, 2008a, 2008b, and 2011; Rutten et al., 2009) have shown the potential of MIR spectrometry for quantifying small fractions, such as fatty acids (Soyeurt et al., 2006 and 2011).
CHAPTER I:GENERAL INTRODUCTION
7
Consequently, the working hypothesis of this thesis is that several milk components predicted by MIR spectrometry could be used as indicators of the metabolic status of dairy cows and/or the nutritional quality of milk and/or the environmental sustainability. Particularly, the knowledge of the milk fatty acid (FA) profile produced by dairy cows seems to be interesting with regard to this perspective. To refine the analysis and correct the noisy background related to the natural sources of variation such as dietary composition, genetics, lactation stage, energy balance and animal status (e.g. parity, days in milk, health status) (Arnould et al., 2009; Beaulieu et al., 1995; Chilliard et al., 2001;Gross et al., 2011; Grummer, 1991; Palmquist et al., 1993), computer-based systems are very useful in interpreting differences between the observed and expected values of given milk components predicted by MIR, which could be used as a guideline for health management and preventive systems. Such an approach would result in the development of easy, cheap and useful sustainable management tools assisting dairy farmers in their daily decisions.
1.2. Outline
This thesis is a compilation of published scientific papers and is structured in 8 chapters. As mentioned in the title, the global objective of this thesis is to contribute to the development of innovative management tools for dairy farmers allowing them to improve their dairy production system and product quality. As aforementioned, a first literature review permitted to identify the contents of milk fatty acid as potential interesting traits with regard to their environmental, animal health and nutritional aspects (Chapter II).
The development of management tools takes profit of the existing genetic and phenotypic variability of the studied traits. A second literature review was conducted to summarize the state of the knowledge in genetic variability of FA (Chapter III). Unfortunately, no information was available for dairy cattle in Luxembourg. Therefore a study was conducted to define a model allowing the estimation of genetic parameters. This study compared two
8
approaches using more or less computational resources to model the evolution of genetic parameters throughout the lactation (Chapter V).In milk production, quality control samples are typically taken during both the AM and PM milkings. CONVIS s.c. proposes alternative procedures that restrict sampling to a single time of day as approved by the International Committee for Animal Recording. These alternative testing schemes present economic advantages in daily routine explaining the interest of farmers in Luxembourg. However, the composition of AM- and PM-collected milk samples can differ and impact the estimation of genetic and phenotypic variability. Therefore, a study conducted in the context of this thesis had two objectives: 1) the estimation of FA genetic parameters for dairy cattle in Luxembourg and 2) the estimation of the impact of an alternate milking testing scheme on the phenotypic and genetic variability (Chapter VI). As variability was observed among times of milking, one solution studied in this thesis was to develop conversion equations allowing the prediction of daily yields of production traits (milk, milk fat and FA) from readily available field data (Chapter VII).
In order to better assess the results obtained in this thesis and their potential added value for the dairy cattle sector, the final chapter of the present thesis contains a general discussion presenting perspectives and conclusions (Chapter VIII).
1.3. Framework
This thesis was initiated in the framework of ManageMilk project financed by A.F.R.-F.N.R. (AFR PHD-09-119-RE) (Fonds National de la Recherche Luxembourg). This project was jointly conducted by CONVIS s.c. (Ettelbruck, Luxembourg) and the Animal Science Unit of Gembloux Agro-Bio Tech, University of Liège (GxABT - ULg, Gembloux, Belgium).
CHAPTER I:GENERAL INTRODUCTION
9
Bibliography
Arnould V.M.R., and H. Soyeurt. 2009. Genetic variability of milk fatty acids. J. Appl. Gene. 50: 29-39.
Bastin C., Laloux L., Gillon A., Miglior F., Soyeurt H., Hammami H., Bertozzi C. and N. Gengler. 2009. Modeling milk urea of Walloon dairy cows in management perspectives. J. Dairy Sci. 92: 3529-3540.
Beaulieu A.D. and D.L. Palmquist. 1995. Differential effects of high fat diets on fatty acid composition in milk of Jersey and Holstein cows. J. Dairy Sci. 78: 1336–1344.
Caccamo M., Veerkamp R.F., De Jong G., Pool M. H., Petriglieri R., and G. Licitra. 2008. Variance components for test-day milk, fat, and protein yield, and somatic cell score for analyzing management information. J. Dairy Sci. 91: 3268-3276.
Chilliard Y., Ferlay A., and M. Doreau. 2001. Effect of different types of forages, animal fat or marine oils in cow’s diet on milk fat secretion and composition, especially conjugated linoleic acid (CLA) and polyunsaturated fatty acids. Livest. Prod. Sci. 70: 31-48.
Eurostat, Agricultural census in Luxembourg, 2011 (http://ec.europa.eu/eurostat/statistics-explained, visited on 12/11/2015).
Gross J., van Dorland H.A., Bruckmaier R.M., and F.J. Schwarz. 2011. Milk fatty acids profile related to energy balance in dairy cows. J. Dairy Res. 78: 479-488.
Grummer R.R. 1991. Effect of feed on the composition of milk fat. J. Dairy Sci. 74: 3244-3257. Palmquist D.L., Beaulieu A.D., and D.M. Barbano. 1993. Feed and animal factors influencing milk
fat composition. J. Dairy Sci. 76: 1753-1771.
Rutten M.J.M., Bovenhuis H., Hettinga K.A., van Valenberg H.J.F., and J.A.M. van Arendonk.2009. Predicting bovine milk fat composition using infrared spectroscopy based on milk samples collected in winter and summer. J. Dairy Sci. 92: 6202-6209.
10
Soyeurt H., Dardenne P., Lognay G., Veselko D., Mayeres P., and N. Gengler. 2006. Estimating fatty acid content in cow milk using mid-infrared spectrometry. J Dairy Sci. 89: 3690– 3695.
Soyeurt H. and N. Gengler. 2008a. Genetic variability of fatty acids in bovine milk. Biotechnol. Agro. Soc. Environ. 12: 203–210.
Soyeurt H., Dehareng F., Mayeres P., Bertozzi C., and Gengler N. 2008b. Genetic variability of Δ9-desaturase activity in dairy cattle. J. Dairy Sci. 91: 3211–3224.
Soyeurt H., Arnould V.M.R., Vanderijck S., and N. Gengler. 2011. Feasibility of a Walloon genetic evaluation for milk fat composition. J. Dairy Sci. 93: 744.
11
C
HAPTERII.
R
EVIEW:
M
ILK COMPOSITION AS MANAGEMENT TOOL OF SUSTAINABILITYFrom: Arnould V. M. R., Reding R., Bormann J., Gengler N., and H. Soyeurt. 2013. Review: milk composition as management tool of sustainability. Biotechnologie, Agronomie, Société et Environnement. 17 : 613-621
CHAPTER II: REVIEW:MILK COMPOSITION AS MANAGEMENT TOOL OF SUSTAINABILITY
13
2.1. Abstract
The main objective of this paper is the use of milk composition data as a management tool. Milk composition, and in particular, milk fat content and fatty acid profiles may be significantly altered due to a variety of factors. These factors are reviewed in the literature; they include diet, animal (genetic) selection, management aspects and animal health. Changes in milk composition can be used as an indicator of the animal’s metabolic status or the efficiency of the feed management system. The advantages of using this kind of data as a management tool would be to allow the early detection of metabolic or management problems. The present review suggests that milk and, especially milk fat composition may be used as a sustainability management tool and as a monitoring and prevention tool for several pathologies or health disorders in dairy cattle. Further, due to the use of mid-infrared spectrometry (MIR) technology, these tools may be easily implemented in practice and are relatively cheap. In the field, milk labs or milk recording agencies would be able to alert farmers whenever threshold values for disease were reached, allowing them to improve their dairy production from an economic, ecological and animal (welfare) point of view.
Keywords. Cow milk, composition, management techniques, sustainability, fatty acids,
spectrometry, decision support systems, and livestock management.
2.2. Résumé
L’objectif principal de cette synthèse bibliographique est l’étude de l’utilisation de la composition laitière en tant qu’outil de décision et de gestion. La composition laitière est relativement variable et de nombreux facteurs de variation sont répertoriés dans la littérature tels que le régime alimentaire, la sélection animale, la conduite du troupeau ou le statut sanitaire de l’animal. La composition laitière se révèle être un véritable miroir du statut métabolique de la vache laitière et de l’efficacité du système de gestion du troupeau. Cet article
14
suggère donc l’utilisation pratique de la composition laitière en tant qu’outil d’aide à la décision, en vue d’améliorer la durabilité de la production laitière grâce au contrôle, au suivi et à la détection précoce de dysfonctionnements métaboliques ou de gestion du troupeau. Des valeurs limites sont disponibles en tant qu’exemple dans la littérature pour certains composés. Par ailleurs, l’utilisation de l’outil MIR facilitera (d’un aspect pratique et économique) l’application d’un tel outil sur le terrain. Enfin, les organismes chargés d’assister les éleveurs dans leurs décisions pourront alerter les producteurs laitiers en cas de risque de maladie, leur permettant de traiter tout problème préventivement et d’améliorer ainsi leur production laitière d’un point de vue économique, écologique et animal (bien-être). Mots-clés. Lait de vache, composition, technique de gestion, durabilité, acides gras, spectrométrie, système d’aide à la décision, conduite d’élevage.
2.3. Introduction
In the last two decades, the beef and dairy sectors have faced new challenges regarding sustainability issues. The current challenge is to improve the economic efficiency of dairy cows by improving productivity and lowering costs (e.g. feed, veterinary). Firstly, human consumption patterns of beef and dairy products have changed and, currently, besides being driven by price, consumers are basing their choices more often on health aspects of food. Thus, it is becoming increasingly important for dairy farmers to take into account these considerations and to adapt their milk production system to consumer and dairy industry needs. Fortunately, milk composition and, in particular, milk fat content and fatty acid (FA) profiles may be significantly altered through management interventions such as changes in diet (e.g. Grummer, 1991; Chilliard et al., 2000; Chilliard et al., 2001; Forsbäck et al., 2010), but also through animal (genetic) selection (Arnould et al., 2009a). The high elasticity of milk fat content offers the opportunity to respond to industry and consumer requirements.
Secondly, efficient milk production requires dairy cows to experience gestation and parturition every year. Most of the metabolic diseases of dairy cows occur within the first weeks
CHAPTER II: REVIEW:MILK COMPOSITION AS MANAGEMENT TOOL OF SUSTAINABILITY
15
of lactation. Indeed, the cow’s high nutrient demand due to an increased mammary gland activity cannot always be met. The most economically relevant diseases in higher yielding cows are milk fever, ketosis (or acetonemia) and mastitis. Understanding the variation in milk composition can be useful for providing information about the health status of dairy cows. Indeed, modifications in the metabolic process, and changes in milk yield, fatty acids, protein fractions or mineral content can be used as indicators for the metabolic status of the cow (Fleischer et al., 2001; Mulligan et al., 2006). In this case, the efficiency of a cow health management system is determined by the ability to diagnose changes in animal health status at an early stage and the ability to develop preventive measures (Hamann et al., 1997). The earlier health problems are identified, the higher the chance of successful health management, with positive consequences for farm management, economical, ecological and animal welfare issues. Indeed, a more effective prevention system for common dairy diseases and the improvement of the health status of dairy cows would, indirectly, help to improve dairy farming from an economical and ecological point of view. Such a system would limit labor investment, medical treatment costs, and animal suffering (social aspects), and would also increase milk yield and milk quality, including the animal’s lifetime production. In addition, analysis of milk composition could provide some interesting information about the efficiency of the feed management system. Furthermore, feed management issues are highly related to the agricultural environmental footprint. Indeed, methane production, for instance, corresponds to a loss of productive energy in cows and is negatively correlated to feed conversion (Boichard et al., 2012).
In practice, routine measurement of milk components during milk recording offers the potential for early detection of systemic and/or local alteration and, consequently, provides assistance for strategic and management decisions. Limiting negative influences on dairy cows is the key issue in achieving this objective. The majority of analytical techniques (e.g., gas chromatography, ELISA, or immuno-diffusion methods) used for measuring specific milk components in bovine milk are expensive and time consuming, and require skilled staff. Therefore, these methods are not feasible for making regular measurements relating to individual cows. This inconvenience can be solved by using mid-infrared (MIR) spectrometry.
16
This technology is already used routinely by milk recording organizations to quantify, for instance, fat, protein and lactose content in milk samples. Several papers (Soyeurt et al., 2006, 2008a, 2008b, and 2011; Rutten et al., 2009) have shown the potential of MIR spectrometry for quantifying small fractions, such as fatty acids (Soyeurt et al., 2006 and 2011). Therefore, MIR spectrometry could be used to routinely quantify various milk components. Furthermore, computer-based systems could be very useful in interpreting differences between the observed and expected values of a milk component, which could be used as a guide for health management and preventive systems.
Several milk components that can be predicted by MIR spectrometry could be used as indicators of the metabolic status of dairy cows. For instance, the milk fatty acid (FA) profile is a dynamic pattern influenced by several factors such as dietary composition, genetics, lactation stage, energy balance and animal status (e.g. parity, days in milk, health status) (Grummer, 1991; Palmquist et al., 1993; Beaulieu et al., 1995; Chilliard et al., 2001; Arnould et al., 2009a; Gross et al., 2011). Moreover, protein, fat, the fat:protein ratio, levels of acetone, etc. could be used as disease, feeding and environmental management indicators, and indirectly, as economic indicators, using observed deviations from normal concentrations and their trends of change (Hamann et al., 1997; Chilliard et al., 2009).
The objective of this review is to determine the practical aspects of measuring milk composition and milk fat in order to propose an easy, cheap and useful sustainable management tool to help dairy farmers in their daily decisions.
2.4. Health management
2.4.1. Acetonemia and energy balance
At the beginning of lactation, the dairy cow must cope with an important increase in energy demand by the mammary gland for milk production. This is achieved partly by increasing
CHAPTER II: REVIEW:MILK COMPOSITION AS MANAGEMENT TOOL OF SUSTAINABILITY
17
feed intake and partly by fat mobilization from the cow’s adipose tissue. However, excessive fat mobilization may induce an imbalance in hepatic carbohydrate and fat metabolism, characterized by elevated concentrations of ketone bodies (ß-hydroxybutyrate [BHBA], acetoacetate, and acetone), a state called hyperketonemia. Hyperketonemia, in its clinical manifestation (ketosis or acetonemia), has an economical effect through decreased milk production and a greater risk of periparturient diseases such as mastitis and left displaced abomasum (Enjalbert et al., 2001; Mulligan et al., 2006). Subclinical ketosis and negative energy balance are closely linked and numerous studies available on the relationship between modifications in milk composition and the metabolic status of dairy cows focus on the energy metabolism (Hamann et al., 1997). Ketone bodies are produced as by-products when FAs are used in energy metabolism in the liver and kidney. Consequently, subclinical ketosis frequently results from an over-long negative energy balance. Because of its importance in dairy cattle (some studies conclude that approximately 50% of all lactating cows develop subclinical ketosis in early lactation), numerous authors have reviewed this kind of metabolic disorder in dairy cattle (e.g. Hamann et al., 1997; Van Haelst et al., 2008; Gross et al., 2011; Van Der Drift et al., 2012).
Even if there are no clinical signs of ketosis, milk composition may still be affected (Enjalbert et al., 2001). Current detection methods are based on the measurement of ketone bodies in body fluids (blood, urine or milk) (Van Haelst et al., 2008; Van Der Drift et al., 2012). As expected, both clinical and subclinical ketosis results in increased concentrations of ketone bodies in blood, tissues and milk. As blood sampling is not very convenient for farmers, analyzing milk composition would seem to be an interesting and more practical alternative. A few authors have reported studies comparing concentrations of ketone bodies in milk and blood (e.g. Van Haelst et al., 2008; Van Der Drift et al., 2012). In 2001, Enjalbert et al. observed high correlation coefficients between blood and milk acetone (0.96) and moderate correlation coefficients between blood and milk acetoacetate (0.74). The detection of milk acetone and BHBA could therefore be considered as a good predictor of ketosis in dairy cows. In some countries, such as The Netherlands, acetone and BHBA are already routinely analyzed by Fourier transform infrared spectrometry (FTIR) without any extra cost to the dairy farmer (Van Der Drift
18
et al., 2012). Unfortunately, the number of false-positive test results restricts the usability of acetone and BHBA for reliable detection of acetonemia.
The FA composition of milk could also be used to detect preclinical ketosis. Indeed, milk fat production is the main expenditure for milk production in dairy cows. Moreover, the milk fat profile has been shown to change markedly during the first weeks of production (from week 1 to week 12) and to remain unchanged thereafter (Gross et al., 2011). For all these reasons, and as mobilization of adipose tissue precedes the development of ketosis and incorporation of mobilized FAs into milk fat, changes in milk FA composition might be an early indicator of hyperketonemia (Van Haelst et al., 2008; Van Der Drift et al., 2012). To summarize, milk FAs can be derived from four major pathways: diet, the mammary gland (de novo synthesis), rumen (bacterial synthesis) and body fat mobilization (Stoop et al., 2009). Thus where a negative energy balance occurs, there may be several reasons underlying the changes in FA composition. Several studies (e.g. Van Haelst et al., 2008; Gross et al., 2011) have proposed relative increases in the proportions of omega-9 (or C18:1 cis9) and long chain fatty acids (LCFAs) as an interesting indicator of subclinical ketosis. Nutrient and energy deficiencies are compensated by mobilization of body fat reserves, predominantly of adipose tissue, associated with the release of FAs. Indeed, the major FAs released during fat mobilization are C16:0, C18:0 and C18:1 cis-9. Unfortunately, milk LCFAs may be largely influenced by diet. Correlations between energy balance and the proportion of C18:1 cis-9 have been shown to range from 0.77 (van Haelst et al., 2008) to 0.92 (Gross et al., 2011). These results confirm that a high proportion of LCFAs (especially if combined with lower medium chain fatty acid [MCFA] proportions) and, in particular, a high proportion of C18:1 cis-9 in milk fat can be considered as a good predictor of subclinical ketosis (Van Haelst et al., 2008).
According to several authors (Hamann et al., 1997; Heuer et al., 1999; Mulligan et al., 2006), the ratio of milk fat/protein (FPratio) is a useful risk predictor for numerous pathologies observed in dairy cattle, such as negative energy balance, ketosis, displaced abomasums, lameness and mastitis. In 1999, Heuer et al. proposed threshold values for diagnosing health problems in a given dairy cow using analysis of its milk composition. Using these threshold
CHAPTER II: REVIEW:MILK COMPOSITION AS MANAGEMENT TOOL OF SUSTAINABILITY
19
values, Mulligan et al. (2006) established that milk containing an FPratio > than 1.4, a milk protein percentage lower than 2.9%, a milk fat percentage higher than 4.8% and a milk lactose value lower than 4.5% was an indicator for health problems in cows (Table 1). Toni et al. (2011) studied three large Italian dairy herds with 1,498 Holstein dairy cows, 35.8% of which were in first lactation. According to the data collected, the FPratio category with the lowest disease prevalence was between 1 and 1.5. On the other hand, cows presenting an FPratio < than 1 showed a higher risk of developing disease. However, it would seem to be important to use these threshold values carefully, as they would need to be adapted to the particular dairy cow population under study.
In addition, many of these milk production traits (fat and protein content, acetone and BHBA concentration) can vary according to the breed, parity number, season, etc. As a result, some authors, such as Van Der Drift et al. (2012), proposed improvements that could be made in order to improve the reliability of acetonemia detection by including the following components in the final diagnostic model: fat content, fatty acid composition (SCFAs, MCFAs, LCFAs and C18:1 cis-9), protein content, FPratio, acetone concentration, BHBA concentration, and other relevant factors, such as parity and season.
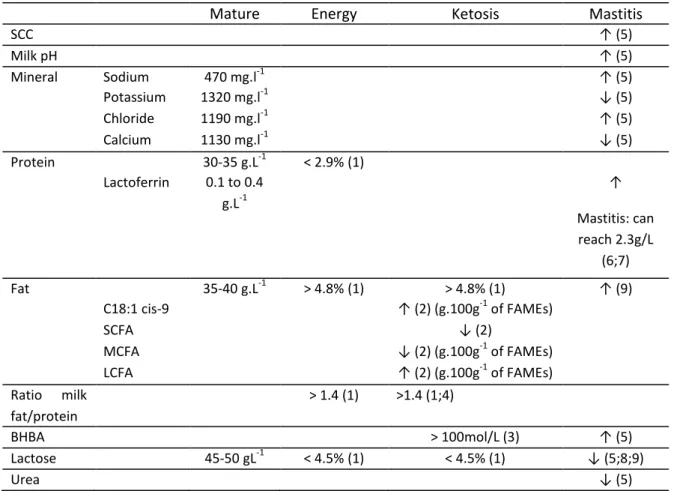
20
Table 1. Effects of metabolic diseases on milk composition. The composition of mature milk (vs colostrum) is shown for comparison — Effet des maladies dites métaboliques sur la composition du lait. Afin de permettre les comparaisons, la composition du lait est également indiquée.
SCFA= short-chain fatty acids; MCFA = medium-chain fatty acids; LCFA = long chain fatty acids; BHBA = ß-hydroxybutyrate; FAMEs = Fatty acids methyl esters. Numbers in parentheses indicate the reference(s) corresponding to the effect (↑: increase; ↓: decrease). Values are threshold values. Les numéros indiqués entre parenthèses correspondent aux références bibliographiques utilisées afin de décrire l’effet (↑: augmentation; ↓: diminution). Les valeurs indiquées sont des valeurs seuil. References: (1) Mulligan et al., 2006; (2) Van Haelst et al., 2008; (3) Toni et al., 2011; (4) Van Der Drift et al., 2012; (5) Brandt et al., 2010; (6) Kutila et al., 2004; (7) Soyeurt et al., 2007; (8) Pyörälä, 2003; (9) Rajcevic et al., 2003
2.5. Indicators of mammary inflammation
In a well managed dairy herd, both clinical mastitis and subclinical mastitis should be efficiently detected (Pyörälä, 2003). Unfortunately, bacteriological sampling is not feasible as a routine test to identify subclinical mastitis. It is well known that mastitis affects the quality of
Mature milk Energy balance Ketosis Mastitis SCC ↑ (5) Milk pH ↑ (5) Mineral Sodium 470 mg.l-1 ↑ (5) Potassium 1320 mg.l-1 ↓ (5) Chloride 1190 mg.l-1 ↑ (5) Calcium 1130 mg.l-1 ↓ (5) Protein 30-35 g.L-1 < 2.9% (1) Lactoferrin 0.1 to 0.4 g.L-1 ↑ Mastitis: can reach 2.3g/L (6;7) Fat 35-40 g.L-1 > 4.8% (1) > 4.8% (1) ↑ (9) C18:1 cis-9 ↑ (2) (g.100g-1 of FAMEs) SCFA ↓ (2) MCFA ↓ (2) (g.100g-1 of FAMEs) LCFA ↑ (2) (g.100g-1 of FAMEs) Ratio milk fat/protein > 1.4 (1) >1.4 (1;4) BHBA > 100mol/L (3) ↑ (5) Lactose 45-50 gL-1 < 4.5% (1) < 4.5% (1) ↓ (5;8;9) Urea ↓ (5)
CHAPTER II: REVIEW:MILK COMPOSITION AS MANAGEMENT TOOL OF SUSTAINABILITY
21
milk, and several authors (e.g. Pyörälä, 2003; Brandt et al., 2010) have reported changes in the composition of milk obtained from cows with infection. Thus, these changes in milk composition could be used as indirect mammary inflammation indicators. The most important changes are: an increasing permeability of the mammary epithelium, leading to a leak of ions, proteins and enzymes from the blood into milk (Bannerman et al., 2003), the invasion of phagocyting cells into udder compartments (Pyörälä, 2003; Komine et al., 2006), and a decreasing production capacity of the mammary gland, resulting in reduced concentrations of certain milk components (Pyörälä, 2003). Besides a high somatic cells count (SCC), the most important changes in milk composition resulting from subclinical mastitis are an increase in free FA concentration; a reduction in casein combined with an increase in whey protein; a reduction in lactose concentration; changes in the concentration of minerals such as sodium, chloride, potassium, and calcium, and an increase in milk pH (Brandt et al., 2010).
An increase in the somatic cell count (SCC) is the first indicator of inflammation. A high SCC found in the milk of healthy cows is essentially due to the presence of macrophages (66-88%), neutrophils (1-11%), epithelial cells and mononuclear cells (Pyörälä, 2003; Forsbäck et al., 2010). In the case of inflammation of the mammary gland, the proportion of neutrophils may increase by up to 90%. The SCC in milk has been commonly used as a mastitis indicator since the 1960s. In order to take into account SCC fluctuations in relation to a cow’s number of days in milk (DIM), different SCC thresholds have been proposed within lactation. The proposed SCC threshold values for the Canadian Holstein population are: 500,000; 300,000; and 200,000 cells.ml-1for the following DIM classes: 5 to 10, 11 to 30, and 31 to 305 DIM, respectively (Koeck et al., 2012). Bovine lactoferrin (LTF) is also moderately correlated with the SCC. Arnould et al. (2009b) estimated positive genetic and phenotypic correlations between LTF and the SCC (0.24 and 0.31, respectively; P < 0.0001). These values would seem to indicate that the LTF content in milk may increase proportionally to the SCC value. Bovine LTF is mainly present in milk and the protein shows important physiological and biological functions (such as antibacterial, antiviral, antifungal and antiparasitical characteristics). This multifunctional protein plays a key role in the health of the mammary gland. According to several authors (Seyfert et al., 1996; Wojdak-Maksymiec et al., 2006; Soyeurt et al., 2007; Arnould et al., 2009b), the LTF gene could be
22
considered as a potential candidate gene for selection of mastitis resistance. Concentration of LTF in bovine milk increases significantly during mammary infections such as mastitis, and the degree of increase is related to the severity of the disease. The LTF concentration ranges from 0.1 g.l-1 (mature milk: 0.1 to 0.4 g.l-1) to 5 g.l-1 (colostrum: 1.5 to 5 g.l-1). Although LTF is present in low concentrations in the milk of healthy cows, LTF concentrations in milk may increase up to a level of 2.3 g.l-1 during clinical mastitis (Kutila et al., 2004; Soyeurt et al., 2007) (Table 1).
A recent genetic study in Canadian Holsteins shows a genetic correlation of 0.69 between mastitis and the average somatic cell score (SCS) (Koeck et al., 2012). Other studies have estimated genetic correlations between mastitis and the SCC, ranging from 0.3 to 0.8, with an average of 0.6 (Heringstad et al., 2000). Thus, according to Koeck et al. (2012), even though mastitis and the SCS have a common genetic background, they may not be regarded as the same trait.
Lactose values are also capable of displaying disorders in the secretory tissues. Indeed, udder infections cause the biosynthesis of lactose to decrease (Pyörälä, 2003; Rajcevic et al., 2003; Brandt et al., 2010; Forsbäck et al., 2010). In 2003, Rajcevic et al. obtained a correlation between SCC and lactose of -0.42. According to Pyörälä (2003), lactose may be a more reliable indicator of mammary gland disorders as compared to SCC. Lactose presents an interesting advantage as an indicator as its day variation is very low (0.9%) compared to the day-to-day variations in fat content (7.7%), milk yield (7.0%) and the SCC (2.0%) (Forsbäck et al., 2010). Thus, net observed decreases in lactose content are useful predictors of inflammation risk (Table 1).
Mastitis also causes some changes in milk conductivity, due to damage in the mammary epithelium, thus altering the balance of specific minerals, such as potassium, sodium and chlorine ions. These minerals may thus be useful predictors for mastitis (van Hulzen et al., 2009; Brandt et al., 2010). Similar to the variation in lactose values, variations in the milk mineral concentration are obviously a response to udder inflammation, though these variations might, to some extent, also be related to other effects. By contrast, changes in milk fat and total protein content in milk are influenced by several other factors, including feed composition. Early
CHAPTER II: REVIEW:MILK COMPOSITION AS MANAGEMENT TOOL OF SUSTAINABILITY
23
detection of mastitis might be related to the correlation between different indicators, such as the SCC, lactose and protein.
2.6. Feeding and environmental management
In the last few decades, numerous studies have dealt with the negative impact of dairy cattle on the environment. Nowadays, an ever increasing number of studies are focusing on environmental issues in agriculture, and more specifically, in animal production systems. In 2010, agriculture was believed to contribute about 10% to the total EU-25 emissions of greenhouse gases (GHG) (EUROSTAT, 2012; Schils et al., 2005) and about 6% to the total GHG emissions in the United States (EPA, 2013). Animals are considered to contribute about 36% to the total emission values (Weiske et al., 2006). Methane (CH4) and nitrous oxide (N2O) are considered to be the primary greenhouse gases emitted by agricultural activities (EPA, 2013). Among the various agricultural activities, most GHG production is, directly or indirectly, caused by animal production, particularly of ruminants. Indeed, the main sources of agriculture-related GHG emissions are enteric fermentation, rumination of cattle and sheep, handling of manure (CH4) and agricultural soil practices (N2O). Thus we can conclude that CH4and N2O emissions are closely related to dairy production. Another important source of GHG is linked to the importation of feedstuffs, mostly protein-rich feeds (transport).
Milk composition mainly depends on the quality of the feed, i.e. feed composition, energy and fiber content, etc. Milk urea content can be used as an indicator for dietary crude protein concentration (Kuterovac et al., 2005). In 2001, Godden et al. described the relationship between milk urea content and nutritional management, production, and economic variables in commercial dairy herds. There are three main sources of urea in milk: the final product of protein decomposition, the digestion of non-protein nitrogen (NPN), and the catabolism of amino acids in the mammary gland. Milk protein contains true-protein (95%) and NPN (5%). Milk urea contributes most to the NPN fraction (30-35% of the NPN: Bastin et al., 2009; Biswajit et al., 2011). According to Kuterovac et al. (2005) and Biswajit et al. (2011), average herd milk
24
urea concentrations are positively related to the dietary crude protein and rumen (un)degradable protein. Biswajit et al. (2011) also showed that milk urea measurements determined by infrared test methodology provide a useful tool for monitoring the efficiency of nitrogen utilization in dairy cattle. Diets those are too rich in protein lead to higher feed costs, environmental pollution and fertility problems (Biswajit et al., 2011). On the other hand, very low milk urea content could indicate protein deficiencies in the diet of dairy cattle, potentially leading to a loss of production. Target values for milk urea content used by farm advisors (Belgium, Walloon Region) are generally within a range between 200 and 400 mg.l-1 (Bastin et al., 2009). However, it still remains important to take into account certain characteristics of the cow, such as her stage of lactation, her parity number, etc. Consequently, monitoring milk urea content presents several economic and ecological benefits. Indeed, this tool could be useful in decreasing milk urea concentrations, in reducing the excretion of excess nitrogen into the environment, and consequently in lowering feed costs, while maintaining the cow’s level of milk yield (Kuterovac et al., 2005; Bastin et al., 2009; Biswajit et al., 2011).
Boichard et al. (2012) looked at the relationship between feed management practices and the environmental footprint. In that study, feed costs were decreased through the use of alternative diet compositions, all while maintaining the herd’s milk yield at a constant level. This led to a decrease in the GHG emissions by the dairy cattle under study. This proves that the environmental concerns of consumers could be met by adapting herd management techniques, lowering the impact of dairy farming on GHG emission values and, indirectly, improving the economical sustainability of dairy production systems. In addition, despite the fact that GHG emissions currently have no direct value on the market, decreasing the agricultural environmental footprint becomes a major challenge for the future (Boichard et al., 2012) (e.g. increased importance of environmental policies, introduction of “emissions taxes” to be paid by farmers [Moraes et al., 2012]).
Unfortunately, only a few studies have analyzed the relationship between milk composition and GHG production levels. Recent studies have shown that FA profiles may be used as indicators for the “environmental quality of milk” (e.g. Chilliard et al., 2009; Dijkstra et al.,
CHAPTER II: REVIEW:MILK COMPOSITION AS MANAGEMENT TOOL OF SUSTAINABILITY
25
2011). Fatty acid profiles thus represent a valuable tool for reducing methane emissions. The incentive for reducing methane emissions is two-fold. Firstly, a reduction in methane emissions leads to a decrease in the impact of GHG on the environment. Secondly, since methane production corresponds to a loss of productive energy by the dairy cow (Chilliard et al., 2009), there is great interest in providing indicators that will allow for a decrease in methane emission values. Various milk FAs show a moderate relationship with methane production in dairy cattle. According to the study of Chilliard et al. (2009), which was based on eight lactating multiparous Holstein cows, saturated FAs (SFAs) showed the highest positive correlation value with methane output (r = 0.87 to 0.91). Extremely high correlations were obtained for 8:0 to 16:0 (r = 0.94) and for the sum of C18-FA (r = -0.94). The relationship between milk FAs and methane output is easy to explain. As stated previously, milk FAs are derived from four major pathways: diet, the mammary gland, bacterial synthesis and body fat mobilization (Chilliard et al., 2009; Stoop et al., 2009). On the one hand, synthesis both of FAs and of methane, acetate, and butyrate presents a common biochemical pathway. On the other hand, dietary FAs, especially SCFAs, MCFAs, LCFAs, and poly-unsaturated FAs (PUFAs), present a negative impact on protozoa, cellulolytic bacteria, or archaea methanogene populations, and consequently, on methane production (Chilliard et al., 2009). In addition, in the FAs studies carried out by Chilliard et al. (2009), most FAs presented an interesting correlation with methane production levels (16 18:1; cis-9, trans-13 18:2; trans-12 18:1; trans-trans-13+14 18:1; trans-6+7+8 18:1; cis-15 18:1; and trans-11, cis-15 18:2). These FAs are known as biohydrogenation intermediates, and are indirectly linked to the dietary 18:3 content. This explains why diets showing high concentrations of PUFAs tend to decrease methane production.
2.7. Using milk components as multiple (health and environmental)
indicators in dairy cattle management
The main objective for using various milk components as management tools for promoting the sustainability of dairy production systems (health, feeding and environmental aspects) is to
26
obtain valuable indicators for diseases and unbalanced diets, which might be helpful for preventing metabolic problems at an early stage. Table 1 shows normal concentrations of several milk components, such as their range of changes according to different diseases or metabolic disorders. However, the evidence from the authors cited shows that expression levels of disease can vary from one study to another. Some authors prefer to present normal levels and threshold values for disease, while others display these values as a ratio (pathological value divided by physiological value).
As indicated previously, some milk components may present different day-to-day variations (e.g. lactose vs fat content) (Forsbäck et al., 2010). Fortunately, for the majority of metabolic disorders, at least two parameters may vary, thus allowing the setting up of a pre-diagnostic test. In practice, normal physiological variances would need to be determined for each parameter used (Hamann et al., 1997).
In order to improve the interpretation of milk composition patterns, a reference system needs to be set up for easy interpretation of available data. Indeed, values presented in this review may only be valid for that given dairy cow population or herd and may not be used as reference values for different dairy herds or cow populations. Threshold values for disease must be used with caution. It is important to study each dairy cow population separately and to adapt the threshold values accordingly. Values given in this review would still need to be adapted and validated in the field. In addition, due to variations between individual cows, this kind of strategy needs to be applied on a herd level, not on the basis of individual cows. Finally, the measurement of milk composition is meant as both a monitoring and a prevention tool. In other words, this tool can never replace close monitoring of a herd by the farmer and appropriate veterinary care, but may be used as an efficient alert system for preventing health disorders in cows.
CHAPTER II: REVIEW:MILK COMPOSITION AS MANAGEMENT TOOL OF SUSTAINABILITY
27
2.8. Conclusion
Milk yield, milk and milk fat composition may be used for developing strategies for the prevention and monitoring of production dysfunctions in dairy cattle and for the improvement of the sustainability of dairy production systems. The threshold values for disease in cattle presented in this review were obtained from the current literature. These values are examples and should be used with caution. Nevertheless, the present review suggests that milk and milk fat composition may be used both as a sustainability management tool and as a monitoring and prevention tool for several pathologies and health disorders in dairy cattle. The FA profile of milk may also be used to predict methane production in dairy cattle; however, more data reflecting a wide range of diets will be required to confirm the usefulness of the prediction model. In addition, due to the use of MIR technology, these tools may be easily implemented in practice and are relatively cheap. Milk labs or milk recording agencies would be able to alert farmers whenever threshold values for disease were reached, representing a valuable tool for health and environmental management. Using such prevention tools could thus help to improve the sustainability of dairy farmers. Indeed, in addition to avoiding losses arising from clinical diseases (milk yield losses, veterinary costs, etc.), and unbalanced diets, the prevention of production dysfunctions would also improve the reproductive performance of dairy herds, their udder health, animal welfare aspects (consumer concerns), labor input (medical treatment of cows), environmental aspects (decrease in the use of drugs and decrease in GHG emissions), etc. In this way, the introduction of prevention tools would contribute to improvements in dairy production from an economical, ecological and animal welfare point of view.
Acknowledgements
The present project is supported by the National Research Fund, Luxembourg (AFR PHD-09-119-RE). Nicolas Gengler (Honorary Senior Research Associate) and Hélène Soyeurt (Post-Doctoral Researcher) acknowledge their support by the FNRS (National Fund for Scientific
28
Research, Brussels, Belgium). Additional support of the FNRS was provided by grants F.4552.05, 2.4507.02 F (2), 2.4623.08, and B127.11.
Bibliography
Arnould V.M.-R. & Soyeurt H., 2009a.Genetic variability of milk fatty acids. J. Appl. Genet., 50(1), 29-39.
Arnould V.M.-R. et al., 2009b. Genetic analysis of lactoferrin content in bovine milk. J. Dairy Sci.,
92, 2151-2158.
Bastin C. et al., 2009.Modeling milk urea of Walloon dairy cows in management perspectives. J. Dairy Sci., 92, 3529-3540.
Bannerman D.D., Paape M.J., Hare W.R. & Sohn E.J., 2003. Increased levels of LPS-binding protein in bovine blood and milk following bacterial lipopolysaccharide challenge. J. Dairy Sci., 86, 3128-3137.
Beaulieu A.D. & Palmquist D.L., 1995. Differential effects of high fat diets on fatty acid composition in milk of Jersey and Holstein cows. J. Dairy Sci., 78, 1336-1344.
Biswajit R. et al., 2011. Evaluation of milk urea concentration as useful indicator for dairy herd management: a review. Asian J. Anim. Vet. Adv., 6(1), 1-19.
Boichard D. & Brochard M., 2012. New phenotypes for new breeding goals in dairy cattle. Animal, 6(4), 544-550.
Brandt M., Haeussermann A. & Hartung E., 2010.Invited review: technical solutions for analysis of milk constituents and abnormal milk. J. Dairy Sci., 93(2), 427-436.
Chilliard Y., Ferlay A., Mansbridge R.M. & Doreau M., 2000. Ruminant milk fat plasticity: nutritional control of saturated, polyunsaturated, trans and conjugated fatty acids. INRA Ann. Zootechnie, 49, 181-205.
CHAPTER II: REVIEW:MILK COMPOSITION AS MANAGEMENT TOOL OF SUSTAINABILITY
29
Chilliard Y., Ferlay A. & Doreau M., 2001.Effect of different types of forages, animal fat or marine oils in cow’s diet on milk fat secretion and composition, especially conjugated linoleic (CLA) and polyunsaturated fatty acids. Livest. Prod. Sci., 70, 31-48.
Chilliard Y., Martin C., Rouel J. & Doreau M., 2009.Milk fatty acids in dairy cows fed whole crude linseed, extruded linseed, or linseed oil, and their relationship with methane output. J. Dairy Sci., 92, 5199-5211.
Dijkstra J. et al., 2011. Relationships between methane production and milk fatty acid profiles in dairy cattle. Anim. Feed Sci. Technol., 166, 590-595.
Enjalbert F., Nicot M.C., Bayourthe C. & Moncoulon R., 2001. Ketone bodies in milk and blood of dairy cows: relationship between concentrations and utilization for detection. J. Dairy Sci., 84, 583-589.
EPA, 2013.Inventory of U.S. greenhouse gas emissions and sinks: 1990–2011. EPA 430-R-08–005. Washington, DC, USA: U.S. Environmental Protection Agency, http://www.epa.gov/climatechange/Downloads/ghgemissions/US-GHG-Inventory-2013-Main-Text.pdf, (24/09/2013).
EUROSTAT, 2012. Climate change statistics. European Communities.
Fleischer P. et al., 2001. The relationship between milk yield and the incidence of some diseases in dairy cows. J. Dairy Sci., 84, 2025-2035.
Forsbäck L. et al., 2010. Day-to-day variation in milk yield and milk composition at the udder-quarter level. J. Dairy Sci., 93(8), 3569-3577.
Godden S.M. et al., 2001. Relationship between milk urea concentrations and nutritional management, production, and economic variables in Ontario dairy herds. J. Dairy Sci.,
84, 1128-1139.
Gross J., van Dorland H.A., Bruckmaier R.M. & Schwarz F.J., 2011. Milk fatty acids profile related to energy balance in dairy cows. J. Dairy Res., 78, 479-488.