The dissociative ionization of C
2H
2. The C
+, C
2+and CH
2+dissociation
channels. The vinylidene ion as a transient?
R. Locht , M. Davister
Département de Chimie Générale et de Chimie Physique, Institut de Chimie, Bât. B6, Université de Liège, Sart-Tilman par B-4000 Liège 1, Belgium
Abstract
The dissociative electroionization of C2H2 has been investigated in the C + , C2 + and CH2 + dissociation channels. Both the translational energy and the appearance energies of these three ions have been measured. The kinetic energy versus appearance energy diagrams related to each of these species are discussed in detail and dissociation mechanisms are proposed for all observed onset energies. For the three ionic species, the dissociation pathways leading to the fragmentation of C2H2
+
into C+, C2 +
and CH2 +
, successively, have to run very likely over an isomerisation mechanism of the molecular ion. The isomeric vinylidene structure could be the most probable intermediate.
1. Introduction
The detailed investigation of the dissociative ionization of C2H2 and C2D2 in the H+, C2H+ and CH+
channels has recently been reported [1,2]. The appearance energy and the translational energy of these fragment ions were measured. Production mechanisms were discussed and the dissociation energy of the H-C2H and the
HC≡CH bonds has been determined. The formation of these fragment ions essentially occurs through bond breaking along the internuclear axis of the molecule.
In contrast, the production of the remaining ions appearing in the mass spectrum of C2H2 might involve
the molecular ion not only in its linear geometry, but possibly also predominantly in its isomeric configurations, e.g., the vinylidenic geometry.
Experimental work devoted to the investigation of the fragmentation of acetylene is fairly scarce. Excepting the C2H
+
formation, which has been investigated by electron impact, photoionization and photoion-photoelectron coincidence spectroscopy, the deeper fragmentation processes of this molecule leading to C+, C
2+
and CH2+ were almost only investigated by electron impact.
Most of the published electron impact work on C2H2 is limited, beside the C2H+ ion, to the investigation
of the appearance of C2 +
[3-8] and C+ [3,6-8]. By rare gas ion impact on acetylene, Maier [9] observed the C2 and
C+ formation and determined appearance energies. Though the CH2+ ion still represents 0.6% of the total
ionization of C2H2 at 70 eV electron energy, this fragment has not been investigated until fairly recently. Plessis
and Marmet [8] and Cooper et al. [10] measured onset energies [8,10] branching ratios and oscillator strengths [10] for the production of this species. The only known photoionization mass spectrometric work has been reported by Hayaishi et al. [11] and included data on the C2+ and CH2+ ions. The observation of C+ has not been
mentioned. Furthermore, none of these experiments were equipped for ion energy analysis.
On the other hand, dissociative excitation processes induced by electron impact have been published. Beenakker and De Heer [12] measured the excitation function for emission of both C(1P→1D) at 193.09 nm and C2(D 1Σ u+
→X 1Σ g
+
) at 232.5 nm and threshold energies were determined. Beside Lyman-α and -β emissions, Pang et al. [13] reported also the observation of CI emissions at 165.7 nm and measured the threshold energies.
In this work, the dissociative electroionization study of C2H2 in the C + , C2 + and CH2 + channels will be reported. Appearance energies and transla-tional energy (as a function of the electron energy) will be measured for these fragment ions. With the help of these data, the production mechanisms of these species will be discussed in detail.
2. Experimental
The experimental technique used in this work has been described elsewhere [14,15]. Briefly, the ions produced in a Nier-type ion source by the impact of energy controlled electrons are allowed to drift out of the ion chamber, are focussed on the ion source exit hole, energy analyzed by a retarding lens and mass selected in a quadrupole mass spectrometer. The detected ion current is continuously scanned as a function of either the electron energy at fixed retarding potential settings VR or the retarding potential at fixed electron energy Ee. Both
signals are electronically differentiated. Most of the experimental parameters are computer controlled.
The experimental conditions are identical to those described previously [1] and the same precautions are maintained to keep the background signal as low as possible. Acetylene-h2 is of 99.997% purity, stored under
high pressure and added with 1% acetone.
The maximum of the C2H2+ ion energy distribution is used as the zero-kinetic energy scale calibration
point. The ionization energy of Ne at 21.564 eV [16] and of C2H2 at 11.403 eV (used as internal standard) [17]
are used for the electron energy scale calibration.
3. Data acquisition and handling. Error estimation
For each fragment ion, at each retarding potential or electron energy setting, the first differentiated ionization efficiency or retarding potential curve is recorded and averaged over 8-75 h (100-1200 scans) depending on the ion intensity and the range to be scanned. This procedure has been repeated at least 5 times to ensure reproducibility and to allow us to estimate the error on threshold energy determinations. The curves represented in the following sections are averaged curves of at least 5 independent measurements. The quoted error and drawn error bars consequently represent one standard deviation.
In the ion kinetic energy versus appearance energy diagrams, linear regressions are fitted to the data. This method provides two parameters, important in this work, i.e., (i) the extrapolation to zero kinetic energy, related to the level of the dissociation limit involved and (ii) the slope of the straight line, related to the dynamics of the considered dissociation. The correlation coefficient, usually calculated on the linear regression, provides an estimation of the validity of the fit. It does by no means give an estimate of the error on the two parameters of the straight line.
Recently [1] we used a method to calculate the error on the slope and the extrapolation. On the basis of a few assumptions, usually met by the present data, and defining the correlation coefficient r by
for the fit of the linear regression
to the experimental data, it has been proved that the standard deviations σa on the slope a and σb on the
extrapolation b are given by the expressions
To compare experimental and expected values of a and b with a confidence limit fixed at 95%, the Student test is used, i.e.,
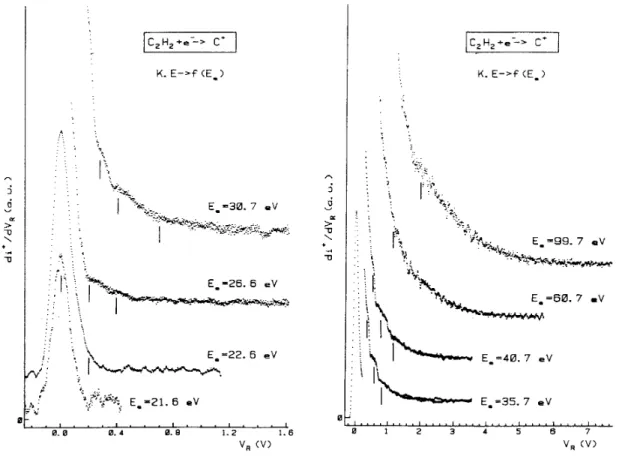
Fig. 1. First differentiated retarding potential curves of C+/C2H2 as observed between 23.0 and 99.0 eV electron
energy. Vertical bars locate fine structure energies.
4. Experimental results
4.1. The C+ dissociation channel
The kinetic energy distribution of C+, as given by the first differentiated retarding potential curve, is represented in Fig. 1 for increasing impinging electron energies. Close to the onset, the distribution is purely thermal. For 22.6 eV electrons a shoulder is clearly observed on the high energy side of the peak and measured at 200 meV ion energy. For increasing electron energies, i.e. from 26 to 40 eV, new ion energy distributions are observed at 400 and 700 meV. For energies above 40 eV, new distributions peak at about 1.0 and 2.0 eV ion energies. The intensity of these structures increases when the electron energy is increased and above 60 eV the C+ ion energy distribution smoothly decreases from 3 eV and extends up to about 7 eV ion energy.
A sample of typical first differentiated ionization efficiency curves of C+, recorded as a function of the retarding potential VR, is shown in Fig. 2. Vertical bars locate the average appearance energy value obtained
from five independent measurements. For VR = 0.0 V threshold energies have been measured at 21.16 ± 0.30,
22.24 ± 0.20, 23.6 ± 0.2 and 25.5 ± 0.1 eV.
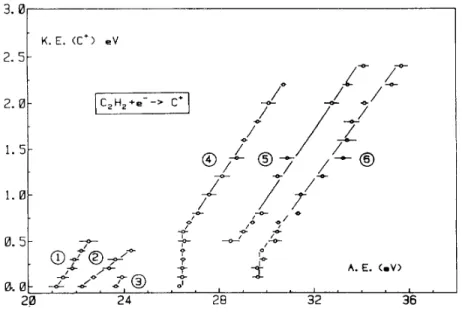
By measuring these appearance energies for retarding potential settings increasing by 0.1 or 0.2 V steps between 0.0 and 2.8 V, the kinetic-energy versus appearance energy diagram related to C+ is obtained and is displayed in Fig. 3. Very clearly, at least five different C+ ion-producing reactions are observed in the 20-38 eV electron energy range. Remarkably, the low energy processes 1-3 involve low kinetic energies, whereas in the high energy processes 4-6 large amounts of translational energies are produced. This observation clearly confirms the translational energy distributions measured as a function of the impinging electron energy. Furthermore, by linear regression, excepting process 2, almost one slope value s characterizes the other straight line fits, i.e. about s = 0.37. The expected slope s is given by the ratio mC2H2 - mC/mC2H2 = 14/26 and should be of
0.538. As discussed in detail in earlier publications [1,2,14] the deviation of the experimental slope from the expected value indicates the inter-conversion of translational into internal energy of the polyatomic fragments.
Therefore, it could already be stressed that all C+-producing processes will involve this mechanism and will proceed through reactions involving polyatomic fragments.
Fig. 2. Sample of first differentiated ionization efficiency curves of C+/C2H2 at different retarding potential
settings VR = 0.0-2.6 V. Vertical bars locate the averaged appearance energies.
4.2. The C2 +
dissociation channel
The translational energy distribution of C2+ is strictly thermal and is therefore not represented here. It
has been measured between the onset and 90 eV electron energy. No measurable shift of the peak maximum, with respect to the C2H2 ion distribution, could be measured and no significant peak broadening has been
observed. This means that the translational energy carried away by C2+ is lower than 10 meV. The same
observations were made for C2 +
from C2D2. This implies that the maximum total translational energy which
could be involved in the C2 +
-producing process is less or equal to 130 meV. This should be taken into account as the maximum uncertainty (systematic error) on the energy balance made in the discussion presented in the following sections.
A typical first differentiated ionization efficiency curve of C2+ as observed from C2D2 is represented in
Fig. 4. The vertical bars locate the average onset energies of C2 +
. Clearly three appearance energies are observed in C2D2, i.e. at 18.5 + 0.2, 19.5 ± 0.3 and 23.12 ± 0.12 eV, successively. In C2H2 the corresponding energies are
at 18.44 ± 0.07, 19.58 ± 0.14 and 23.00 ± 0.11 eV, respectively. 4.3. The CH2+ dissociation channel
In spite of the precautions taken for keeping the background mass spectrum as low as possible, the signal corresponding to N+/N2 could not be suppressed completely. Therefore, the low intensity of the
CH2 +
/C2H2 signal, interfering with N +
/N2, has not been considered for electron energies above the appearance
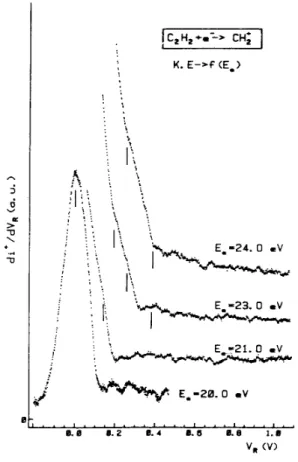
energy of N+/N2, i.e. 24.3 eV [18]. The CH2+ translational energy distribution, observed between the onset and
24 eV electron energy, is shown in Fig. 5. At the onset, the CH2+ ions carry away no translational energy. For
increasing electron energy, a shoulder at 120 meV ion energy appears for 21 and 23 eVelectron impact energy. At 23 eV and more clearly at 24 eV electron energy a distribution peaking at about 400 meV becomes visible. At
this energy the CH2+ ion energy distribution spreads up to 1.3 eV.
Fig. 3. The KE versus AE diagram of C+/C2H2 between 20 and 37 eV electron energy. Encircled numbers are
used for the identification of the straight lines related to the successive processes discussed in the text.
Fig. 4. First differentiated ionization efficiency curve of C2 +
/C2D2. Vertical bars locate critical energies
discussed in the text.
A sample of first differentiated ionization efficiency curves of CH2 +
, as recorded for different retarding potential settings VR, is represented in Fig. 6. Vertical bars locate the threshold energies. When no retarding
potential is applied to the CH2+ beam (VR = 0.0 V) three onset energies are observed at 19.74 ± 0.12, 21.10 ±
0.20 and 24.31 ± 0.16 eV.
By plotting the appearance energies (AE) as a function of the retarding potential (KE) the diagram displayed in Fig. 7 is obtained. The four straight lines fitting the experimental data are obtained by linear
regression. As mentioned earlier, the contamination of the CH2+ signal by N+/N2 is very likely for two reasons.
First the observation of the onset at 24.31 eV corresponding very well to the appearance energy of N+/N2 [18]
and secondly the slope of the straight line (3) is 0.56 which is significantly higher than the slope of 0.46 expected and observed for CH2+/C2H2. Both straight lines (3) and (4) have been observed previously in a detailed
dissociative electroionization work dedicated to N+ formation from N2 [18]. For comparison the original data
related to the latter ion are included in the same figure (full circles in Fig. 7).
Fig. 5. First differentiated retarding potential curves of CH2+Ú C2H2 as observed between 20.0 and 24.0 eV
electron energy. Vertical bars locate fine structure energies.
5. Discussion
For the easiness in the following discussion, the most important and well established data used in this work to calculate onset energies for the dissociative ionization and dissociative excitation processes giving rise to C+, C2
+
and CH2 +
are gathered in Table 1. Ionization energies of C2H2 are included in the same table.
5.1. The C+ dissociative ionization channel
The lowest onset for the appearance of C+ is measured at 21.16 ± 0.30 eV. The dependence of this critical energy upon the C+ ion initial transla-tional energy is represented by the straight line (1) in Fig. 3. The calculated regression provides a linear fit with a correlation coefficient of 0.993. The extrapolation to KE(C+) = 0.0 eV is 21.20 ± 0.05 eV with a slope of 0.38 ± 0.03. The expected slope is given by the ratio 14/26 = 0.54. As mentioned earlier [1,2], the discrepancy between experimental and expected slope has to be ascribed to the partitioning of the excess energy, with respect to the dissociation limit, between translational energy and internal energy of the polyatomic fragments.
5. Discussion
For the easiness in the following discussion, the most important and well established data used in this work to calculate onset energies for the dissociative ionization and dissociative excitation processes giving rise to C+, C2+ and CH2+ are gathered in Table 1. Ionization energies of C2H2 are included in the same table.
Fig. 6. Sample of first differentiated ionization efficiency curves of CH2+/C2H2 at retarding potential settings VR
= 0.0-1.0 V. Vertical bars locate the average appearance energies.
Fig. 7. The KE-versus-AE diagram of CH2+/C2H2 between 18 and 29 eV electron energy. Encircled numbers are
used for the identification of the straight lines related to the successive processes discussed in the text. The dashed straight line has a slope of 0.46. The full circles refer to the data points of N+/N2 as measured in an
5.1. The C+ dissociative ionization channel
The lowest onset for the appearance of C+ is measured at 21.16 ± 0.30 eV. The dependence of this critical energy upon the C+ ion initial transla-tional energy is represented by the straight line (1) in Fig. 3. The calculated regression provides a linear fit with a correlation coefficient of 0.993. The extrapolation to KE(C+) = 0.0 eV is 21.20 ± 0.05 eV with a slope of 0.38 ± 0.03. The expected slope is given by the ratio 14/26 = 0.54. As mentioned earlier [1,2], the discrepancy between experimental and expected slope has to be ascribed to the partitioning of the excess energy, with respect to the dissociation limit, between translational energy and internal energy of the polyatomic fragments.
differentiated ionization efficiency curve of C+. Plessis and Marmet [8] measured the first threshold at 20.43 ± 0.05 eV. The most recent determination from Cooper et al. [10] provides 23.0 ± 1.0 eV. By Ar+ ion impact, Maier [9] obtains a minimum appearance energy of 22.66 ± 0.40 eV. Owing to the broad scattering of these measurements, it is difficult to compare these data with the present determination.
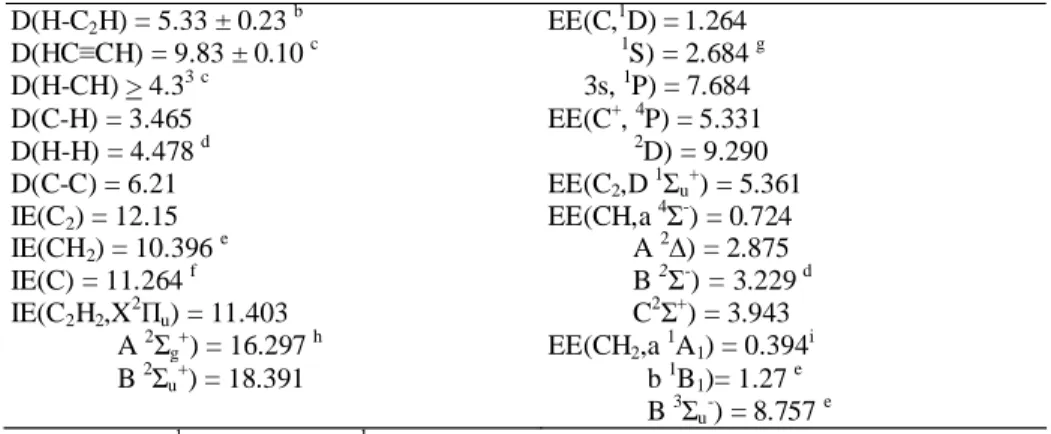
Table 1: Dissociation (D), excitation (EE) and ionization (IE) energies (eV) of C2H2, CH2, C2, H2, CH, and C
used in this work a
D(H-C2H) = 5.33 ± 0.23 b EE(C,1D)=1.264 D(HC≡CH) = 9.83 ± 0.10 c 1S) = 2.684 g D(H-CH) > 4.33c 3s, 1P) = 7.684 D(C-H) = 3.465 EE(C+, 4P) = 5.331 D(H-H) = 4.478 d 2D) = 9.290 D(C-C) = 6.21 EE(C2,D 1Σ u + ) = 5.361 IE(C2) = 12.15 EE(CH,a 4Σ -) = 0.724 IE(CH2) = 10.396 e A 2∆) = 2.875 IE(C) = 11.264 f B 2Σ -) = 3.229 d IE(C2H2,X2Πu) = 11.403 C2Σ+) = 3.943 A 2Σg + ) = 16.297 h EE(CH2,a 1 A1) = 0.394 i B 2Σu + ) = 18.391 b 1B1)= 1.27 e B 3Σu-) = 8.757 e a 1 eV = 23.060 kcal mol-1 = 8 065.73 cm-1. b
Ref. [1]. c Ref. [2]. d Ref. [19], e Ref. [20]. f Ref. [16],
g
Ref. [21]. h Ref. [17]. iRef. [22].
The lowest thermodynamical onset which could be calculated for the production of C+ from C2H2
through the reaction
should be at 20.22 ± 0.10 eV, i.e. about 1.0 eV lower than the appearance energy measured in this work (data used from Table 1). However, the predicted onset for reaction (1) agrees fairly well with the onset determined by Plessis and Marmet [8] who assigned the reaction
to this onset energy.
From the present measurements, repeated five times independently, no appearance energy could be observed below 21.16 eV. To this onset correspond C+ ions carrying no translational energy. The energy difference of 21.2(±0.30)-20.22(±0.10) = 0.98 ± 0.40 eV has to be ascribed to electronic and/or vibrational excitation of the fragments. As the subject has been reviewed recently by Shavitt [22] the a 1A1-X 3Σg- energy
separation in CH2 is 3165 ± 20 cm-1 or 0.394 eV. The next vibronic state of CH2 lies at 7100 cm-1 (0.88 eV)
should be assigned to the onset at 21.2 eV. This mechanism is compatible with the observed slope of 0.38, i.e. part of the excess energy with respect to 21.2 eV is carried away as vibrational energy carried by the polyatomic CH2 (a 1A1, υ*) species.
Obviously, the species produced in reaction (2) could not be correlated with C2H2+ in its linear
configuration. It has to run over a hypersurface allowing an isomeric form of C2H2 to produce CH2 species. The
isomerisation of the acetylene molecular ion from its linear geometry (D∞h) to e.g., the vinyli-dene configuration
(C2v) in the ionic state, has to occur. This state would lie in the energy range of 21.2-22.5 eV (see Fig. 3) which
corresponds almost exactly to the energy range where an autoionizing state is observed in the threshold photoelectron spectrum of C2H2 [2]. The corresponding photoelectron band is structureless and shows up as a
shoulder of the C2H2 (C 2Σg) band, also observed in the He(II)-photoelectron spectrum [23]. Several quantum
mechanical calculations were devoted to the acetylene-vinylidene rearrangement [24-26]. Only Ros-mus et al. [23] performed theoretical investigations above 20 eV. A vinylidene cationic 2A1 state is calculated at 25.5 ± 0.4
eV.
The second and third onset for C+-production are observed at 22.24 ± 0.2 eV and 23.65 ± 0.13 eV, respectively. To the second threshold corresponds the KE-versus-AE straight line (2) in Fig. 3. The linear regression fits with a correlation coefficient of 0.994 and extrapolates to 22.25 ± 0.08 eV with a slope of 0.200 ± 0.013. On the other hand, only two points could be measured to define process (3) in Fig. 3. These two onsets could both be compared to several previous determinations reviewed earlier in this section [3-10]. No appearance energy is reported by Plessis and Marmet [8] in this energy range.
The excess energy of 2.02 ± 0.30 eV between the lowest thermodynamic onset energy of 20.22 ± 0.10 and 22.24 ± 0.20 eV has to be ascribed to vibronic excitation of the methylene radical in its b 1B1 state through
the reaction
where the intermediate state is an excited vinylidene cation which has to lie in the energy range of 22.2-24.2 eV (see straight line 2 in Fig. 3). This energy range fits part of the energy range of the C2H2
+
(C2Σg +
) which corresponds to an 2A1, state in the C2v symmetry group and which could be correlated with the products of
reaction (3).
However, it has to be mentioned that the onset at 22.24 eV could correspond to the vertical excitation of the autoionizing C2H2 Rydberg state [2] converging to the C2H2
+
(C 2Σg +
) state. Its adiabatic excitation energy is 21.5 eV. Though the charge transfer is a non-Franck-Condon process, the threshold energy measured at 22.66 eV by Maier [9] could probably be assigned to the same reaction.
The next dissociative ionization event has an appearance energy at 23.65 ± 0.13 eV, lying at 3.53 ± 0.20 eV above the lowest predicted onset energy. This amount of excess energy corresponds fairly well to the production of C+ and H2 through the reaction
for which an onset is calculated at 23.53 ± 0.20 eV using the data listed in Table 1. This process also would occur at the expense of the C2H2+(C 2Σg+) state for which the vertical and adiabatic ionization energy are
measured at about 23.6 and 22.5 eV, respectively [2]. In this process the cis- as well as the vinylidene structure could be involved.
After an energy gap of 2 eV at least three C+-formation processes are observed implying the production of large amounts of translational energy. Con-trarily, as it has been commented in Section 3, the low energy processes involve no more than 0.4 eV kinetic energy.
The vertical line at 26.45 ± 0.10 eV is followed by the straight line (4) extending from 0.6 to 2.2 eV kinetic energy. This linear fit is characterized by a correlation coefficient of 0.999 and a slope of 0.384 ± 0.007. The extrapolation obtained by drawing the straight line of expected slope 0.54 through the point at KE(C+) = 0.6 eV is 25.38 eV. The thermodynamic onset for reaction (5), i.e.,
is calculated at 25.32 eV (see data in Table 1) in very good agreement with the experimental value. This would be an argument to favour the assignment of reaction (5) to process (4) which spreads over 26.4-30.5 eV. In this electron energy range the PES-spectrum of C2H2 has been measured [22]. A number of ionic states of Σg
-symmetry give rise to avoided crossings [26]. This situation allows the C2H2+ system to evolve along an entirely
repulsive path, giving rise to the release of large amounts of translational energy.
Straight line (5) in Fig. 3 starts at 28.5 ± 0.3 eV electron energy and is related to C+ ions carrying an amount of kinetic energy spread over 0.5-2.4 eV. This linear fit is characterized by a slope of 0.37 ± 0.08 and extrapolates to 27.42 ± 0.11 eV. When a straight line of expected slope 0.54 is drawn through the data points at 28.5 eV the extrapolation is 27.57 ± 0.30 eV. Both extrapolations could be well accounted for by the threshold energy of the dissociative ionization reaction
calculated at 27.44 + 0.20 eV. These fragments are produced with large amounts of kinetic energy, very likely through a mechanism similar to that invoked for reaction (5).
A comparison could only be made with the results of the dissociative excitation experiments of C2H2
giving rise to CI(3s, 1P) emission at 193.1 nm [12] and 165.72 nm [13]. The onset for CI(3s, 1P → 2p2, 1D) emission is measured at 24.4 ± 1.0 eV, to which would correspond a dissociative ionization appearance energy of 28.0 ± 1.0 eV (see data in Table 1). The emission line at 165.7 nm has a threshold at 22.2 ± 0.5 eV [13] which corresponds to an C+ ion production at 25.8 ± 0.5 eV (see data in Table 1).
The last observed C+-producing process shows a vertical line at 29.7 ± 0.1 eV extending to 0.4 eV kinetic energy, where the straight line (6) starts and spreads up to 2.6 eV translational energy. This process is observed between 30.5 and 35.6 eV electron enrgy.
slope of 0.54 drawn through the data points at 29.8 eV for KE(C+) = 0.4 eV extrapolates at 29.0 eV. This result compares favourably with the threshold energy calculated for the reaction
for which the thermodynamical onset is at 28.92 eV. In the energy range covered by this process no data are available on the ionic states which could be involved. It has to be noticed that part of this region of interest lies in the double ionization continuum of C2H2 measured at 32.2 ± 0.2 eV [1].
5.2. The C2 +
dissociative ionization channel
As mentioned in Section 3.2 it has to be kept in mind that the kinetic energy carried by C2+ has been
measured and is KE(C2+) = 0.000 ± 0.010 eV. This means that in the energy balances made below a systematic
uncertainty of 130 meV has to be introduced beside the experimental error sources.
T he lowest onset energy for the appearance of the C2 ion is measured at 18.44 ± 0.07 eV as produced
from C2H2 and at 18.5 ± 0.2 eV as observed from C2D2.
As it has been pointed out earlier, most of the available data concerning C are from electroionization experiments. Excepting the work of Kusch et al. [3], the first onset for C2+ has been reported at 18.2 eV [4], 19.5
eV [6], 18.4 ± 0.3 eV [7], 18.16 ± 0.05 eV [8] and 18.5 eV [10], respectively. The only photoionization mass spectrometric work of Hayaishi et al. [11] reported an appearance energy of 18.1 eV. None of these publications account for kinetic energy measurements. The C2
+
ions are assumed to carry no translational energy at threshold. A fairly large scattering of the measurements has to be noticed also. The present determination is fairly high with respect to the photoionization onset. This could be ascribed to the shape of the first differentiated ionization efficiency curve near threshold (see Fig. 4).
The lowest thermodynamical onset for the production of C2+ from C2H2 would produce C2+ and H2 in
their ground vibronic state through the reaction path
To calculate the onset of this process the sum of the dissociation energies leading to the loss of two H atoms has to be estimated. Assuming the present appearance energy at 18.44 ± 0.07 eV to be accounted for by the reaction (8) and using the data listed in Table 1, a dissociation energy of the ethynyl radical D(C2-H) = 5.44 ±
0.40 eV is obtained. The quoted error value takes into account the possible translational energy content of C2+ .
Estimating this quantity from the photoionization onset [11], i.e., 18.1 eV, this value should be of 5.10 ± 0.23 eV. The quoted error only contains the contribution brought by D(H-C2H) (see Table 1), no error being
mentioned on their measurement by Hayaishi et al. [11]. Wyatt and Stafford [27] measured this dissociation energy directly by high temperature mass spectrometry. They reported a value of D(C2-H) of 120 kcal mol
-1
or 5.20 eV without mentioning any error estimation. Urdahl et al. [28], using laser induced fluorescence, observed the rotational cutoff level of C2 produced by multiphoton dissociation of C2H2. A D(C2-H) = 112 ± 0.8 kcal mol -1
or 4.86 + 0.03 eV is reported. In their negative ion photo-electron spectroscopic work on C2H
in the gas phase, Ervin et al. [29] reported an estimation of D(C2-H) = 117.8 ± 2.6 kcal mol-1 or 5.11 ± 0.11 eV at 298 K.
Recently, the C-H bond dissociation energy in the ethynyl radical has been calculated by Bauschlicher and Langhoff [30] and they reported a value of 112.4 ± 2.0 kcal mol-1. From this short discussion, it should be concluded that the present threshold of 18.44 ± 0.07 eV is overestimated.
The onset energy of C2 +
lies in the range of the adiabatic ionization energy of C2H2 +
(B 2Σu +
) at 18.391 eV [17]. However, the fragments of reaction (8) could only correlate with a 4Σg- state in the D∞h
symmetry. The dissociation pathway could be reached only when the C2H2+-Dxh molecular ion switches to the
C2v symmetry in a 4
B2 state, having e.g. the cis or vinylidenic structure, which could predissociate the ionic state
A second and very reproducible structure is observed at 19.58 ± 0.14 eV in the first differentiated ionization efficiency curve of C2+ (see Fig. 4). The corresponding onset is measured at 19.5 ± 0.3 eV in C2D2.
The only earlier measurement, which could be compared with the present data, has been reported by Bloch [6] who measured the first onset of C2+ at 19.5 eV.
The energy difference of 1.14 ± 0.21 eV between the two lowest appearance energies is too low to be ascribed to the dissociation or electronic excitation of H2. The lowest H2 electronic excitation energy requires
11.638 eV [19]. The most probable interpretation of the onset at 19.58 eV is the production of excited C2+ ions.
Spectroscopic data related to this species are scarce. The most recent quantum mechanical calculations [31,32] agree to predict an a 2Πu and an A
4
Πg states at about 0.82 ± 0.2 and 1.30 ± 0.1 eV above the ground state,
respectively. Most likely, the reaction taking place at 19.58 eV is
Its onset lies in the energy range where the C2H2 +
(B 2Σu +
) is observed. This state could be predissociated through a 2Σg or
4Σ
g state which will correlate with the products of reaction (9) in the C2v symmetry.
The last onset of C2+ observed at 23.00 ± 0.12 eV corresponds to the starting point of a sharp increase in
the first differentiated ionization efficiency curve. This observation is in very good agreement with the mass spectrometric photoionization experiment [11]. It is again noteworthy that the shape of both the photoion yield and the first derivative of the electroionization yield are very similar. This similarity has already been emphazised [1,2,33]. They could be equal under identical resolution conditions. However, the second photoionization threshold for C2
+
is measured at 22.7 eV [11], which is again significantly lower than the result of the present work. This discrepancy, as well as that mentioned for the first onset, has probably to be ascribed to the very smooth increase of the ion yield in the threshold region.
Most of the previous electron impact experiments mention a threshold energy at about 23.5 eV. Several authors reported the first onset of C2+ at 23.8 ± 0.3 eV [3], at 23.3 ± 0.5 eV [5] and at 23.6 eV [7]. Maier
determined the onset to be at 23.3 eV by ion impact [9]. Most of the experiments detected a second threshold at 23.8 eV [6], 22.7 eV [4], 22.6 ± 0.12 eV [8] and 23.0 ± 1.0 eV [10].
By dissociative excitation experiments Beenakker and De Heer [12] determined the emission onset energy for C2(D 1Σ u + -X 1Σg +
) emission at 18.0 + 0.8 eV. On the basis of this threshold and spectroscopic data listed in Table 1, an appearance energy of 24.8 ± 0.8 eV is calculated for the C2+ ion.
Nevertheless, the energy difference between the two appearance energies, 4.56 ± 0.18 eV by the present electron impact work and 4.6 eV by photoionization mass spectrometry [11], are in very good agreement as far as the error could be estimated in the latter experiment. This excess energy with respect to the lowest thermodynamic onset, i.e., 18.1 eV (see data in Table 1) could be ascribed to (i) vibronic excitation of C2+ or (ii)
internal excitation of H2. In the latter case the available amount of excess energy is enough to dissociate the H2
molecule and the minimum energy required for the reaction
is 18.11(± 0.33) + 4.47(8) = 22.59 ± 0.33 eV. The reaction pathway (10) no longer needs to run over a C2v
-symmetry configuration of C2H2+ . As for almost all dissociation channels already investigated in C2H2+ , once
again the C 2Σg+ ionic state is probably involved and predissociated through a 4Σ- state as observed earlier for
CH+ and H+ [1,2].
Concerning the first possible assignment mentioned above, it has to be considered as fairly unlikely owing to the fact that no ionic C2+ state being predicted in the energy range of 4.5 eV [31,32]. No spectroscopic
5.3. The CH2+ dissociative ionization channel
Though the C2H2 is nitrogen-free and in spite of the precautions taken to keep the residual pressure as
low as possible by baking out the vacuum vessel, the m/e = 14 due to CH2 +
is suspected to be contaminated by N+/N2 present in the background mass spectrum. This suspicion will find fairly strong experimental support.
The first onset of CH2+ from C2H2 is measured at 19.74 ± 0.20 eV (see Fig. 6). The corresponding
KE-AE diagram is represented by the straight line (1) in Fig. 7. This linear fit is obtained by linear regression characterized by a correlation coefficient of 0.998. This straight line extrapolates at 19.81 ± 0.04 eV with a slope of 0.45 ± 0.02. The expected coefficient is provided by the ratio (mC2H2-mCH2)/mC2H2 = 12/26 = 0.46. The very
good agreement between experimental and calculated slopes unambiguously means that the excess energy with respect to the onset is entirely converted into translational energy of the fragments.
The thermodynamical onset for the production of CH2+ through the reaction
is calculated at 19.36 ± 0.10 eV (see data in Table 1) which is significantly lower than the appearance energy observed in the present work. This discrepancy is related to the shape of the ion yield curve close to threshold. The photoionization efficiency curve of CH2+, as published by Hayaishi et al. [11], also shows a very smoothly
rising portion at the onset. In this case the threshold determination is not unambiguous. The same observation is valid for the earlier electron impact works [8,10] which report the CH2
+
appearance energy at 19.4 ± 0.12 and 19.0 + 1.0 eV, respectively.
Therefore, the discrepancy between the present determination and previous measurements as well as the calculated onset could be ascribed to well known experimental effects. This discrepancy is particularly large in those cases where, e.g., unresolved vibra-tional fine structure smoothes the ion yield curve in the vicinity of the threshold. Furthermore, the translational energy carried away by CH2+ is measured to be KE = 0.0 eV at
threshold (see Fig. 5). The most probable mechanism should be reaction (11) where all products are produced in the ground electronic and vibrational level. However, at the appearance energy measured in the present work, the production of vibrationally excited CH2+ ions is not excluded.
The appearance energy lies in the energy range where the C2H2 +
(B 2Σu +
) is observed in the He(I) photoelectron spectrum. On the other hand, the CH2
+
product could only come from an isomeric configuration of C2H2
+
. The most simple and best known structure is the vinylidene structure belonging to the the C2v symmetry
group. The products of reaction (11) correlate with 2,4A1, 2,4A2 and 2,4B2 states in this configuration. The B 2Σu+
has already been shown to be predissociated by a Σ state identified as being the C2H2 (A 2Σu+) state [1,2]. This
latter is able to isomerize in the C2v configuration and to correlate with a 2
A1 or a 2
B2 state. On the basis of this
discussion a reasonable mechanism for the production of CH2 +
at 19.74 eV would be
The KE-AE diagram related to this process (see straight line (1) in Fig. 7) extends over 19.7-21.0 eV energy range which covers the B 2Σu+ band as observed in the threshold photoelectron spectrum of C2H2
measured up to 27 eV [2]. This observation would mean that the B 2Σu+ state is predissociated in (and outside,
through autoionization) the whole Franck-Condon region to produce CH2+.
The second appearance energy of the CH2 +
ion is observed at 21.1 ± 0.2 eV. The KE-AE diagram related to this onset is represented by straight line (2) in Fig. 7. The linear fit is obtained by linear regression with a correlation coefficient of 0.992. The slope is 0.40 ± 0.03 and the linear extrapolation to KE(CH2+) = 0.0 eV is
21.17 + 0.05 eV. Using the significance test, the slope would be found between 0.33 and 0.47 with a confidence of 95%. Therefore, it should be concluded that the difference between experimental and expected slope is not significant. The total excess energy with respect to 21.17 eV is entirely converted into translation energy.
The energy difference between the second experimental threshold and (i) the first or (ii) the lowest thermodynamical onset is 1.4 ± 0.4 or 1.7 ± 0.4 eV, respectively. The corresponding difference between the two extrapolated values is 1.29 ± 0.10 eV. The most obvious assignment of this excess energy is the electronic excitation of the C atom in reaction (11) through
The C(3P-1D) excitation energy is 1.264 eV [21]. In the C2v symmetry group these fragments would correlate
with doublet A1 A2, 2B, and B2 states. The straight line (2) extends from 21 to 23 eV electron energy, covering
partially the C2H2+ (C2Σg+) state to which corresponds the 2A1 state in the C2v configuration.
The last two straight lines (3) and (4) drawn in Fig. 7 are related to appearance energies measured above 24 eV electron energy. As already mentioned in Section 3, the signal above 24 eV is firmly suspected to be generated by N+/N2 which has a threshold at 24.3 eV [34]. This energy corresponds almost precisely to the
energy measured in a previous dissociative ionization work, i.e., 24.34 ± 0.12 eV [18] and to the extrapolation value of 24.33 ± 0.05 eV. On the other hand, the slope of the straight line (3) is 0.56, significantly larger than the expected slope of 0.46 (shown in Fig. 7 by a dashed line). For N+/N2 the expected slope should be 0.50. Even
more convincing are the data points related to N+/N2 measured earlier [18] and put in the diagram shown in Fig.
7.
6. Conclusions
The dissociative ionization of acetylene in the C+, CH2 +
and C2 +
dissociation channels has been investi- gated in detail. The discussion of the numerous processes giving rise to these particular species needed to invoke the existence of a transient isomeri-sation mechanism of the molecular ion. The vinyli-dene structure is adequate to describe the behaviour of C2H2 in these three dissociation channels. Essentially the B 2Σu+, the C 2Σg+ and the
higher lying Σ+ states (designations valid for the linear configuration) participate in these processes.
Ion-pair formation processes have been considered, but not brought in the discussion. Calculated onsets for this mechanism are lower than those observed in this work. On the other hand, the production of H-, CH-, C2
-and C2H by ion-pair process has been investigated in detail earlier [35,36]. Within experimental error, none of
the measured thresholds agree with those observed in this work. In fact these processes are of very low cross section and are buried in the "normal" dissociative ionization signal.
Contrarily, the production of H+, C
2H+ and CH+ from acetylene [1,2] could all occur through
dissociation processes where the molecular ion preserves its linear configuration.
Acknowledgements
This work has been supported by the Fonds de la Recherche Fondamentale Collective (FRFC) and the Belgian Government through an Action de Recherche Concertée (ARC). M.D. is indebted to the Belgian Government for a grant. We wish to acknowledge Professor P. Natalis for the critical reading of the manuscript.
References
[1] M. Davister and R. Locht, Chem. Phys. 189 (1994) 805. [2] M. Davister and R. Locht, Chem. Phys. 191 (1995) 333. [3] P. Kusch, A. Hustrulid and J.T. Tate, Phys. Rev. 52 (1937) 843.
[5] F.H. Coats and R.C. Anderson, J. Am. Chem. Soc. 79 (1957) 1340. [6] A. Bloch, Advan. Mass Spectrom. 2 (1963) 48.
[7] J. Momigny and E. Derouane, Advan. Mass Spectrom. 4 (1967) 607. [8] P. Plessis and P. Marmet, Intern. J. Mass Spectrom. Ion Processes 70 (1986) 23. [9] W.B. Maier, J. Chem. Phys. 42 (1965) 1790.
[10] G. Cooper, T. Ibuki, Y. Iida and C.E. Brion, Chem. Phys. 125 (1988) 307.
[11] T. Hayaishi, S. Iwata, S. Sasanuma, E. Ishiguro, Y. Morioka, Y. Iida and M. Nakamura, J. Phys. B 15 (1982) 79. [12] C.I.M. Beenakker and F.J. de Heer, Chem. Phys. 6 (1974) 291.
[13] K.D. Pang, J.M. Ajello, B. Franklin and D.E. Shemansky, J. Chem. Phys. 86 (1987) 2750. [14] R. Locht and J. Schopman, Intern. J. Mass Spectrom. Ion Phys. 15 (1974) 361.
[15] C. Servais, R. Locht and J. Momigny, Intern. J. Mass Spectrom. Ion Processes 71 (1986) 179.
[16] C.E. Moore, Ionization potentials and ionization limits derived from the analyses of optical spectra, NSRDS-NBS 34 (1970). [17] J.E. Reutt, L.S. Wang, J.E. Pollard, D.J. Trevor, Y.T. Lee and D.A. Shirley, J. Chem. Phys. 84 (1986) 3022.
[18] R. Locht, J. Schopman, H. Wankenne and J. Momigny, Chem. Phys. 7 (1975) 393.
[19] K.P. Huber and G. Herzberg, Molecular spectra and molecular structure, Vol. 4. Constants of diatomic molecules (Van Nostrand Reinhold, New York, 1979).
[20] G. Herzberg, Molecular spectra and molecular structure, Vol. 3. Electronic spectra of polyatomic molecules (Van Nostrand, Princeton, 1967).
[21] C.E. Moore, Atomic energy levels, Vol. 1, NBS Circular 467 (Nat. Bur. Stds., Washington DC, 1949). [22] S. Svensson, E. Zdansky, U. Gelius and H. Ågren, Phys. Rev. A 37 (1988) 4730.
[23] P. Rosmus, P. Botschwina and J.P. Maier, Chem. Phys. Letters 84 (1981) 71. [24] G. Frenking, Chem. Phys. Letters 100 (1983) 484.
[25] J. Baker, Chem. Phys. Letters 159 (1989) 447.
[26] J. Müller, R. Arnberg, H. Ågren, R. Manne, P.Å. Malmquist, S. Svensson and U. Gelius, J. Chem. Phys. 77 (1982) 4895. [27] J.R. Wyatt and F.E. Stafford, J. Phys. Chem. 76 (1972) 1913.
[28] R.S. Urdahl, Y. Bao and W.M. Jackson, Chem. Phys. Letters 178 (1991) 425.
[29] K.M. Ervin, S. Gronert, S.E. Barlow, M.K. Gilles, A.G. Harrison, V.M. Bierbaum, C.H. DePuy, W.C. Lineberger and G.B. Ellison, J. Am. Chem. Soc. 112 (1990) 5750.
[30] C.W. Bauschlicher and S.R. Langhoff, Chem. Phys. Letters 173 (1990) 367.
[31] C. Petrongolo, P.J. Bruna, S.D. Peyerimhoff and R.J. Buenker, J. Chem. Phys. 74 (1981) 4594.
[32] P. Rosmus, H.J. Werner, E.A. Reinsch and M. Larsson, J. Electron. Spectry. Relat. Phenom. 41 (1986) 289. [33] R. Locht, J. Momigny, E. Rühl and H. Baumgärtel, Chem. Phys. 117 (1987) 305.
[34] A. Lofthus and P.H. Krupennie, J. Phys. Chem. Ref. Data 6 (1977) 113. [35] R. Locht, Ph.D. Thesis, Université de Liège (1971).