HAL Id: hal-00465178
https://hal-mines-paristech.archives-ouvertes.fr/hal-00465178
Submitted on 19 Mar 2010
HAL is a multi-disciplinary open access archive for the deposit and dissemination of sci-entific research documents, whether they are pub-lished or not. The documents may come from teaching and research institutions in France or abroad, or from public or private research centers.
L’archive ouverte pluridisciplinaire HAL, est destinée au dépôt et à la diffusion de documents scientifiques de niveau recherche, publiés ou non, émanant des établissements d’enseignement et de recherche français ou étrangers, des laboratoires publics ou privés.
Toward a solar climatological database: the HelioClim
project
Mireille Lefèvre, Christelle Rigollier, Sylvain Cros, Lucien Wald
To cite this version:
Mireille Lefèvre, Christelle Rigollier, Sylvain Cros, Lucien Wald. Toward a solar climatological database: the HelioClim project. 22nd EARSeL Annual Symposium ”Geoinformation for European-wide integration”, Jun 2002, Prague, Czech Republic. pp.223-228. �hal-00465178�
Lefèvre M., Rigollier C., Cros S., Wald L., 2003, Toward a solar climatological database: the HelioClim project. In Proceedings of 22nd EARSeL Annual Symposium "Geoinformation for European-wide integration", 4-6 June 2002, Prague, Czech Republic. To-mas Benes editor, Millpress, Rotterdam, Netherlands, pp. 223-228
Toward a solar climatological database: the HelioClim project
M. Lefevre, C. Rigollier, S. Cros & L. Wald
Groupe Télédétection et Modélisation, Ecole des Mines de Paris, Sophia Antipolis, France
Keywords: Remote sensing, Meteosat, solar radiation, climatology
ABSTRACT: The HelioClim project aims at producing temporal series of solar radiation maps at ground level over Europe, Africa and Atlantic Ocean from 1985 up to now. Meteosat satellites images in visible channel and in the reduced resolution B2 format are used to produce this climatological database. The Heliosat II method was selected to convert these images into maps of the global irradiation at ground level. It is an improved version of the original Heliosat method which estimates the global irradiation by comparison of what is observed by the sensor to what should be over that pixel if the sky were clear. The improvements contained in the Heliosat II method consist mostly in a use of a more accurate clear sky model and explicit formulations of the radiance and the transmittance instead of empirical values. A comparison was performed between irradiation values retrieved by this method and measured by ground stations in Europe. A measuring station is not necessarily contained within a B2 pixel and an interpolation method is needed. The accuracy is less than that observed for the high-resolution images because of the smaller number of images and the interpolation process. Nevertheless, the observed relative root mean square error is around 20 %, a very satisfactory result. We conclude that B2 images processed by Heliosat II method gives good results especially for the estimation of daily irradiation or for the irradiation of larger period. They are also able to provide useful data to create a more than fifteen years solar climatological database.
1 INTRODUCTION
Time series of solar radiation available at ground level open the way to many applications for different users. It gives useful data for climatological and meteorological studies. This information help also domains concerned by solar data such as solar energy or photo-chemistry.
The HelioClim project at Ecole des Mines de Paris aims at mapping the solar radiation and its components over Europe, Africa and Atlantic Ocean from 1985 up to now, and subsequently at making these maps available for the different users. To develop such a climatological database of solar radiation, images of the visible channel of the series of Meteosat satellites are used. Once properly
processed, such satellite images can produce maps of solar radiation which are more accurate than those obtained from interpolation of measurements of radiation made at ground level (Perez et al., 1997). For the processing, the Heliosat II method was selected. It is an improved version of the original Heliosat method (Cano et al. 1986, Diabate
et al. 1989). It converts observations made by
geostationnary meteorological satellites into estimates of the global irradiation at the ground level. It is currently one of the most accurate methods presently available.
The high costs involved in acquiring Meteosat data prevented the HelioClim project to use high-resolution images and lead to the purchase of reduced resolution images in B2 format instead. An hourly description of the irradiation would have
necessitated 373,760 images at a cost of several hundreds of thousands of euros. B2 data are made available by Eumetsat at the reproduction cost. Since they are available every 3 hours, the number of purchased images amounts to 46,720.
This paper presents briefly the method Heliosat II. It then presents comparisons with ground measurements which quantify the accuracy of these satellite estimations. Finally, it presents the same study applied to B2 format images and concludes on the possibility of using B2 images to create the solar climatological database.
2 HELIOSAT 2: AN IMPROVED METHOD FOR THE MAPPING OF THE SOLAR RADIATION
The Heliosat method converts observations made by meteorological satellites into estimates of the global irradiation at ground level. The original version was implemented in many places and is routinely used to produce maps. The method Heliosat-II is an improved version.
The principle of the method, as well as most current methods, is that a difference in global radiation perceived by the sensor aboard the satellite is only due to a change in apparent albedo, which is itself due to an increase of the radiation emitted by the atmosphere towards the sensor.
A key parameter is the cloud index n, resulting from a comparison of what is observed by the sensor to what should be observed over that pixel if the sky were clear, which is related to the "clearness" of the atmosphere. In principle, it can be written as:
nt(i,j) = [t(i,j) - tg(i,j) ] / [tcloud- tg(i,j)) ]
where t
(i,j) is the reflectance, or apparent albedo, observed by
the spaceborne sensor for the time t and the pixel (i, j): t
(i,j) =Erreur !, where Lt(i,j) is the observed radiance,
t
cloud(i,j) is the apparent albedo over the brightest clouds,
andt
g(i,j) is the apparent albedo over the ground under
clear skies.
If the sky is clear, the apparent albedo t(i,j) is
close to the apparent albedo over the ground and the cloud index n is close to 0 (possibly negative). If the sky is overcast, the cloud index n is close to 1 (possibly larger). In brief, the cloud index n may be considered as describing the attenuation of the atmosphere (1 minus the transmittance). Thus, the cloud index n is a very convenient tool to exploit satellite images.
The basic principle is not always verified. Other
parameters may intervene, such as multiple cloud layers and dramatic changes in the ground albedo due to the snowfall or the shadow created by a neighbouring cloud. The change in sensor outputs is not necessarily linked to a change in the optical state of the atmosphere or a change in the optical state does not necessarily translate into a change in the cloud index.
The albedos used in the above equation may be constructed from a time-series of satellite images. The optical state of the clear sky is given by a model, often in the form of the global irradiation and its direct and diffuse components and the beam and diffuse transmittances.
Finally, the cloud index n is related to the global irradiation on an hourly (or half-hourly) basis by the means of the clearness index (the ratio of the observed irradiation to the extraterrestrial irradiation for the same day) or the clear-sky index (the ratio of the observed irradiation to the irradiation that should be observed if the sky were clear for the same day). From these hourly irradiations, the daily irradiation can be constructed.
The accuracy gained in the assessment by the method Heliosat-II is mostly gained by the introduction of the ESRA clear-sky model (ESRA 2000; Rigollier et al. 2000) and the Linke turbidity factor. This factor provides a reasonable estimation for the water vapour and aerosols optical effects.
Contrary to the original Heliosat method, the approach adopted for the assessment of the cloud index and, further, of the quantities gand cloud, is
based upon explicit formulations of the radiance and the transmittance. These formulations make use of the modeling of the clear sky radiation, thus offering a strong consistency. This explicit approach offers several advantages. It removes many empirical parameters, compared to the versions of the original method. It makes use of recognized expressions of the radiance and the transmittance. It permits to use known values of the albedo of specific objects, or to estimate such albedoes. Similarly to the method Heliosat-I, the approach does not behave satisfactorily for sun zenithal angles larger than 75 - 78°. Though applicable, it produces larger errors.
From an operational point of view, the method Heliosat-II requests the knowledge of the Linke turbidity factor and the elevation for each pixel of the Meteosat image to be processed. This study demonstrates a posteriori that the Linke turbidity factor is sufficient to describe the optical state of the clear atmosphere in the broadband of the satellites Meteosat. An additional gain in operation is that only one map of the ground albedo is now
necessary, instead of having one map per slot as presently in the most advanced versions of the method Heliosat-I.
3 COMPARISON BETWEEN RETRIEVED VALUES AND STATION MEASUREMENTS A comparison between irradiation values retrieved by the processing of Meteosat images and measured by ground stations is performed. It permits to measure the accuracy of the method Heliosat II. Thirty-five stations from Europe were selected for the comparison. They were selected in flat areas, in order to avoid the specific errors encountered in mountainous areas. These countries are Belgium, France, Germany, Hungary, Norway, Spain and United Kingdom. The meteorological offices provided global hourly irradiation values. These offices perform a screening for quality check. The formats and units were unified before comparison.
Measurements are performed in mean solar time or true solar time. The time of the meteorological measurements is that of the end of the measure. For example, the hourly irradiation at 11 hours is the integral of the irradiance from 10 to 11 hours. The satellite observations are performed in universal time (UT). Consequently, the initial time series of measurements are converted into other time series expressed in universal time. The time for the satellite observation depends upon the position of the site within the field of view; it can be computed exactly knowing the characteristics of the observing system and is expressed in UT. For each meteorological station, knowing its longitude, the universal time of the satellite observation Tsat is
converted into local time tsat. By weighting the two
consecutive irradiation values centred on this local time tsat and by assuming that the irradiance is
constant within the hour, the estimated hourly value in universal time, G*hmeas(Tsat), was computed:
G*hmeas(Tsat) = G*hmeas(tsat) = (t1- tsat+ 0.5) Gh(t1) +
(tsat- t1+ 0.5) Gh(t1+ 1)
where t1and tsatare local time expressed in hours, t1
= Round(tsat), and Round is the rounding operator
such as (Round(10.4)=10; Round(10.5)=11 etc.). The time series of estimated measurements G*hmeas(Tsat) are hereafter considered as actual
measurements.
Only were used the measurements of hourly irradiation greater than 10 Wh m-2. This value corresponds to the level of diffuse hourly irradiation for the sunset and sunrise under clear-sky at 60° N in Norway. For these hours of very
low solar elevation, the measured irradiation is mainly of diffuse nature and is influenced by local conditions, including orography and the presence of nearby obstacles. By removing these values, we ensure better conditions for the validation process.
The satellite data are high resolution images covering Europe and brought to the infrared resolution, that is 5 km at nadir. They are available every half-hour, from July 1994 to June 1995. We used only the images acquired for even slots. The satellite data were processed using the method Heliosat-II. Estimates of the global hourly irradiation were thus obtained. Only the estimates, for which the solar zenithal angle is lower than 78°, were kept for the comparison, as it has been said that the description of the physical processes is not valid below that limit.
Three months were used for the comparison: January 1995, April 1995 and July 1994. From each data set of hourly irradiation, and for a given month, the daily irradiation was computed as follows.
For the station measurements, we sum up all the hourly irradiations greater than 10 Wh m-2. The estimate is said valid if at least N hourly irradiations are used in the computation. N is equal to 6 in January and April and to 12 in July. For the high resolution images, we use the above-described algorithm. The estimate is said valid if at least N hourly irradiations are used in the computation. For each hourly irradiation, the mean solar elevation should be greater than 12°. N is equal to 5 in January and April and to 8 in July.
Given the two time-series, and for all stations together, we compute the difference (measured -estimated) in several ways:
for hourly irradiation for a given month, for all the hours, for the monthly mean of hourly irradiation for a given
hour, for all hours,
for daily irradiation for a given month, for all the days, for the monthly mean of daily irradiation,
for the cumulative of the daily irradiation during 5 days (5-days irradiation). Only are kept 5-days estimates, which are made from at least 3 daily estimates (60 %), for the cumulative of the daily irradiation during 10 days
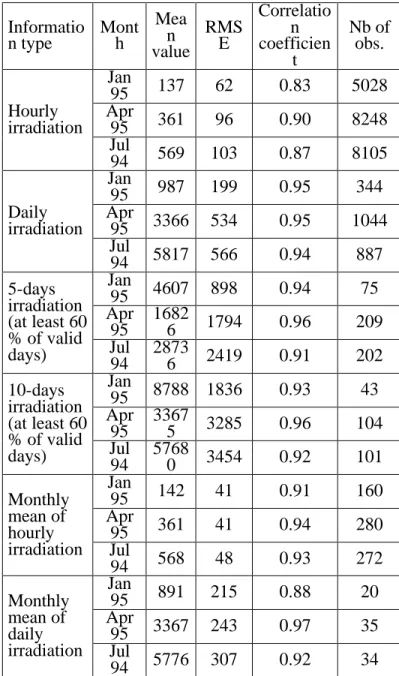
(10-days irradiation). Only are kept 10-days estimates, which are made from at least 6 daily estimates (60 %). For each parameter, the differences have been computed and are summarized in the Table 3.1 below. The bias is usually useful for assessing the accuracy. For example, it ranges from 23 Wh m-2in July 1994 to -10 in January 1995. However, it strongly depends upon the selected stations and the selected period and has no great statistical
significance in this context because the field is not stationary. Consequently, only the RMSE is dealt with in the following. This parameter is more stable.
The results are good compared to the expected accuracy for the Heliosat-II method. The correlation coefficient is high in all cases. The accuracy shows a relative increase of approximately 30 % compared to that observed with the Heliosat-I method.
Table 3.1 shows a problem with the low sun elevations. This appears in the comparison of the hourly and daily irradiations. The method Heliosat-II does not behave well in these cases. It implies that the relative error is greater in January, when the frequency of low sun elevations is greater and the mean hourly irradiation is low, than in July. To assess better the influence of these cases, we introduce the estimates made for any sun elevation, without any constraint, in the comparison with ground measurements. This study confirms that the quality of the assessment decreases as the sun elevation decreases.
However, it is possible to remove the constraint on the sun zenithal angle if necessary, still keeping an acceptable accuracy. Removing this constraint, or decreasing the threshold, leads to a larger number of estimates, which may be useful.
Informatio n type Month Mea n value RMS E Correlatio n coefficien t Nb of obs. Hourly irradiation Jan 95 137 62 0.83 5028 Apr 95 361 96 0.90 8248 Jul 94 569 103 0.87 8105 Daily irradiation Jan 95 987 199 0.95 344 Apr 95 3366 534 0.95 1044 Jul 94 5817 566 0.94 887 5-days irradiation (at least 60 % of valid days) Jan 95 4607 898 0.94 75 Apr 95 1682 6 1794 0.96 209 Jul 94 2873 6 2419 0.91 202 10-days irradiation (at least 60 % of valid days) Jan 95 8788 1836 0.93 43 Apr 95 33675 3285 0.96 104 Jul 94 5768 0 3454 0.92 101 Monthly mean of hourly irradiation Jan 95 142 41 0.91 160 Apr 95 361 41 0.94 280 Jul 94 568 48 0.93 272 Monthly mean of daily irradiation Jan 95 891 215 0.88 20 Apr 95 3367 243 0.97 35 Jul 94 5776 307 0.92 34 Table 3.1 Differences between measured and estimated values in Wh m-2
4 ACCURACY OF THE RETRIEVAL OF IRRADIATION VALUES FROM METEOSAT IN B2 FORMAT
As said previously, high resolution images will not be used for the construction of the solar climatology because of their high cost. Reduced resolution data are used instead in the ISCCP-B2 format. This format was set up in the framework of the International Satellite Cloud Climatology Project (ISCCP) (Schiffer, Rossow, 1983, 1985) part of the World Climate Research. This set is derived from the operational Meteosat images, in both visible and thermal infrared bands. The B2 reduced resolution set is produced according to the following steps:
first, a time sampling of geostationnary images reduces the frequency of observation to synoptic three hours intervals, starting at 0000 Universal Time (UT),
second, the higher resolution visible channel data (images of 5000*5000 pixels) are averaged to match the lower resolution of infrared channel data. This gives an image of 2500*2500 pixels instead with a resolution of 5 km, third, overlapping image pixels are removed,
fourth, spatial sampling of images is performed to reduce the apparent resolution to approximately 30 km at nadir by taking 1 pixel over 6 in each direction. The value of the corresponding B2 pixel is given by the radiance of the south-eastern most pixel in a 6*6 pixels square.
The images B2 are formed by pixels that are effectively pixels of original size (i. e. 5 km) but with a sub-sampling of 6 in each direction. This means that a B2 pixel is not an average of say, 30 * 30 km2, but is a pixel of 5 km in size, which represents an area of 30 km x 30 km (figure 4.1).
5 km
30 km at nadir
Figure 4.1. Scheme showing the sub-sampling in the B2 format.
The same comparisons with ground measurements as above were performed but now with the estimates derived from these images in B2 format. The same parameters than above are computed. The construction of daily irradiation is as for the high resolution images, but the number N of hourly irradiations should be greater than or equal to 2 in January and April and 3 in July. The comparisons present in this case an additional problem: a measuring station is not necessarily contained within a B2 pixel. An interpolation method is requested to estimate locally the irradiation from irradiations computed at the surrounding B2 pixels. A comparison between several method was performed by Iehle et al. (1997) and they recommended the nearest-neighbour technique. The results strongly depend upon the relevance of the selected technique to the local spatial properties of the irradiation. The smoother the field, the better the assessment by the nearest-neighbour technique. In case of high spatial variations, the technique will be inappropriate as most of the standard ones. Given the properties of the areas under concern this work, the results should be regarded as the typical accuracy that can
be achieved. Lower accuracy will be find in cases of large variations in orography or juxtaposition of local climate.
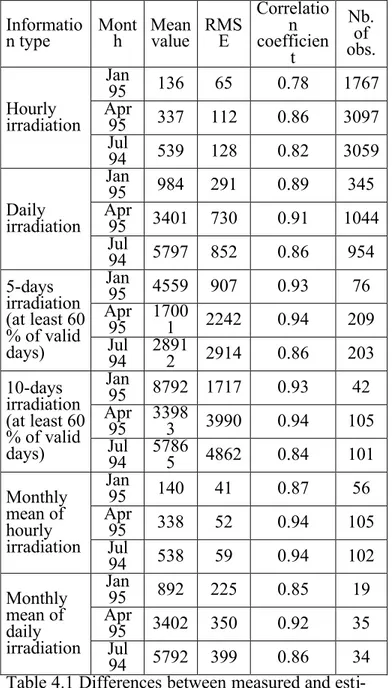
The accuracy observed by comparisons with ground measurements is really satisfactory. The correlation coefficient is high in all cases (Table 4.1).
Nevertheless the accuracy is less than that observed for the high resolution images. The degradation of the accuracy comes from both the smaller numbers of images available for the B2 format to construct a daily integral, and the interpolation process.
We performed an analysis of the influence of the difference in the number of images used to compute the daily irradiation. For this purpose, we used only the high resolution images. The daily irradiation was computed by using the nine possible slots on the one hand, and the B2 slots taken every 3 hours (0000 UT, 0300 UT, 0600 UT ...) on the other hand. Of course, there are discrepancies, which are approximately half of the differences observed between Tables 3.1 and 4.1. The larger the number of images, the more accurate the retrieval. Then, still using the high resolution images, we compare the satellite estimates of the daily irradiation for the true pixel and for the simulated B2 pixel. We observed that the gap in space between the measuring station and the B2 pixel has as much influence as the weak number of images for computing daily irradiation.
Informatio
n type Month Mean value RMSE
Correlatio n coefficien t Nb. of obs. Hourly irradiation Jan 95 136 65 0.78 1767 Apr 95 337 112 0.86 3097 Jul 94 539 128 0.82 3059 Daily irradiation Jan 95 984 291 0.89 345 Apr 95 3401 730 0.91 1044 Jul 94 5797 852 0.86 954 5-days irradiation (at least 60 % of valid days) Jan 95 4559 907 0.93 76 Apr 95 1700 1 2242 0.94 209 Jul 94 28912 2914 0.86 203 10-days irradiation (at least 60 % of valid days) Jan 95 8792 1717 0.93 42 Apr 95 33983 3990 0.94 105 Jul 94 5786 5 4862 0.84 101 Monthly mean of hourly irradiation Jan 95 140 41 0.87 56 Apr 95 338 52 0.94 105 Jul 94 538 59 0.94 102 Monthly mean of daily irradiation Jan 95 892 225 0.85 19 Apr 95 3402 350 0.92 35 Jul 94 5792 399 0.86 34 Table 4.1 Differences between measured and esti-mated values in Wh m-2 for B2 images.
These results demonstrate clearly that the method Heliosat II may apply to the images in B2 format with a satisfactory accuracy. The B2 images may even be used to assess the hourly irradiation. However, given the poor sampling in time of these images, it may be recommended to limit their use to the assessment of daily irradiation or to the irradiation for larger periods.
5 CONCLUSION
In this paper, we evaluated the accuracy of the Heliosat-II method to estimate solar irradiation at the ground level using comparisons with ground measurements. The quality of estimations are proven for the high resolution images from the visible channel Meteosat satellite. The use of B2 images gives also good results especially for the estimation of daily irradiation or for the irradiation
for larger periods. Even with their low resolution in time and in space, B2 images are able to provide useful informations to create a solar climatological database. HelioClim project will be able to make a more than fifteen years time series of solar
irradiation maps of Europe, Africa and Atlantic ocean. This will constitute a unique database in that type of solar information.
References:
Cano D., Monget J.M., Albuisson M., Guillard H., Regas N., and Wald L., 1986, A method for the determination of the global solar radiation from meteorological satellite data, Solar Energy, 37, 31-39.
Diabat€ L., Moussu G., Wald L., 1989, Description of an operational tool for determining global solar radiation at ground using geostationary satellite images, Solar Energy, 42, 201-207. ESRA, European solar radiation atlas, 2000.
Fourth edition, includ. CD-ROM. Edited by J. Greif, K. Scharmer. Scientific advisors: R. Dogniaux, J. K. Page. Authors: L. Wald, M. Albuisson, G. Czeplak, B. Bourges, R. Aguiar, H. Lund, A. Joukoff, U. Terzenbach, H. G. Beyer, E. P. Borisenko. Published for the Commission of the European Communities by Presses de l’Ecole, Ecole des Mines de Paris, Paris, France.
Iehl€ A., Lef‚vre M., Bauer O., Martinoli M., and Wald L., 1997, Meteosat: A valuable tool for agro-meteorology, Final report for the European Commission, Joint Research Centre, Ispra, Italy. Perez R., Seals R., Zelenka A., 1997, Comparing
satellite remote sensing and ground network measurements for the production of site/time specific irradiance data, Solar Energy, 60, 89-96. Rigollier C., Wald L.,1998, Towards operational
mapping of solar radiation from Meteosat images, In Proceedings of the EARSeL conference: Operational remote sensing for sustainable development, May 11-14 1998, Enschede, The Netherlands.
Rigollier C., Bauer O., Wald L., 2000, On the clear sky model of the 4th European Solar Radiation Atlas with respect to the Heliosat method, Solar
Energy, 68 (1), 33-48.
Schiffer, R.A. and Rossow, W.B., 1983, The International Satellite Cloud Climatology Project (ISCCP): The first project of the World Climate Research Programme. Bulletin American Meteorological Society, 64, 779-784.
Schiffer, R.A. and Rossow, W.B., 1985, ISCCP global radiance data set: A new resource for climate research. Bulletin American Meteorological Society, 66, 1498-1503.