Tweeting biomedicine: an analysis of tweets and citations in the biomedical literature
Stefanie Haustein1, Isabella Peters2, Cassidy R. Sugimoto3, Mike Thelwall4, & Vincent Larivière5
1 stefanie.haustein@umontreal.ca
École de bibliothéconomie et des sciences de l’information, Université de Montréal C.P. 6128, Succ. Centre-Ville, Montréal, QC. H3C 3J7 (Canada) and
Science-Metrix Inc., 1335 Avenue du Mont-Royal E, Montréal, Québec H2J 1Y6, (Canada)
2 isabella.peters@hhu.de
Institute for Language and Information, Department of Information Science, Heinrich Heine University, Universitätsstr. 1, 40225 Düsseldorf (Germany)
3 sugimoto@indiana.edu
School of Informatics and Computing, Indiana University Bloomington 1320 E. 10th St. Bloomington, IN 47401 (USA)
4 m.thelwall@wlv.ac.uk
School of Technology, University of Wolverhampton, Wulfruna Street, Wolverhampton WV1 1LY (UK)
5 vincent.lariviere@umontreal.ca
École de bibliothéconomie et des sciences de l’information, Université de Montréal C.P. 6128, Succ. Centre-Ville, Montréal, QC. H3C 3J7 (Canada) and
Observatoire des sciences et des technologies (OST), Centre interuniversitaire de recherche sur la science et la technologie (CIRST), Université du Québec à Montréal
CP 8888, Succ. Centre-Ville, Montréal, QC. H3C 3P8, (Canada)
Abstract
Data collected by social media platforms have recently been introduced as a new source for indicators to help measure the impact of scholarly research in ways that are complementary to traditional citation-based indicators. Data generated from social media activities related to scholarly content can be used to reflect broad types of impact. This paper aims to provide systematic evidence regarding how often Twitter is used to diffuse journal articles in the biomedical and life sciences. The analysis is based on a set of 1.4 million documents covered by both PubMed and Web of Science (WoS) and published between 2010 and 2012. The number of tweets containing links to these documents was analyzed to evaluate the degree to which certain journals, disciplines, and specialties were represented on Twitter. It is shown that, with less than 10% of PubMed articles mentioned on Twitter, its uptake is low in general. The relationship between tweets and WoS citations was examined for each document at the level of journals and specialties. The results show that tweeting behavior varies between journals and specialties and correlations between tweets and citations are low, implying that impact metrics based on tweets are different from those based on citations. A framework utilizing the coverage of articles and the correlation between Twitter mentions and citations is proposed to facilitate the evaluation of novel social-media based metrics and to shed light on the question in how far the number of tweets is a valid metric to measure research impact.
Introduction
Data from social media platforms have recently been exploited to measure early impact or types of research impact for scholarly publications in ways that complement traditional citation-based indicators. So-called “altmetrics” (Priem, 2010; Priem, Costello, & Dzuba, 2011) reflect, primarily, activity in social media environments with the purpose of gathering previously invisible traces of scholarly impact. Activities on platforms such as Mendeley, CiteULike, ResearchGate, Academia.edu, LinkedIn, Facebook, and Twitter can be tracked to rapidly monitor the manner in which scholarly documents are disseminated and discussed (Li, Thelwall, & Guistini, 2012; Piwowar, 2013; Priem & Costello, 2010). Studies of the role of social media in scholarly communication have investigated their use in diffusion (Darling, Shiffman, Côté, & Drew, 2013), conference chatter (Weller, Dröge, & Puschmann, 2011), crowdsourcing (Ogden, 2013), science popularization (Sugimoto & Thelwall, 2013), and promotion of scholarly products (Cronin, 2013; Nature Chemistry, 2013). New tools to facilitate the use of altmetrics have been introduced (e.g., Kaur, Hoang, Sun et al., 2012), research councils are encouraging the use of altmetrics for evaluative purposes (e.g., Viney, 2013), and scholars are arguing for inclusion of altmetrics on curricula vita (Piwowar & Priem, 2013). However, large-scale studies of altmetrics are rare, and systematic evidence about the reliability, validity, and context of these metrics is lacking (Wouters & Costas, 2012; Liu & Aidle, 2013). Furthermore, we lack evidence about the actors and stakeholders in both the creation and consumption of these metrics.
To further this conversation, we examine the extent to which biomedical papers are represented on Twitter and the relationships between tweets and citations for these papers. We select Twitter as one of the most popular social media websites, claiming over 200 million active users in March of 2013 (Wickre, 2013). While scientometric analyses have typically focused on measuring scholarly communication in a closed community of researchers who read, cite, and publish, altmetrics claim to capture impact measures from a broader audience. Studies are needed to systematically examine the integration of social media sources into scholarly communication, how far researchers (or other stakeholders such as science journalists, public outreach officers, journal publishers) use them to communicate research results and which audiences they target (e.g., the scientific community or an interested public). Given that tools such as Altmetric.com and ImpactStory.orgi provide easy access to altmetrics, a systematic study of the meaning and validity of altmetrics as indicators of scholarly and/or public impact is both timely and appropriate. This paper contributes to the assessment of altmetrics by evaluating the use and discussion of biomedical publications on Twitter from a quantitative point of view.
Only a handful of studies have examined Twitter use among scholars (Priem & Costello, 2010; Weller, Dröge, & Puschmann, 2011), but most of these have concluded that Twitter is not considered a particularly important tool for scholarly dissemination. Although Thelwall, Haustein, Larivière, & Sugimoto (2013) found that Twitter data were more extensive than that from other social media sources, social media usage does not contribute to a scholar’s reputation (Cruz & Jamias, 2013). Less than 10% of researchers take advantage of microblogging (Rowlands, Nicholas, Russell, Canty, & Watkinson, 2011), and a mere 2.5% of scientists are active on Twitter (Priem et al., 2011).ii This latter figure contrasts sharply with the 2011 estimate by eMarketer (2011) that 8.7% of the adult US population was active on Twitter. This difference might be due to the divergence of various user groups on Twitter—for example, it is common to use Twitter for complaining about newly bought products (Jansen, Zhang, Sobel, & Chowdury, 2009). In addition, the different age distribution of scholars and the general population may be a factor. However, when scholars
tweet, nearly 50% of their tweets are related to scholarly communication (Holmberg & Thelwall, 2013; Chretien et al., 2011).
When tweeting, users apply several communicative devices including hashtags, directed @messages, and retweets (boyd, Golder, & Lotan, 2010). Weller and Peters (2012) suggested that retweets should be considered to be “internal citations,” whereas “external citations” appear when Twitter users link to outside information (such as links to particular websites or documents). Various other terms have been proposed to describe scholars’ use of Twitter in referencing scholarly publications, including “tweetations” (Eysenbach, 2011) and “citation tweets” (Priem & Costello, 2010). Twitter can be a powerful tool for sharing pointers (i.e. links) to information (boyd et al., 2010; Suh, Hong, Pirolli, & Chi, 2010). Interestingly, tweets are more likely to be retweeted when they contain links. This aspect has already been recognized by scholars and is now used for popularizing tweets with scientific content: Nearly a third of scientists’ tweets contain URLs (Peters, Beutelspacher, Maghferat, & Terliesner, 2012), compared to only 22% for the general population of tweets (boyd et al., 2010). According to Priem and Costello (2010), 6% of 2,322 tweets with URLs published by scientists forwarded users to scholarly publications, either directly or via different channels such as websites, while in Holmberg and Thelwall’s (2013) sample of scientists’ tweets it was 2.2%. The highest proportion of tweets containing URLs (55%) was found by Weller and Puschmann (2011), whose study population consisted of approximately 600 academic users. The proportion of scientists’ tweets containing links can vary between disciplines (62% to 75%; Holmberg & Thelwall, 2013). The most common link destinations are blogs, advanced Twitter services (e.g., Twitpiciii), or other media outlets, such as newspapers or video sharing platforms (Holmberg & Thelwall, 2013; Peters et al., 2012; Weller & Puschmann, 2011; Weller et al., 2011). The degree to which traditional scholarly practices are reflected in Twitter use (e.g., citing scientific papers in tweets or referencing via links) is key to understanding the involvement that scholars have with Twitter as a dissemination tool. A large-scale study that systematically evaluates the degree to which scholarly articles are distributed on Twitter is lacking.
The aim of this study is to analyze the extent to which biomedical publications are mentioned on Twitter by evaluating the share of tweeted documents and the average number of tweets per article by discipline, specialty, and journal. Twitter provides an opportunity to evaluate a rapid dissemination vehicle differentiating it from citations, which take much longer to accumulate. We selected biomedicine as the domain for two reasons. The first is the early adoption of social media tools generally, and Twitter, in particular, into the work of practicing physicians (Berger, 2009; Cohen, 2009; Parker-Pope, 2009). This adoption has resulted in modifications to the American Medical Association’s code of ethics to include policies on social media use. As argued by Chretien, Azar, and Kind (2011, p. 566), “the existence of social media is transforming way physicians communicate with the public”; however, it is not clear whether this transformation applies to biomedical researchers as well as practitioners. A demonstrated incentive for this exists, as some studies have shown that papers with complementary knowledge diffusion obtain higher citations rates (Gargouri, et al., 2010; Henneken & Accomazzi, 2011; Lippi & Favaloro, 2012; Mounce, 2013).
The results of our research can be used as a starting point for additional analyses in order to determine how, why, by whom, and to whom scholarly documents are tweeted. The present study analyzes those tweets that mention at least one of the 1.4 million scholarly documents indexed in PubMed. The following research questions, divided into three areas, are investigated:
1) Twitter coverage of biomedical papers (PubMed):
a. What proportion of articles, journals, specialties and disciplines indexed in PubMed are mentioned on Twitter?
b. Which PubMed journals, specialties and disciplines are tweeted most frequently?
2) Twitter impact of biomedical papers:
a. What is the average number of tweets per article, journal, specialty and discipline?
b. What is the relationship between the coverage of Twitter and the number of tweets per article?
3) Comparison of tweets and citation metrics for biomedical papers:
a. Does citation behavior on Twitter resemble citation behavior of scholars? Do tweet counts and citations correlate?
Methods
Data. The dataset analyzed comprises all articles and reviews indexed in PubMed as well as in the Web of Science (WoS). This combined dataset represents the core of the biomedical literature for the 2010 to 2012 period. The link between PubMed and WoS allowed for the calculation of the number of citations received by each article. This resulted in a set of 1,431,576 documents. Citations covered those received until the end of 2012 providing different lengths of citation windows depending on the publication year of the article: that is, articles published in 2010 had more time to accumulate citations. Tweet counts for PubMed articles were are based on a previous study by Thelwall et al. (2013) and obtained from Altmetric.com, which monitors social media mentions from various sources. The tweets were retrieved by Altmetric.com between July 2011 and December 2012 and were limited to those tweets published during that time that contained a unique identifier (e.g., a PMID, a Digital Object Identifier [DOI], or a URL associated with a scholarly publisher’s website) referring to the PubMed documents published during the 2010 to 2012 period. Search results are verified by cross-checking metadata from links in tweets with bibliographic information of scholarly documents.
Analysis. The first set of analyses focused on the degree to which articles found in both PubMed and WoS were tweeted, examining the degree to which articles were cited including variations over time. For this analysis, all 1.4 million documents were used. Twitter citation rates, that is, the mean number of tweets per article, were calculated and the distribution of tweets over articles is presented. The 15 most frequently tweeted articles are listed.
The second set of analyses focused on the 5,251 journals which were represented in the set of 1.4 million documents. Of these, 4,215 were tweeted at least once (80%). However, the PubMed coverage was extremely low for some of the journals, as only some of their papers were relevant to the biomedical field, (e.g., Cartographic Journal, Language & Communication, Italian Studies, Scottish Journal of Political Economy). Therefore, the sample for the journal analysis was limited to those journals which had 1) at least 30 papers indexed in PubMed and: 2) either a) 100 articles or reviews indexed in Web of Science between 2010 and 2012, or b) at least 70% of the total articles for that journal covered in PubMed. This selection thus excludes journals with too few papers for reliable statistics and those with low coverage in PubMed. The exclusion process left 3,812 journals. The percentage of tweeted documents (here called “Twitter coverage”, P%tweeted) and the mean number of tweets per tweeted article (called “Twitter citation rate”, T/Ptweeted) was calculated. Spearman correlations were calculated between Twitter citation rates of journals and
traditional bibliometric journal indicators (i.e., Impact Factor, Eigenfactor, Article Influence score, and Immediacy Index) on the journal level.
The last set of analyses evaluated Twitter use on the level of disciplines and specialties. The 1.4 million documents were classified using the NSF journal classification system. Results are shown for only those specialties where PubMed coverage exceeded 50% in order to guarantee representativeness of the particular specialty. Similar to the journal level analysis, Twitter citation rates and Twitter coverage were calculated on the level of disciplines and specialties. Additionally, the relationship between tweets and citations was examined. The most common means of identifying the relationship between two metrics is to determine the statistical correlation between them. This has been a common approach in scientometrics, in validating new metrics, by examining the degree to which they relate with previously accepted metrics. However, as suggested by Thelwall and colleagues (2013), correlation coefficients might not be suitable for comparing altmetric and citation indicators for documents published in different time periods, as the analysis can be biased by citation delays and changes in social media use. The correlations in Table 1 confirm these biases, as Spearman’s ρ is highest for articles published in 2011, where both biases are smallest. Therefore, only articles published in 2011 were used for the correlation analysis.
The top 25 journals according to Twitter citation rate, i.e., the most tweets per article on average, are listed together with information on official Twitter accounts, i.e. number of tweets and followers. This information was manually collected by Google and Twitter searches in April 2013. Number of followers and tweets were also collected for the 13 journals with Twitter coverage above 50%.
Table 1. Statistics and Spearman correlation of number of tweets (T) and citations (C) per document
and year of publication (2010 to 2012) for papers which were mentioned on Twitter at least once (134,929 of the 1,431,576 PubMed articles).
N Spearman's ρ Mean Median Max.
T2010 13,763 .104** 2.1 1 237 C2010 18.3 7 3,922 T2011 63,801 .183** 2.8 1 963 C2011 5.7 2 2,300 T2012 57,365 .110** 2.3 1 477 C2012 1.3 0 234 T2010-2012 134,929 .114** 2.5 1 963 C2010-2012 5.1 1 3,922
** Correlation is significant at the 0.01 level (2-tailed).
Limitations. Replication is a key principle of scientific research. Altmetric research faces many hurdles in this regard. First, data providers may change or become obsolete quickly, making replications impossible (Liu & Aidle, 2013). Moreover, it is still difficult if not impossible to collect complete data if no direct link (i.e., URL, PMID or DOI) between research results and their mention in other publications (e.g., videos or newspaper articles) is given; in addition, many versions of one research paper are available on the Web (see also the notion on identity resolution in Buschman and Michalek [2013]). Accordingly, research on altmetrics must find ways to combine all available versions of a document in order to form reliable indicators. We relied on the tweet counts computed by Altmetric.com which are obtained through searches based on multiple document identifiers (see Methods section). Beside the technical problems associated with collecting altmetrics, there is another crucial
factor associated with their use in the evaluation of authors, papers, journals, or disciplines: the critical mass of both available documents and users contributing to the data.
A general problem of social media-based analyses is that of data reliability. Although most social media services provide APIs to make usage data accessible, we still do not know if it is possible to collect every tweet, if there are missing data, or what effects download or time restrictions have on available data. In addition, the Altmetric coverage of Twitter may be incomplete due to technical issues, such as server or network downtime. Moreover, an article may be tweeted in a way that is not easily automatically identified (e.g., "See Jeevan's great paper in the current Nature!"). Due to these limitations, we assume that our findings on coverage and usage of medical documents on Twitter are rather conservative. However, we also believe that the aforementioned limitations are likely to affect all journals, specialties, and disciplines in broadly the same way, even though individual journal issues might be disproportionately affected if they were published at the time of an a service outage with the result that an initial surge of tweets at the time of publication may have been missed.
Results
Articles. 9.4% (134,929 of the 1,431,576 documents) of the PubMed/WoS articles were tweeted at least once. There was significant variation by time: 2.4% of the papers published in 2010 were tweeted at least once, 10.9% in 2011; and 20.4% of the articles published in 2012 received at least one tweet. There were 340,751 tweets mentioning 134,929 unique articles, providing a global Twitter citation rate of 2.5 (0.2 including untweeted documents). The distribution of tweets per document is positively skewed, with 63.0% of documents only mentioned once. The most frequently tweeted document was mentioned 963 times (Table 2). The 15 most frequently tweeted papers are shown in Table 2. These mostly appeared in general science journals such as Nature, Science, PNAS or prestigious medical journals such as the New England Journal of Medicine and Lancet. Articles from some specialized journals were also frequently tweeted. An attempt to classify these articles as regards their topics and potential reasons for being so popular on Twitter shows that the documents are curious or funny (e.g., rank #7; #11 in Table 2), has potential health applications (#5; #6) or refers to a catastrophe such as the two most frequently tweeted articles: the article by Hess and colleagues (#1) describes the genetic alterations caused by the Chernobyl accident and was published in May 2011 shortly after Fukushima, making the subject even more topical, and the paper by Yasunari and colleagues (#2) analyzes the soil contamination in Japan caused by Fukushima. The articles by Newman and Feldman (#8) and Mottron (#12) are examples of topics that concern the whole scholarly community, i.e. Open Access and a group of researchers with autism.
Table 2. The 15 most frequently tweeted articles.
Bibliographic information Journal Number of tweets Rank
Hess et al. (2011). Gain of chromosome band 7q11 in papillary thyroid carcinomas of young patients is associated with exposure to low-dose irradiation
PNAS 963 #1
Yasunari et al. (2011). Cesium-137 deposition and contamination of Japanese soils due to the Fukushima nuclear accident
PNAS 639 #2
Sparrow et al. (2011). Google Effects on Memory: Cognitive Consequences of Having Information at Our Fingertips
Onuma et al. (2011). Rebirth of a Dead Belousov– Zhabotinsky Oscillator
Journal of Physical
Chemistry A 549 #4
Silverberg (2012): Whey protein precipitating moderate
to severe acne flares in 5 teenaged athletes Cutis 477 #5 Wen et al. (2011). Minimum amount of physical activity
for reduced mortality and extended life expectancy: a prospective cohort study
Lancet 419 #6
Kramer (2011). Penile Fracture Seems More Likely During Sex Under Stressful Situations
Journal of Sexual
Medicine 392 #7
Newman & Feldman (2011). Copyright and Open Access at the Bedside
New England Journal of Medicine
332 #8 Reaves et al. (2012). Absence of Detectable Arsenate in
DNA from Arsenate-Grown GFAJ-1 Cells Science 323 #9 Bravo et al. (2011). Ingestion of Lactobacillus strain
regulates emotional behavior and central GABA receptor expression in a mouse via the vagus nerve
PNAS 297 #10
Park et al. (2012). Penetration of the Oral Mucosa by Parasite-Like Sperm Bags of Squid: A Case Report in a Korean Woman
Journal of
Parasitology 293 #11 Mottron (2011). Changing perceptions: The power of
autism Nature 274 #12
Villeda et al. (2012). The ageing systemic milieu
negatively regulates neurogenesis and cognitive function Nature 271 #13 Merchant et al. (2011). Integrating Social Media into
Emergency-Preparedness Efforts
New England Journal of
Medicine 267 #14
Ho et al. (2011). A Low Carbohydrate, High Protein Diet Slows Tumor Growth and Prevents Cancer Initiation
Cancer Research 261 #15
Journals. Of the 3,812 journals meeting the thresholds (see Methods section) 3,725 (97.7%) had at least one tweeted publication. The mean number of tweets per journal is 88.7. The most frequently tweeted journal is Nature, with 13,430 tweets linking to its articles (Table 3). With 41.9 tweets per document, the journal with the highest mean Twitter citation rate is Cutis. As can be seen in Figure 1, which shows Twitter citation rate and coverage for the 3,725 journals with at least one tweet, the majority of journals (67.4%) have had less than 20% of their content tweeted and were tweeted less than twice per tweeted document.
One possible artifact could arise from journals employing someone to tweet their own material. To investigate this, we visited the journal home page for those 13 journals with Twitter coverage above 50% and found that 9 of these had an official Twitter account and the remaining four were represented by the official Twitter accounts of their respective publishers or affiliated societies.
As the data show, an official Twitter publication policy does not necessarily lead to a higher active uptake and redistribution of articles by Twitter users. The Journal of Addiction Medicine (P%tweeted=85.1%; T/Ptweeted=1.7), Current Opinion in Endocrinology (74.3%; 1.1), Ultrasound Quarterly (67.6%; 1.1), Simulation in Healthcare (65.6%; 1.5), Clinical Obstetrics and Gynecology (64.7%; 1.1), Psychosomatic Medicine (63.4%; 1.8), Current Opinion in Cardiology (61.2%; 1.1), Journal of Nursing Administration (58.0%; 1.3), Cardiology Review (55.6%; 1.2) and the European Heart Journal-Cardiovascular Imaging
(51.7%; 1.6) had more than half of their content tweeted but overall the journals are tweeted less frequently than average. The exceptions among those with high coverage are Palliative Medicine (67.9%), the British Dental Journal (60.4%) and Homeopathy (52.4%), with Twitter citation rates of 4.6, 3.2 and 6.1, respectively. With a high Twitter coverage and Twitter citation rates above average, these three journals are both broadly and intensely distributed on Twitter.
Figure 1. Percentage of tweeted articles (Twitter coverage) and mean number of tweets per tweeted
article (Twitter citation rate) for 3,725 journals.
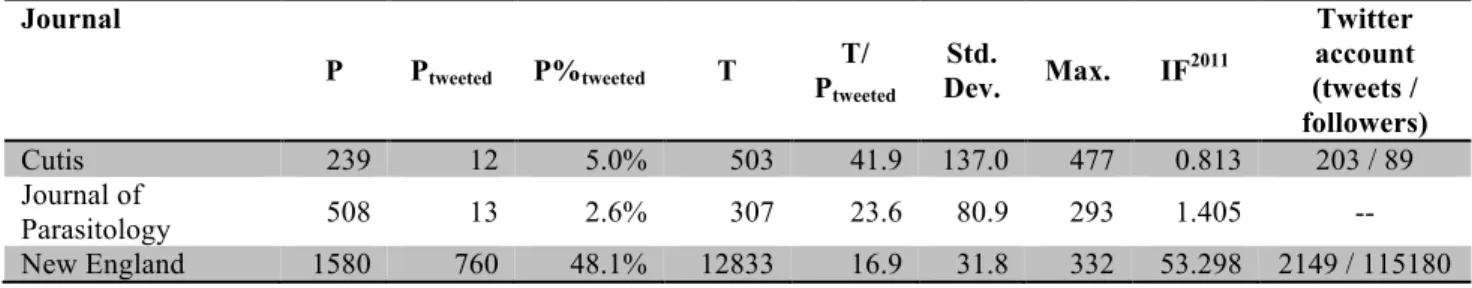
Table 3. Number of papers (articles and reviews published between 2010 and 2012) covered by
PubMed and WoS (P), number of tweeted documents (Ptweeted), Twitter coverage (P%tweeted), number
of tweets (T), mean Twitter citation rate (tweets per tweeted article, T/Ptweeted), standard deviation,
median and maximum of tweets per document, journal Impact Factor 2011 (IF2011) and information on official Twitter account (tweets/followers) for the 25 journals with the highest mean Twitter citation rate. Journal P Ptweeted P%tweeted T PT/ tweeted Std. Dev. Max. IF2011 Twitter account (tweets / followers) Cutis 239 12 5.0% 503 41.9 137.0 477 0.813 203 / 89 Journal of Parasitology 508 13 2.6% 307 23.6 80.9 293 1.405 -- New England 1580 760 48.1% 12833 16.9 31.8 332 53.298 2149 / 115180
Journal of Medicine Human & Experimental Toxicology 406 18 4.4% 248 13.8 52.2 223 1.772 -- Nature 2577 1083 42.0% 13430 12.4 25.2 274 36.280 1035 / 31956 Sexual Plant Reproduction 77 1 1.3% 11 11.0 -- 11 1.869 -- Quarterly Journal of Experimental Psychology 375 27 7.2% 296 11.0 22.8 87 1.964 -- Science 3140 1081 34.4% 11546 10.7 23.9 558 31.201 8949 / 109287 Health Physics 408 27 6.6% 269 10.0 21.1 92 1.680 -- Journal of Physical Chemistry A 3708 89 2.4% 853 9.6 61.1 549 2.946 -- Worldviews on Evidence-based Nursing 63 8 12.7% 76 9.5 18.1 54 1.239 -- Learning & Behavior 76 5 6.6% 45 9.0 13.5 33 2.000 -- Rhinology 199 1 0.5% 9 9.0 . 9 1.321 -- Lancet 1824 686 37.6% 5904 8.6 21.4 419 38.278 1859 / 68916 American Journal of Clinical Nutrition 944 408 43.2% 3320 8.1 16.8 149 6.669 -- Folia Phoniatrica et Logopaedica 78 1 1.3% 8 8.0 -- 8 1.115 -- Psychological Science 557 239 42.9% 1849 7.7 18.3 197 4.431 -- Behavior Research Methods 216 11 5.1% 85 7.7 11.6 39 2.116 -- JAMA Internal Medicine (formerly: Archives of Internal Medicine) 643 205 31.9% 1568 7.7 19.5 222 11.462 974 / 5504 JAMA 1137 439 38.6% 3293 7.5 13.7 141 30.026 4474 / 36339 Nature Biotechnology 321 118 36.8% 871 7.4 10.1 54 23.268 1185 / 19751 Journal of Sexual Medicine 921 150 16.3% 1089 7.3 34.1 392 3.552 -- Personality and Social Psychology Review 51 25 49.0% 170 6.8 9.1 46 6.071 -- Acta Neurochirurgica 665 24 3.6% 157 6.5 26.5 131 1.520 -- Ophthalmic and Physiological Optics 202 8 4.0% 52 6.5 12.9 38 1.583 --
As can be seen in Figure 1 and Table 3, journals that have both high Twitter coverage and high Twitter citation rates are either general science or medical journals, or are related to psychology, nutrition, or sexuality. The high Twitter citation rate of journals with low coverage (Cutis, Journal of Parasitology, Human & Experimental Psychology) is invariably caused by a single article that has been highly tweeted, which may make up as much as 95.4% of the journal’s total number of tweets. Interestingly, only 8 of the 25 journals with the highest Twitter citation rates have official Twitter accounts, while 9 of the 13 journals with the highest Twitter coverage (P%tweeted > 50%) were officially represented on Twitter. However, these Twitter profiles differ in terms of their numbers of tweets and followers.
While the British Dental Journal has more than 3,000 followers and 6,000 tweets, Cardiology in Review is only followed by 8 users and has tweeted 527 times. Current Opinion in Cardiology tweets less (445 tweets) but has a larger direct audience (171 followers).
Table 4. Spearman correlations between mean Twitter citation rate for articles tweeted at least once
(T/Ptweeted) and Twitter coverage (P%tweeted) per journal and 2011 Impact Factor (IF), Eigenfactor (EF)
and Article Influence (AI) score and Immediacy Index (II) for PubMed/WoS articles published in 2011.
Spearman’s ρ T/Ptweeted P%tweeted IF EF AI II
T/Ptweeted 1 .510** .242** .238** .279** .247**
N=3725 N=3725 N=3628 N=3628 N=3628 N=3628
P%tweeted .510** 1 .305** .223** .312** .282**
N=3725 N=3812 N=3712 N=3712 N=3712 N=3712 ** Correlation is significant at the 0.01 level (2-tailed).
In order to determine whether a journal’s popularity on Twitter is related to its scientific prestige as expressed by citations, Twitter coverage and Twitter citation rates were correlated with the journals’ 2011 Impact Factors, Immediacy Indexes, and Eigenfactor and Article Influence Scores (Table 4). All correlations were significant and positive; however, no correlation between the Twitter indicators and journal indicators exceeded .312. In general, correlations were higher with Twitter coverage than with Twitter citation rates.
Disciplines and specialties. As can be seen in Table 5, Twitter coverage at the discipline level is highest in Professional Fields, where 17.0% of PubMed documents were mentioned on Twitter at least once, followed by Psychology (14.9%) and Health (12.8%). When the data set is limited to only those articles that have been tweeted at least once, the papers from Biomedical Research have the highest Twitter citation rate (T/Ptweeted=3.3). Of the 284,764 research articles and reviews assigned to this discipline, 27,878 were mentioned on Twitter a total of 90,633 times. Twitter coverage is lowest in Physics papers covered by PubMed (1.8%), and Mathematics papers related to biomedical research receive the lowest average number of tweets per tweeted document (T/Ptweeted = 1.5).
Table 5. Twitter coverage and citations per article by discipline and specialty. Number of papers in
PubMed (PPubMed), tweeted documents (Ptweeted), Twitter coverage (P%tweeted), number of tweets (T) and
mean Twitter citation rate (T/Ptweeted) per discipline (highlighted according to coloring in Figure 2).
Superordinate specialties are listed if more than half of their WoS papers are covered in PubMed. Data for specialties include Twitter citation rate of documents published in 2011 (T/P2011), citation rate of tweeted documents published in 2011 (C/P2011) and Spearman correlation between the number
of tweets and citations per document published in 2011. ID refers to the labels used in Figure 2.
Disciplines & specialties PPubMed Ptweeted P%tweeted T T/Ptweeted T/P2011 C/ P2011 Spearman ID
Biology 61587 4357 7.1% 9634 2.2
Miscellaneous Biology 5400 851 15.8% 2437 2.9 2.9 4.4 .111* 59
Biomedical Research 284764 27878 9.8% 90633 3.3
Anatomy & Morphology 2389 138 5.8% 204 1.5 1.3 2.7 -.100 32
Biochemistry &
Molecular Biology 94085 7434 7.9% 15194 2.0 2.3 8.5 .255** 9
Biomedical Engineering 16430 640 3.9% 895 1.4 1.4 4.0 .000 38
Biophysics 4648 169 3.6% 239 1.4 1.3 4.6 .000 40
Cellular Biology
Embryology 3211 417 13.0% 692 1.7 1.6 5.1 .205** 2 Genetics & Heredity 28164 3186 11.3% 7091 2.2 2.5 10.3 .290** 46
Microbiology 29530 2009 6.8% 3704 1.8 1.9 5.2 .146** 53
Microscopy 1515 47 3.1% 86 1.8 2.4 3.8 .100 19
Miscellaneous
Biomedical Research 8998 699 7.8% 1532 2.2 2.0 3.9 .100 5
Nutrition & Dietetic 12400 2534 20.4% 9998 3.9 4.2 3.4 .179** 24
Parasitology 4855 182 3.7% 534 2.9 1.4 2.8 .000 54 Physiology 14677 1449 9.9% 4219 2.9 3.5 4.6 .257** 1 Virology 10704 896 8.4% 1482 1.7 1.7 3.7 .100 27 Chemistry 121770 6640 5.5% 10933 1.6 Analytical Chemistry 23256 1816 7.8% 2349 1.3 1.3 3.6 .098** 55 Clinical Medicine 774961 77991 10.1% 184002 2.4 Addictive Diseases 5678 870 15.3% 2191 2.5 2.3 2.5 .000 28 Allergy 2608 432 16.6% 1381 3.2 2.8 6.3 .000 41 Anesthesiology 7426 1604 21.6% 2626 1.6 1.5 3.0 .206** 21
Arthritis & Rheumatology 9499 991 10.4% 1889 1.9 1.8 4.0 .108* 39
Cancer 56138 6147 10.9% 12990 2.1 2.2 7.5 .208** 18
Cardiovascular System 42766 4004 9.4% 6888 1.7 1.7 6.1 .177** 37
Dentistry 17502 979 5.6% 1672 1.7 1.8 1.5 .000 14
Dermatology & Venerial
Disease 15174 1270 8.4% 2969 2.3 1.9 2.3 .166** 20 Endocrinology 24680 3075 12.5% 7659 2.5 2.4 4.7 .153** 17 Environmental & Occupational Health 10948 1455 13.3% 4026 2.8 2.6 3.4 .187** 47 Fertility 6119 493 8.1% 1118 2.3 2.1 3.8 .100 12 Gastroenterology 22911 1793 7.8% 3425 1.9 1.7 5.0 .270** 26
General & Internal
Medicine 62939 8242 13.1% 37479 4.5 5.8 8.7 .327** 51 Geriatrics 3606 477 13.2% 1102 2.3 2.3 3.6 .100 6 Hematology 17354 1360 7.8% 2326 1.7 1.7 5.6 .199** 4 Immunology 45162 4626 10.2% 9311 2.0 1.9 5.8 .176** 11 Miscellaneous Clinical Medicine 11942 2351 19.7% 8411 3.6 3.6 2.3 .105** 52 Nephrology 6615 500 7.6% 790 1.6 1.5 4.7 .100 13 Neurology & Neurosurgery 87449 9396 10.7% 22646 2.4 2.6 6.0 .154** 23
Obstetrics & Gynecology 15523 1378 8.9% 2582 1.9 1.8 2.6 .152** 42
Ophthalmology 15761 1057 6.7% 1633 1.5 1.4 2.8 .000 22 Orthopedics 16691 1618 9.7% 3434 2.1 2.2 2.7 .177** 36 Otorhinolaryngology 11838 882 7.5% 1379 1.6 1.6 1.3 .000 8 Pathology 13110 1061 8.1% 1800 1.7 1.4 3.1 .140** 10 Pediatrics 18334 2597 14.2% 7312 2.8 2.9 2.9 .235** 30 Pharmacology 69302 5232 7.5% 9151 1.7 1.8 4.2 .110** 31 Pharmacy 6726 302 4.5% 415 1.4 1.5 1.5 -.100 7 Psychiatry 20363 3453 17.0% 8229 2.4 2.3 4.2 .157** 33
Radiology & Nuclear
Medicine 31288 2168 6.9% 3235 1.5 1.4 2.4 .000 16
Respiratory System 9821 1292 13.2% 2851 2.2 2.0 5.2 .093* 35
Surgery 48247 4038 8.4% 5886 1.5 1.5 2.2 .185** 25
Tropical Medicine 4380 305 7.0% 485 1.6 1.5 2.1 .000 61
Urology 17678 1177 6.7% 2799 2.4 3.0 2.9 .204** 43
Earth and Space 26925 1070 4.0% 2885 2.7
Engineering and
Technology 27567 1517 5.5% 2916 1.9
Health 58580 7483 12.8% 17306 2.3
Geriatrics & Gerontology 3317 344 10.4% 654 1.9 1.8 2.4 .218** 56 Health Policy & Services 11429 1774 15.5% 4636 2.6 2.6 2.3 .116** 44
Nursing 13348 1579 11.8% 2987 1.9 1.8 0.8 .125** 34
Rehabilitation 7415 847 11.4% 1836 2.2 2.0 1.9 .000 48 Social Sciences, Biomedical 2612 486 18.6% 1329 2.7 2.7 2.1 .100 3 Social Studies of Medicine 190 10 5.3% 10 1.0 1.0 0.2 .000 15 Speech-Language
Pathology and Audiology 1577 154 9.8% 308 2.0 1.8 1.7 -.200 50
Humanities 691 45 6.5% 121 2.7
Mathematics 2459 134 5.4% 197 1.5
Physics 19353 340 1.8% 539 1.6
Professional Fields 5586 950 17.0% 2510 2.6
Psychology 35873 5350 14.9% 16240 3.0
Behavioral Science & Complementary Psychology
4802 521 10.8% 1385 2.7 2.7 2.6 .000 57
Clinical Psychology 5757 994 17.3% 2161 2.2 2.1 2.4 .100 58
Developmental & Child
Psychology 5502 937 17.0% 2365 2.5 2.5 2.7 .120* 60
Experimental Psychology 7502 1106 14.7% 4795 4.3 4.5 3.5 .100 45
Social Sciences 8922 812 9.1% 2192 2.7
Total 1431399 134929 9.4% 340751 2.5
* Correlation is significant at the 0.05 level (2-tailed). ** Correlation is significant at the 0.01 level (2-tailed).
Figure 2. Percentage of documents per specialty mentioned on Twitter (Twitter coverage) and mean
number of tweets per tweeted document (Twitter citation rate) for the 61 specialties with PubMed coverage of at least 50%. Coloring indicates superordinate discipline and labels show specialty IDs as listed in Table 5.
On the level of specialties, General & Internal Medicine (ID in 2: 51) has the highest Twitter citation rate and a coverage rate of 13.1%. Tweeted articles from this specialty on Twitter are (re)tweeted 4.5 times on average (Figure 2, Table 5). The specialty is popular among Twitter users in terms of diversity (number of different papers tweeted) and popularity (number of tweets per tweeted document) compared to the average Twitter coverage (P%tweeted=9.4%) and Twitter citation rate (T/Ptweeted=2.5) of all PubMed papers. The same is true for Experimental Psychology (T/Ptweeted=4.3; P%tweeted=14.7%; ID: 45), Nutrition & Dietics (3.9; 20.4%; ID: 24), Miscellaneous Clinical Medicine (3.6; 19.7%; ID: 52) and Allergy (3.2; 16.6%; ID: 41). With more than a fifth of its papers mentioned at least once on Twitter, Anesthesiology (1.6; 21.6%; ID: 21) has the highest coverage but is tweeted below average.
Figure 3. Specialties assigned to the four cases reflecting positive and negative correlations values
between citations and tweets per document and high and low coverage of documents on Twitter. Coloring indicates superordinate discipline as listed in Table 5 and size of data points the Twitter citation rate. Coverage values are normalized by the average for all PubMed documents (9.4%), so that data points placed in the first and second quadrant represent specialties with positive correlations and coverage values above (Case I) and below average (Case II), respectively. The third and fourth quadrants contain those specialties where correlations were negative and coverage above (Case III) and below average (Case IV). Dashed line represents Spearman correlation between citations and tweets of all 2011 papers (ρ=.183**).
To compare the relationship between tweeting and citation behavior, the number of tweets and citations were analyzed on the document level for each of the 61 specialties. As described
in the Methods section, the correlations are based on 2011 publications to reduce citation delay and Twitter uptake biases as far as possible. As shown in Table 5, correlations were positive for most (i.e., 47) of the 61 specialties but very low in generaliv with General & Internal Medicine having the highest Spearman values of .327. While 13 specialties showed no correlation between tweets and citations, the Spearman value was negative in three specialties, i.e. Speech-Language Pathology & Audiology (ρ=-.200), Anatomy & Morphology (ρ=-.100) and Pharmacy (ρ=-.100). Correlations were significant for only 26 specialties, all of which were positive. Even where correlations are the highest, there are huge differences in the ranking positions of individual papers. For example, the three most frequently tweeted papers were ranked 161st, 1996th and 1007th in terms of citations within the General & Internal Medicine specialty in our dataset and the three most frequently cited papers in the specialty were ranked 610th, 18th and 228th by number of tweets. The second most frequently cited (443 citations) and 18th most frequently tweeted document (123 tweets) discusses antiretroviral therapy to limit the transmission of HIV and is consequentially highly relevant from both a social and medical research perspective, and the General & Internal Medicine paper that ranked highest in terms of tweets and citations concerns a topic that has major implications for physicians treating stroke risk patients and a large community of patients themselves (see Mohammadi & Thelwall, 2013, in press).
Figure 3 depicts coverage and correlations between number of citations and number of tweets. Note that coverage values are normalized by the average value for the entire data set (9.4%) so that data points placed in the first quadrant represent specialties with positive correlations and coverage above average (Case I), suggesting that tweeting and citation behavior tend to overlap more and that documents are represented more broadly than average, e.g. General & Internal Medicine (ρ= .327**, P%tweeted=13.1%). Specialties in the second quadrant reflect positive correlations and coverage below average (Case II), such as Urology (ρ=.204**, P%tweeted=6.7%) and Microscopy (ρ=.100, P%tweeted=3.1%), which are less popular on Twitter. While the third quadrant contains those specialties with negative correlations and coverage above average (Case III), indicating that the specialties are popular on Twitter but citation and tweeting behaviour differs (Speech-Language Pathology & Audiology (ρ=-.200, P%tweeted=9.8%), the fourth quadrant contains those with negative correlations and coverage values below average (Case IV), i.e. Anatomy & Morphology (ρ=-.100, P%tweeted=5.8%) and Pharmacy (ρ=-.100, P%tweeted=4.5%). Size of data points represents the Twitter citation rate per discipline.
Discussion and Framework
Discussion. The goal of this paper was to examine the degree to which biomedical papers appeared on Twitter, the degree to which this varied by journal and domain, and the relationship between tweets and citations. We briefly discuss our findings in relationship to these three areas.
Less than 10% of the more than 1.4 million articles found in both WoS and PubMed were tweeted. However, Twitter coverage has increased dramatically over time; with more than 20% of articles published in 2012 receiving at least on tweet. These rates of coverage are much lower than those found for other sources of altmetric data, such as the readership data generated from Mendeley (e.g., Bar-Ilan, Haustein, Peters, Priem, Shema, & Terliesner, 2012; Haustein, Peters, Bar-Ilan, Priem, Shema, & Terliesner, 2013; Bar-Ilan, 2012a; 2012b; Li et al., 2012). The majority of journals had less than 20% of their content tweeted. Those with high Twitter coverage tended to be those with designated Twitter handles for the journal or the associated publisher/association. However, the maintenance of an official Twitter
account did not necessarily translate to an increased Twitter citation rate for articles within these journals. On average, articles which were tweeted were tweeted two and half times, though most only received a single tweet. At 0.2 tweets per article, the overall Twitter citation rate was significantly lower when including untweeted articles. Wide variation was also found by discipline and specialty in both Twitter coverage and Twitter citation rate. Results strongly show that, as with publication and citation behavior, tweeting behavior varies across disciplines and specialties, and these differences need to be accounted for when comparing the social media impacts of scholarly articles from different fields.
Correlations between Twitter coverage and Twitter citation rates with traditional bibliometric indicators for journals were positive and significant, with rates between .223 and .312. Comparing formal citations and Twitter citations for all papers published in 2011, we found a low but positive correlation of .183, which suggests that, although both indicators are somewhat related, they mostly measure a different type of impact. Moreover, these correlations are lower than the coefficients identified relating other novel metrics (such as readership and mentorship) to citations (Schlögl, Gorraiz, Gumpenberger, Jack, & Kraker, 2013; Bar-Ilan et al., 2013; Li et al., 2012; Sugimoto, Russell, Meho, & Marchionini, 2008) and are also lower than the demonstrated correlations between tweets and other metrics, such as downloads and Google Scholar citations (Shuai et al., 2012).
Given the low correlations found here on a very large dataset of both tweets and citations and limiting the biases of Twitter uptake on the one hand and citation delays on the other, we argue that Twitter citations do not to reflect traditional research impact. This may be due to several factors, including the low Twitter uptake among scientists and the fact that the viability of Twitter as a tool for scholarly communication is still mostly unknown. Reasons for low Twitter usage among scholars will need to be determined in future qualitative usage studies.
That being said, our exploratory analysis of top tweeted articles suggests that they might actually have been highly tweeted because of their curious or humorous content, implying that these tweets are mostly made by the “general public” rather than the scientific community. In other words, their high number of tweets did not seem to be due to their intellectual contribution or scientific quality. Other articles were highly tweeted because of their timeliness or their health-related content, which is the closest we’ve been to assessing what one could consider as the impact of health research on society. All in all, these findings suggests that there is a lot of heterogeneity in the tweeting of biomedical papers, and that a lot of work still needs to be done in order to assess the various contexts in which scientific papers are tweeted. More specifically, it is of crucial importance to obtain robust data on the relative importance of each of these contexts to see, among other things, whether tweets are indeed a measure of the social impact of research, before these metrics are added to the scientometric toolbox.
Framework. To facilitate interpretation of results, we present a framework for understanding the relationships among new and established indicators. For the present, we focus on Twitter as a case study and use our data to inform the framework. However, this could be easily expanded to encompass other new indicators. Although we believe that various altmetrics differ and that social media based indicators comprise many different facets that should not be blended but analyzed separately. For example, as a microblogging platform Twitter can be considered a tool for dissemination and discussion, Mendeley most likely reflects readership within the academic community, while F1000 provides post-publication peer review. Just like
citations, downloads and standard peer-reviews, these aspects should be considered separately and not be aggregated into one single number or indicator as impact is a multifaceted notion (Haustein, 2012).
Figure 4 provides a schematic representation of the framework of tweeting behavior of scholarly documents, which is divided into four cases according to their 1) Twitter coverage and 2) correlation between number of Tweets and citations.
• Case I: A set of documents (e.g., journals, specialties, disciplines) has high Twitter coverage, papers with many Twitter citations have many WoS citations, and papers with few Twitter citations have few citations (high positive correlation)
The coverage suggests either that there is a large user group on Twitter mentioning scholarly documents or there is systematic tweeting by a few individuals or automated tweeting. A high correlation suggests that Twitter users are interested in the same papers as the scientific community since documents that have a high citation impact are also popular on Twitter and those that are not frequently cited are also tweeted about less often. This scenario is consistent with the following.
Many members of the scientific community and/or the general public are active on Twitter and tweet a large proportion of published scientific articles AND
A) The scientific community discusses many different scientific articles on Twitter, so that Twitter serves as an alternative way to find, distribute and discuss results within the scientific community. Scientific tweeting patterns follow traditional citing patterns.
AND/OR
B) The general public discusses scholarly findings on Twitter and is interested in the same topics as scientists (e.g., general interest topics in health related issues) and tweets in the same way that scientists cite their publications.
As demonstrated in our study, high coverage does not necessarily imply that there is great interest in the articles. Rather, it could imply that tweeting has been incorporated into the professional activities of the journal or publisher. Regardless, high coverage indicates high dissemination on the platform. A direct correlation between the new metric (tweets, in this case) and an established metric (e.g., citations) suggests that these metrics are reinforcing and consensual. In the case that the metrics represent separate audiences, we might infer broader impact. If those generating the metrics are the same population, we might infer redundancy (e.g., if the same scientists are tweeting and citing, no added measure of impact can be derived).
• Case II: A set of documents has low Twitter coverage, papers with many Twitter citations have many WoS citations, papers with many Twitter citations have many WoS citations, and papers with few Twitter citations have few WoS citations (high positive correlation) The coverage shows that the user group on Twitter is only interested in a few scholarly documents from this set. The correlation suggests that Twitter users are interested in the same topics and papers as the scientific community since documents that have a high citation impact are also popular on Twitter. Scientific papers that have low impact on the scholarly community are not popular on Twitter. The scenarios causing this conclusion are consistent with the following.
Many members of the scientific community and/or the general public are active on Twitter but tweet only a small proportion of published scientific articles AND
A) The scientific community actively discusses a few scientific articles on Twitter. AND/OR
B) The general public is interested in topics (e.g., medical health related issues) and tweets about scientific papers.
• Case III: A set of documents has high Twitter coverage, papers with few Twitter citations have many WoS citations, and papers mentioned frequently on Twitter have few WoS citations (high negative correlation)
The coverage shows that there is a large user group on Twitter mentioning scholarly documents but the correlation reflects that Twitter users are not interested in the same articles as the scientific community, since papers that have a high scientific impact are not popular on Twitter. The scenarios which cause this conclusion are consistent with the following.
A large share of (scientific and/or general public) community is active on Twitter and distributes a large share of documents AND
A) The scientific community tweets different content than it cites in scholarly publications.
AND/OR
B) The general public is not interested in the same topics as scientists cite but is interested in articles that have low scientific impact (e.g., curious papers with funny titles).
If those who are tweeting are also citing, then this implies that the metrics measure different types of use or interest in these articles. For example, medical researchers may tweet and rate highly articles that help clinical practice even if they do not then cite them (e.g., for related results see Mohammadi & Thelwall, 2013, in press). An alternative explanation is that the user groups are different—that is, that those who tweet do not also write and, thereby, cite in this area. One potential scenario in this group are curious papers with particularly provocative or interesting titles.
• Case IV: A set of documents has low Twitter coverage, papers with few Twitter citations have many WoS citations, and papers mentioned frequently on Twitter have few WoS citations (high negative correlations)
The coverage shows that the user group on Twitter is only interested in a few scholarly documents and the correlation reflects that Twitter users are not interested in the same topics as the scientific community, since papers that have a high scientific impact are not popular on Twitter. The scenarios which cause this conclusion are consistent with the following.
Only a small share of documents is distributed by the (scientific and/or general public) community (either a small or large share of the respective community) AND
A) The scientific community tweets different content than it cites in scholarly publications.
AND/OR
B) The general public is not interested in the same topics as scientists cite but is interested in articles that have low scientific impact (e.g., curious papers with funny titles).
This differentiates from Case III, in that the correlations are generated by very few articles—that is, an article that is either very highly cited or highly tweeted. A negative correlation but low coverage might imply that while there is only a small community on Twitter which is not capable of distributing a large amount of different articles, those papers that are distributed are relevant to both scientists and a general public.
Figure 4. Framework of Cases I to IV representing high and low Twitter coverage and correlation
between the number of tweets and citations for a set of documents.
As demonstrated by these cases, there are many diverse actors, motivations, processes, and outcomes embedded in interpretations of altmetric data. Qualitative and more detailed analyses of Twitter users are needed to determine whether scenarios A and/or B apply or whether it is a completely different group of actors responsible for the distribution of scholarly literature on Twitter. Further research should thus include qualitative analyses of Twitter content as well as user surveys aimed at determining Twitter’s role in the scholarly communication and reward systems and shed light on researchers’ motivations for (not) using Twitter. In addition, analyses such as ours should be performed for non-medical disciplines so that more can be known about discipline-specific Twitter uptake and its appropriateness as a tool in research evaluation.
Conclusion
This large-scale analysis covering the entire spectrum of medical disciplines provides substantial data for the evaluation of Twitter metrics and supports the understanding of scholarly Twitter use in this research area. We introduced a framework to classify four distinct relationships between tweeting and citing, using this as a theoretical underpinning to facilitate the evaluation of tweeting behavior in various specialties.
With less than 10% of PubMed documents mentioned, Twitter shows a much lower coverage of scholarly document than other social media platforms such as Mendeley and CiteULike, which is most likely due to the scholarly focus of the latter two. Nevertheless, we were able to demonstrate that there are some journals and specialties in biomedical science that are of greater interest to the Twitter community than others. Low correlation between the number of citations and tweets per document indicate that tweets and citations are far from measuring the same impact and suggest that Twitter-based indicators reflect another kind of impact not
comparable to traditional citation indicators. Therefore, they should not be considered as alternatives to citation-based indicators, but rather as complementary.
However, before adding tweets to the scientometric toolbox as a complementary measure of public or societal impact of scholarly products, motivations to tweet need to be distinguished and further evaluated. As shown, the distribution of academic articles on Twitter is in general quite low. This low coverage rate may reflect a belief among the majority of academics that it would not be a good use of their time to tweet about publications, perhaps because interested scholars could find their articles in other ways and do not use Twitter to discuss research. Further research needs to investigate why academics tweet or do not tweet about publications and who the users are that mentioning academic articles on Twitter.
Our exploratory analysis of highly tweeted documents shows that while some papers seem to receive attention on Twitter because of actual health implications or topicality, others seem to be distributed on Twitter due to humorous or curious contents, which suggests that tweets do not necessarily reflect intellectual impact. A large-scale user survey could reveal why scholarly publications are mentioned on Twitter and why some papers are tweeted more frequently than others. Moreover, distribution of scholarly documents on Twitter is influenced by officially curated Twitter handles and particular journal policies. These ambiguities have implications for the use of tweet counts as altmetrics.
Acknowledgements
This research was part of the international Digging into Data program (funded by AHRC/ESRC/JISC (UK), SSHRC (Canada), and the National Science Foundation (US; grant #1208804). The authors would like to thank Euan Adie of Altmetric.com for supplying the data and descriptions of it and to Andrew Tsou for work on earlier versions of the manuscript. VL acknowledges funding from the Canada Research Chair program.
References
Alperin, J. P. (2013). Ask not what altmetrics can do for you, but what altmetrics can do for developing countries. Bulletin of the ASIS&T, 39(4), 18-21.
American Medical Association (2011). Report of the Council on Ethical and Judicial Affairs: Professionalism in the Use of Social Media. Retrieved from http://www.ama-assn.org/resources/doc/code-medical-ethics/9124a.pdf
Bar-Ilan, J. (2012a). JASIST@mendeley. Presented at the ACM Web Science Conference
Workshop on Altmetrics. Evanston, IL. Retrieved from
http://altmetrics.org/altmetrics12/bar- ilan
Bar-Ilan, J. (2012b). JASIST 2001-2010. Bulletin of the ASIS&T, 38(6), 24-28.
Bar-Ilan, J., Haustein, S., Peters, I., Priem, J., Shema, H., & Terliesner, J. (2012). Beyond citations: Scholars' visibility on the social Web. In Proceedings of the 17th International Conference on Science and Technology Indicators, Montreal, Canada. Retrieved from http://arxiv.org/abs/1205.5611
Berger, E. (2009). This sentence easily would fit on Twitter: Emergency physicians are learning to “Tweet”. Annals of Emergency Medicine, 54(2), 25A-25A.
boyd, D., Golder, S., & Lotan, G. (2010). Tweet, tweet, retweet: Conversational aspects of retweeting on Twitter. In Proceedings of the 43rd Hawaii International Conference on
System Sciences, Kauai, USA. Retrieved from
http://www.danah.org/papers/TweetTweetRetweet.pdf
Buschman, M., & Michalek, A. (2013). Are alternative metrics still alternative? Bulletin of the ASIS&T, 39(4), 35-39.
Chretien, K., Azar, J., & Kind, T. (2011). Physicians on Twitter. JAMA, 305(6), 566-568. Cohen, E. (2009). Surgeons send ‘tweets’ from operating room. Retrieved from
http://edition.cnn.com/2009/TECH/02/17/twitter.surgery/index.html
Cronin, B. (2013). Metrics à la mode. Journal of the American Society for Information Science and Technology, 64(6), 1091.
Cruz, F., & Jamias, S. B. (2013). Scientists’ use of social media: The case of researchers at the University of the Philippines Los Banos. First Monday, 18(4). doi: 10.5210/fm.v18i4.4296
Darling, E. S., Shiffman, D., Côté, I. M., & Drew, J. A. (2013). The role of twitter in the life cycle of a scientific publication. Submitted to Ecology and Evolution. Retrieved from http://arxiv.org/abs/1305.0435
eMarketer (February 24, 2011). Facebook Reaches Majority of US Web Users. Retrieved from http://www.emarketer.com/Article/Facebook-Reaches-Majority-of-US-Web-Users/1008247
Eysenbach, G. (2011). Can tweets predict citations? Metrics of social impact based on Twitter and correlation with traditional metrics of scientific impact. Journal of Medical Internet Research, 13(4), e123.
Gargouri, Y., Hajjem, C., Larivière, V., Gingras, Y., Carr, L., Brody, T., & Harnad, S. (2010). Open access, whether self-selected or mandated, increases citation impact, especially for higher quality research. PLoS ONE, 5(10): e13636.
Haustein, S. (2012). Multidimensional Journal Evaluation. Analyzing Scientific Periodicals beyond the Impact Factor. Berlin/Boston: De Gruyter Saur.
Haustein, S., Peters, I., Bar-Ilan, J., Priem, J., Shema, H., & Terliesner, J. (2013). Coverage and adoption of altmetrics sources in the bibliometric community. In J. Gorraiz, E. Schiebel, C. Gumpenberger, M. Hörlesberger, & H. Moed (eds.), Proceedings of the 14th International Society of Scientometrics and Informetrics Conference, Vienna, Austria (pp. 468-483). Wien: Facultas Verlags- und Buchhandels AG.
Henneken, E. A., & Accomazzi, A. (2011). Linking to data – Effect on citation rates in astronomy. Retrieved from http://arxiv.org/abs/1111.3618
Holmberg, K., & Thelwall, M. (2013). Disciplinary differences in Twitter scholarly communication. In J. Gorraiz, E. Schiebel, C. Gumpenberger, M. Hörlesberger, & H. Moed (eds.), Proceedings of the 14th International Society of Scientometrics and Informetrics Conference, Vienna, Austria (pp. 567-582). Wien: Facultas Verlags- und Buchhandels AG.
Jansen, B. J., Zhang, M., Sobel, K., & Chowdury, A. (2009). Twitter power: Tweets as electronic word of mouth. Journal of the American Society for Information Science and Technology, 60(11), 2169-2188.
Kaur, J., Hoang, D. T., Sun, X., Possamai, L., JafariAsbag, M., Patil, S., & Menczer, F. (2012). Scholarometer: A social framework for analyzing impact across disciplines. PloS ONE, 7(9). doi: 10.1371/journal.pone.0043235
Li, X., Thelwall, M., & Giustini, D. (2012). Validating online reference managers for scholarly impact measurement. Scientometrics, 91(2), 461-471.
Lippi, G., & Favaloro, E. J. (2012). Article downloads and citations: Is there any relationship? Clinica Chimica Acta, 415(195). doi: 10.1016/j.cca.2012.10.037
Mahrt, M., Weller, K., & Peters, I. (2013, in press). Twitter in scholarly communication. In K. Weller, A. Bruns, J. Burgess, M. Mahrt, & C. Puschmann (Eds.). Twitter and Society. New York, NY: Peter Lang.
Mohammadi, E., & Thelwall, M. (2013, in press). Assessing non-standard article impact using F1000 labels, Scientometrics.
Mounce, R. (2013). Open access and altmetrics: Distinct but complementary. Bulletin of the ASIS&T, 39(4), 14-9.
Nature Chemistry. (2013). Editorial: All you can tweet. Nature Chemistry, 5, 247.
Ogden, L. E. (2013). Tags, blogs, tweets: Social media as science tool? BioScience, 63(2), 148.
Parker-Pope, T. (2009). Tweeting from the operating room. Retrieved from http://well.blogs.nytimes.com/2009/07/09/tweeting-from-the-operating-room
Peters, I., Beutelspacher, L., Maghferat, P., & Terliesner, J. (2012). Scientific bloggers under the altmetric microscope. In Proceedings of the 75th Annual Meeting of the American Society for Information Science and Technology, Baltimore, USA. doi: 10.1002/meet.14504901305
Piwowar, H., & Priem, J. (2013). The power of altmetrics on a CV. Bulletin of the ASIS&T, 39(4), 10-13.
Priem, J., & Costello, K. L. (2010). How and why scholars cite on Twitter. In Proceedings of the 73th Annual Meeting of the American Society for Information Science and Technology, Pittsburgh, USA. doi: 10.1002/meet.14504701201
Priem, J., Costello, K. L., & Dzuba, T. (2011). Prevalence and use of Twitter among scholars. Poster presented at Metrics 2012: Symposium on Informetric and Scientometric Research, New Orleans, USA. doi: 10.6084/m9.figshare.104629
Rowlands, I., Nicholas, D., Russell, B., Canty, N., & Watkinson, A. (2011). Social media use in the research workflow. Learned Publishing, 24, 183–195.
Schlögl, C., Gorraiz, J., Gumpenberger, C., Jack, K., & Kraker, P. (2013s). Download vs. citation vs. readership data: the case of an information systems journals. In J. Gorraiz, E. Schiebel, C. Gumpenberger, M. Hörlesberger, & H. Moed (eds.), Proceedings of the 14th International Society of Scientometrics and Informetrics Conference, Vienna, Austria (pp. 626-634). Wien: Facultas Verlags- und Buchhandels AG.
Shuai, X., Pepe, A., & Bollen, J. (2012). How the scientific community reacts to newly submitted preprints: Article downloads, Twitter mentions, and citations. Retrieved from http://arxiv.org/abs/1202.2461
Sugimoto, C.R., Russell, T.G., Meho, L.I., & Marchionini, G. (2008). MPACT and citation impact: Two sides of the same scholarly coin? Library & Information Science Research, 30(4), 273-281.
Sugimoto, C. R., & Thelwall, M. (2013). Scholars on soap boxes: Science communication and dissemination in TED videos. Journal of the American Society for Information Science and Technology, 64(4), 663-674.
Suh, B., Hong, L., Pirolli, P., & Chi, E. H. (2010). Want to be retweeted? Large scale analytics on factors impacting retweet in Twitter network. In Proceedings of the 2nd IEEE International Conference on Social Computing, Minneapolis, USA (pp. 177-184). Los Alamitos, USA: IEEE Computer Society. doi: 10.1109/SocialCom.2010.33
Thelwall, M., Haustein, S., Larivière, V. & Sugimoto, C. (2013). Do altmetrics work? Twitter and ten other candidates. PLOS ONE, 8(5), e64841.
Viney, I. (2013). Altmetrics: research council responds. Nature, 494, 176.
Weller, K., & Peters, I. (2012). Citations in Web 2.0. In A. Tokar, M. Beurskens, S. Keuneke, M. Mahrt, I. Peters, C. Puschmann, et al. (Eds.), Science and the Internet (pp. 209-222). Düsseldorf: Düsseldorf University Press.
Weller, K., & Puschmann, P. (2011). Twitter for scientific communication: How can citations/references be identified and measured? Poster presented at the 3rd International Conference on Web Science, Koblenz, Germany. Retrieved from http://files.ynada.com/posters/websci11.pdf