High-amylose carboxymethyl starch matrices for oral sustained
drug-release: in vitro and in vivo evaluation
par
Maria Teresa Domingues Nabais
Technologie Pharmaceutique Faculté de Pharmacie
Thèse présentée à la Faculté de Pharmacie en vue de l’obtention du grade de PhD
en Sciences Pharmaceutiques option Technologie Pharmaceutique
Août 2013
Faculté des études supérieures et postdoctorales
Cette thèse intitulée :
High-amylose carboxymethyl starch matrices for oral sustained drug-release: in vitro and in vivo evaluation
Présentée par :
Maria Teresa Domingues Nabais
a été évaluée par un jury composé des personnes suivantes :
Prof. Jeanne Leblond Chain, président-rapporteur Prof. Grégoire Leclair, directeur de recherche
Prof. Xavier Banquy, membre du jury
Abstract
Unmodified and modified starches represent a particularly interesting group of biodegradable and abundant excipients. They have been widely used as excipients for various purposes in tablet formulations, such as binders and/or disintegrants. Spray-dried high-amylose sodium carboxymethyl starch (SD HASCA) was recently proposed as an innovating hydrophilic excipient for sustained-release (SR) in solid oral dosage forms. Amorphous high-amylose sodium carboxymethyl starch (HASCA) was first produced by the etherification of high-amylose corn starch with chloroacetate. HASCA was then spray dried to obtain SD HASCA. This new excipient has shown advantageous and effective properties in the production of SR delivery systems. SR matrix tablets prepared from SD HASCA are inexpensive, simple to formulate and easy to produce by direct compression.
The main objective of the present research was to continue the development and optimization of matrix tablets using SD HASCA as the retarding excipient in view of their ultimate application as sustained drug-release delivery systems for oral administration. For this purpose, dissolution tests simulating some of the most relevant physiological conditions of the gastrointestinal tract, taking into account the nature of the polymer under investigation, were employed to evaluate the drug-release characteristics and demonstrate the performance of SD HASCA SR formulations. An exploratory clinical study was also carried out to evaluate the SR properties of this new drug delivery system in the gastrointestinal tract.
The first article presented in this thesis evaluated the drug-release characteristics and the physical integrity of formulations containing a compressed blend of drug, sodium chloride and SD HASCA in biorelevant media. The influence of different acidic pH values and residence times was investigated. The SR profile from an optimized SD HASCA formulation was not significantly affected by both the acidic pH value and the residence time in the acidic medium. These results suggest a limited influence of intra- and inter-subject variability of gastric pH on the release kinetics from SD HASCA matrices. In addition, the optimized formulation maintained its integrity throughout the duration of the dissolution tests. The exploratory in vivo study demonstrated extended drug absorption after oral administration of SD HASCA matrix tablets and that the matrix tablets did not disintegrate while passing through the stomach and resisted hydrolysis by α-amylase in the intestine.
The second article reports the development of once-daily and twice-daily SD HASCA tablets containing tramadol hydrochloride (100 mg and 200 mg). These SR formulations presented high crushing strengths without requiring the addition of binders, which facilitates tablet processing and handling. The compression force (CF) applied to produce the tablets did not significantly affect the drug-release profiles. The total release time from SD HASCA tablets increased significantly in function of the tablet weight and can be used to modulate the total release time from theses formulations. When exposed to a pH gradient and to a 40% ethanol medium, a very rigid gel formed progressively on the surface of the tablets providing controlled drug-release properties. These properties indicated that SD HASCA is a robust excipient for oral, sustained drug-release, likely to minimize the possibility of dose dumping and consequent adverse effects, even when co-administered with high doses of alcohol.
The third article investigated the effect of α-amylase on drug-release from previously developed SD HASCA tablets containing acetaminophen and tramadol hydrochloride (Acetaminophen SR and Tramadol SR). Mathematical modeling showed that an increase in α-amylase concentration resulted in an increase of polymer erosion over drug diffusion as the main mechanism controlling drug-release, for both formulations and both residence times in acidic medium. However, even if the mechanism of release was affected, α-amylase concentrations ranging from 0 IU/L to 20000 IU/L did not significantly affect the drug-release profiles from SD HASCA SR tablets, regardless of the residence time in acidic medium, the drug used, the polymer content and the different composition of each formulation.
The work presented in this thesis clearly demonstrates the value of SD HASCA as an efficient SR excipient.
Keywords: oral drug delivery; sustained-release; hydrophilic excipient; modified starch;
Résumé
Les amidons non modifiées et modifiés représentent un groupe d’excipients biodégradables et abondants particulièrement intéressant. Ils ont été largement utilisés en tant qu’excipients à des fins diverses dans des formulations de comprimés, tels que liants et/ou agents de délitement. Le carboxyméthylamidon sodique à haute teneur en amylose atomisé (SD HASCA) a été récemment proposé comme un excipient hydrophile à libération prolongée innovant dans les formes posologiques orales solides. Le carboxyméthylamidon sodique à haute teneur en amylose amorphe (HASCA) a d'abord été produit par l'éthérification de l'amidon de maïs à haute teneur en amylose avec le chloroacétate. HASCA a été par la suite séché par atomisation pour obtenir le SD HASCA. Ce nouvel excipient a montré des propriétés présentant certains avantages dans la production de formes galéniques à libération prolongée. Les comprimés matriciels produits à partir de SD HASCA sont peu coûteux, simples à formuler et faciles à produire par compression directe.
Le principal objectif de cette recherche était de poursuivre le développement et l'optimisation des comprimés matriciels utilisant SD HASCA comme excipient pour des formulations orales à libération prolongée. A cet effet, des tests de dissolution simulant les conditions physiologiques du tractus gastro-intestinal les plus pertinentes, en tenant compte de la nature du polymère à l’étude, ont été utilisés pour évaluer les caractéristiques à libération prolongée et démontrer la performance des formulations SD HASCA. Une étude clinique exploratoire a également été réalisée pour évaluer les propriétés de libération prolongée de cette nouvelle forme galénique dans le tractus gastro-intestinal.
Le premier article présenté dans cette thèse a évalué les propriétés de libération prolongée et l'intégrité physique de formulations contenant un mélange comprimé de principe actif, de chlorure de sodium et de SD HASCA, dans des milieux de dissolution biologiquement pertinentes. L'influence de différentes valeurs de pH acide et de temps de séjour dans le milieu acide a été étudiée. Le profil de libération prolongée du principe actif à partir d'une formulation de SD HASCA optimisée n'a pas été significativement affecté ni par la valeur de pH acide ni par le temps de séjour dans le milieu acide. Ces résultats suggèrent une influence limitée de la variabilité intra et interindividuelle du pH gastrique sur la cinétique de libération à partir de matrices de SD HASCA. De plus, la formulation optimisée a gardé
son intégrité pendant toute la durée des tests de dissolution. L’étude in vivo exploratoire a démontré une absorption prolongée du principe actif après administration orale des comprimés matriciels de SD HASCA et a montré que les comprimés ne se sont pas désintégrés en passant par l'estomac et qu’ils ont résisté à l’hydrolyse par les α-amylases dans l'intestin.
Le deuxième article présente le développement de comprimés SD HASCA pour une administration orale une fois par jour et deux fois par jour contenant du chlorhydrate de tramadol (100 mg et 200 mg). Ces formulations à libération prolongée ont présenté des valeurs de dureté élevées sans nécessiter l'ajout de liants, ce qui facilite la production et la manipulation des comprimés au niveau industriel. La force de compression appliquée pour produire les comprimés n'a pas d'incidence significative sur les profils de libération du principe actif. Le temps de libération totale à partir de comprimés SD HASCA a augmenté de manière significative avec le poids du comprimé et peut, de ce fait, être utilisé pour moduler le temps de libération à partir de ces formulations. Lorsque les comprimés ont été exposés à un gradient de pH et à un milieu à 40% d'éthanol, un gel très rigide s’est formé progressivement sur leur surface amenant à la libération prolongée du principe actif. Ces propriétés ont indiqué que SD HASCA est un excipient robuste pour la production de formes galéniques orales à libération prolongée, pouvant réduire la probabilité d’une libération massive de principe actif et, en conséquence, des effets secondaires, même dans le cas de co-administration avec une forte dose d'alcool.
Le troisième article a étudié l'effet de α-amylase sur la libération de principe actif à partir de comprimés SD HASCA contenant de l’acétaminophène et du chlorhydrate de tramadol qui ont été développés dans les premières étapes de cette recherche (Acetaminophen SR et Tramadol SR). La modélisation mathématique a montré qu'une augmentation de la concentration d’α-amylase a entraîné une augmentation de l'érosion de polymère par rapport à la diffusion de principe actif comme étant le principal mécanisme contrôlant la libération de principe actif, pour les deux formulations et les deux temps de résidence en milieu acide. Cependant, même si le mécanisme de libération peut être affecté, des concentrations d’α-amylase allant de 0 UI/L à 20000 UI/L n'ont pas eu d'incidence significative sur les profils de libération prolongée à partir de comprimés SD HASCA, indépendamment de la durée de
séjour en milieu acide, le principe actif utilisé, la teneur en polymère et la différente composition de chaque formulation.
Le travail présenté dans cette thèse démontre clairement l'utilité de SD HASCA en tant qu'un excipient à libération prolongée efficace.
Mots-clés : administration orale de médicaments ; libération prolongée ; excipient hydrophile ;
Table of contents
Abstract i
Résumé iii
Table of contents vi
List of tables xiii
List of figures xv
List of initials and abbreviations xxii
Acknowledgements xxvi
Chapter 1. Introduction
11.1 Pharmaceutical dosage forms intended to oral drug administration 1
1.1.1. General principles 1
1.1.2. Oral drug administration 3
1.1.3. Pharmaceutical oral dosage forms 5
1.1.4. Drug-release from oral solid dosage forms: immediate versus modified
drug-release 7
1.1.4.1 Immediate drug-release dosage forms 7
1.1.4.2 Modified drug-release dosage forms 10
1.2 Solid dosage forms for oral sustained drug-release 15
1.2.1 General principles 15
1.2.2 Multiple-unit dosage forms for sustained drug-release 15 1.2.3 Monolithic dosage forms for sustained drug-release 17
1.2.3.1 Reservoir systems 17
1.2.3.2 Matrix systems 20
1.2.3.3 Osmotic pumps 27
1.2.3.4 Ion exchange systems 29
1.2.4 The special case of hydrophilic matrix systems 30 1.2.4.1 Drug-release mechanisms from hydrophilic matrix systems 30
1.2.4.2 Mathematical analysis of drug-release from hydrophilic matrix systems 36
1.2.5 Excipients used in hydrophilic matrix systems 40
1.2.5.1 Polymers for sustained drug-release systems 40 1.2.5.2 Other excipients in the formulation of matrix tablets 42
1.3 Starch and starch derivatives for sustained drug-release 44
1.3.1 Starch 44
1.3.1.1 Starch constituents and chemical structure 44 1.3.1.2 Starch crystallinity and polymorphic types 47
1.3.1.3 Amylose as simple helices 48
1.3.1.4 Starch behaviour in aqueous solution 49
1.3.1.5 Starch applications 49
1.3.1.6 Modified starches 50
1.3.2 Cross-linked amylose 52
1.3.3 Substituted amylose as a sustained drug-release agent in matrix systems 54 1.3.3.1 Synthesis at laboratory scale and general characteristics 54 1.3.3.2 Performance of amylose substituted by 1,2-epoxypropanol (SA,G-2.7) 57
1.3.4 High-amylose sodium carboxymethyl starch 61
1.3.4.1 High-amylose sodium carboxymethyl starch produced at laboratory scale 62 1.3.4.2 High-amylose sodium carboxymethyl starch produced at pilot scale 63 1.3.4.3 Spray-dried high-amylose sodium carboxymethyl starch 65
1.4 Physiological factors influencing oral drug-absorption 66
1.4.1 Physiology of the gastrointestinal tract 66
1.4.1.1 Oral cavity 69
1.4.1.2 Oesophagus 70
1.4.1.3 Stomach 71
1.4.1.4 Small intestine 72
1.4.1.5 Large intestine 75
1.4.2 Gastrointestinal transit of pharmaceutical dosage form 76
1.4.2.1 Introduction 76
1.4.2.2 Oesophagus 76
1.4.2.4 Small intestine 80
1.4.2.5 Large intestine 81
1.4.3 Barriers to drug absorption 82
1.4.3.1 The environment within the lumen 83
1.4.3.2 Mucus 83
1.4.3.3 Gastrointestinal membrane and drug transport mechanism 84
1.4.3.4 First-pass metabolism 88
1.5 Considerations in the selection of drug candidates for incorporation in
sustained drug-release dosage forms 92
1.5.1 Physicochemical properties of drugs influencing their viability as
candidates for sustained drug-release dosage forms 92
1.5.1.1 Aqueous solubility and dissolution rate 92
1.5.1.2 Partition coefficient and molecular size 95
1.5.1.3 Biopharmaceutical Classification System 97
1.5.1.4 pKa (logarithmic measure of the acid dissociation constant) 98
1.5.1.5 Drug stability 98
1.5.2 Biological and pharmacological properties of drugs influencing their
viability as candidates for sustained drug-release dosage forms 100 1.5.2.1 Size of dose, biological half-life and duration of action 100
1.5.2.2 Absorption properties 101
1.5.2.3 Distribution 102
1.5.2.4 Metabolism 103
1.5.2.5 Safety margin and side effects of the drug 104 1.5.2.6 Therapeutic goal, disease state and circadian rhythm 105
1.6 Pharmacokinetic considerations and analysis in the design of dosage forms 106 1.6.1 Importance of biopharmaceutics, pharmacokinetics and pharmacodynamics 106
1.6.2 Experimental approaches of pharmacokinetics 108
1.6.2.1 Measurement of drug concentrations 108
1.6.2.2 Plasma drug concentrations as a function of time 109
1.6.3 Theoretical aspects of pharmacokinetics 113
1.6.3.2 Compartmental pharmacokinetic models 114
1.6.3.3 Pharmacokinetic parameters 116
1.6.3.4 Estimation of the cumulative relative fraction of drug absorbed after
oral absorption 119
1.6.3.5 Statistics in pharmacokinetic studies 120
1.7 In vitro-in vivo correlations 122
1.7.1 Importance of in vitro-in vivo correlations in the development and
optimization of dosage forms 122
1.7.2 Correlation levels 125
1.7.3 Considerations in dissolution test method development for IVIVC 129
1.7.3.1 Importance of dissolution testing 129
1.7.3.2 Dissolution apparatus selection 130
1.7.3.3 Dissolution test media and methods 133
1.7.3.4 Statistical comparison of dissolution profiles 137 1.7.4 Bioavailability studies for development of IVIVC 138
1.7.5 Evaluation of predictability of IVIVC 140
1.8 References 141
Chapter 2. Objectives
1602.1 General objective 160
2.2 Specific objectives 160
Chapter 3. High-amylose starch matrices for oral sustained drug-release:
In vitro and in vivo evaluation
1633.1 Presentation of the article and contribution of the authors 164
3.2 Abstract 165
3.3 Introduction 165
3.4 Material and methods 167
3.4.1 Materials 167
3.4.3 Drug-release studies 168
3.4.4 Pharmacokinetics in healthy human volunteers 169
3.4.5 High-performance liquid chromatography (HPLC) analysis of plasma samples 170
3.4.6 Pharmacokinetic data analysis 171
3.4.7 IVIVC 172
3.5 Results and discussion 172
3.5.1 In vitro drug-release characteristics from HASCA matrix tablets 172
3.5.2 Pharmacokinetics in healthy human volunteers 176
3.5.3 IVIVC 180
3.6 Conclusion 182
3.7 Acknowledgements 182
3.8 References 182
Chapter 4. High-amylose carboxymethyl starch matrices: development and
characterization of tramadol hydrochloride sustained-release tablets for
oral administration
1854.1 Presentation of the article and contribution of the authors 186
4.2 Abstract 186
4.3 Introduction 187
4.4 Materials and methods 190
4.4.1 Materials 190
4.4.2 Preparation of HASCA tablets 190
4.4.3 Tablets characterization and in vitro drug-release evaluation 192 4.4.4 Modifications to the United States Pharmacopeia (USP) method 194 4.4.5 Statistical analysis and formulations comparison 195
4.5 Results and discussion 195
4.5.1 Measurement of tablet crushing strengths in order to guarantee the reproducibility
of the spray-drying method 195
4.5.2 Formulation screening and development of twice-daily and once-daily SD HASCA formulations with 100 mg and 200 mg of tramadol hydrochloride 196
4.5.3 Decrease of the tablet surface area in order to increase the in vitro release time of tramadol hydrochloride from twice-daily and once-daily SD HASCA
matrix tablets 202
4.5.3.1 Preliminary crushing strengths measurements 204 4.5.3.2 Influence of CF on tramadol hydrochloride release from SD HASCA
tablets 204
4.5.3.3 In vitro release of tramadol hydrochloride from optimal twice-daily and
once-daily SD HASCA matrix tablets 206
4.5.4 In vitro release of tramadol hydrochloride from SD HASCA tablets under
ethanolic conditions 210
4.6 Conclusions 214
4.7 Acknowledgements 214
4.8 References 215
Chapter 5. Spray-dried high-amylose sodium carboxymethyl starch:
impact of α-amylase on drug-release profile
2195.1 Presentation of the article and contribution of the authors 220
5.2 Abstract 220
5.3 Introduction 221
5.4 Materials and methods 223
5.4.1 Materials 223
5.4.2 Preparation of SD HASCA formulations 224
5.4.3 Drug-release evaluation 224
5.4.3.1 Dissolution studies 224
5.4.3.2 Statistical analysis and release profiles comparison 225
5.4.3.3 Drug-release mechanism characterization 226
5.5 Results and discussion 227
5.5.1 Influence of α-amylase and of the residence time in SGF on the drug-release
profiles from SD HASCA tablets 227
5.5.1.2 Residence time in SGF does not significantly affect the drug-release
profiles 234
5.5.2 Contribution of α-amylase-catalyzed erosion to the overall drug-release
mechanism 235
5.6 Conclusions 240
5.7 Acknowledgments 241
5.8 References 241
Chapter 6. General discussion, conclusions and perspectives
2446.1 General discussion 244
6.1.1 Advantages of SD HASCA 244
6.1.2 Influence of pH, gastric residence time, α-amylase and an alcoholic medium on the
drug-release from SD HASCA matrices 247
6.1.3 Factors influencing the gel layer formation and drug-release 251 6.1.4 In vivo studies and establishment of a Level A IVIVC 253 6.1.5 Mechanism controlling drug-release from SD HASCA matrices: Fickian diffusion
versus relaxation/erosion 255
6.2 Conclusions and perspectives 257
6.2.1 Characterization of the gel layer formed by SD HASCA 257 6.2.2 In vivo studies and the establishment of a Level A IVIVC 260 6.2.3 Industrial feasibility of spray drying and the compressive methods used
in this study 261
6.2.3.1 Spray drying 261
6.2.3.2 Tablet compressing machines 262
6.2.4 Other possible studies 263
List of tables
Table 1.1 Diffusional exponent for drug-release (n) and associated drug-release mechanism from polymeric sustained delivery systems. Table reproduced from (Peppas and Sahlin
1989) with permission of Elsevier Ltd. 37
Table 1.2 Examples of substances used as excipients in tablet formulation (Alderborn 2002;
Kottke and Rudnic 2002). 42
Table 1.3 Biological and physical parameters of the human gastrointestinal tract (approximate
values) (Daugherty and Mrsny 1999; Ashford 2002). 70
Table 1.4 Levels of approximate solubilities. 95
Table 1.5 Biopharmaceutical Classification System (BCS). 97 Table 3.1 pH gradient conditions used to simulate various possibilities of gastric pHs and
residence times encountered by HASCA matrices during their gastrointestinal
transit. 169
Table 3.2 Pharmacokinetic parameters of acetaminophen (mean ± SD and %CV) following oral administration of the HASCA SR formulation and the IR tablet. 178 Table 4.1 SD HASCA tablets formulation, press used, target CF and thickness and selected
twice-daily and once-daily tablets. 191
Table 4.2 Time to release 50% (T50%) and 90% (T90%) of drug from SD HASCA tablets with total weights between 400 mg and 800 mg, and % of drug (w/w) between 12.5%
and 60%. 197
Table 4.3 Time to release 50% and 90% of tramadol hydrochloride [T50%, T90%] from twice-daily (every 12 hours) and once-daily (every 24 hours) commercially SR formulations and SD HASCA formulations (produced with the SSP), with 100 mg and 200 mg of drug. Release-times are presented in hours. 201 Table 4.4 Time to release 50% and 90% of tramadol hydrochloride [T50%, T90%] for SD
HASCA tablets compressed at different CF between 1 and 2.5 tons/cm2 and similarity factors (f2) between tablets weighting 700-mg tablets with 100 mg of tramadol hydrochloride, compressed with a 30-tons manual HP at different CF. 205 Table 4.5 Time to release 50% and 90% (hours) of tramadol hydrochloride [T50%, T90%]
compressed using a 30-tons manual hydraulic press at 2.5 tons/cm2 (HP) or a
single-stroke press (SSP). 209
Table 5.1 Similarity factors (f2) between the release profiles from Acetaminophen SR and
Tramadol SR at different α-amylase concentrations. 232
Table 5.2 Similarity factors (f2) between the release profiles from Acetaminophen SR and Tramadol SR at different residence times in simulated gastric fluid (pH 1.2). 235 Table 5.3 Values of 2a/l, Aspect Ratio (where 2a is the diameter and l is the thickness of the
tablet); m, the estimated Fickian diffusion exponent; k2/k1, the erosion and diffusion kinetic constants ratio) and R2, the correlation coefficient, for Acetaminophen SR and Tramadol SR, the two residence times in the acidic medium and the three α-amylase
concentrations tested. 236
Table 5.4 Time at which R/F became equal or superior to 1, for the residence times in the simulated gastric fluid (pH 1.2) and the α-amylase concentrations tested. 239
List of figures
Figure 1.1 Representation of the three phases between drug administration and the attainment of the therapeutic effect: the biopharmaceutical phase, the pharmacokinetic phase, and
the pharmacodynamic phase. 5
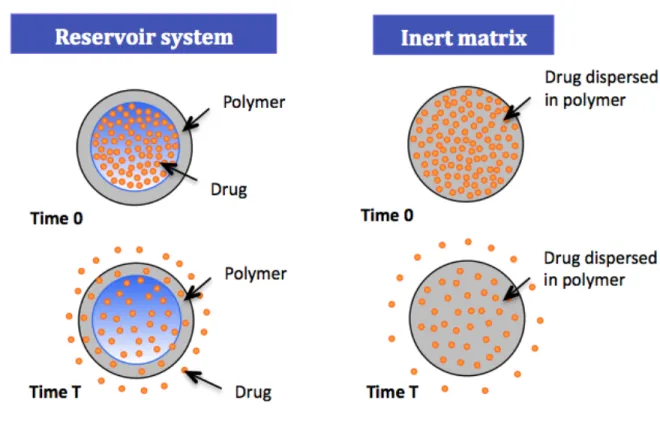
Figure 1.2 Difference between the plasma drug concentrations versus time profiles for immediate-release and sustained-release dosage forms. 8 Figure 1.3 Diffusion of drug across the polymeric membrane of a reservoir system and across
an inert matrix system. 18
Figure 1.4 Drug-release in function of the type of matrix system. The blue represents the initial size of the matrix with drug; the yellow represents the region of the polymeric matrix with the remaining drug; the gray represents the swollen matrix; and the arrows
represent the diffusing drug. 21
Figure 1.5 Elementary osmotic pump with a solid osmotic core, a semipermeable membrane and, in this example, a single hole drilled through the membrane. Figure reproduced from (Simó, Cifuentes et al. 2003) with permission from Elsevier Ltd. 27 Figure 1.6 Osmotic pump consisting of an osmotically active bilayer core enclosed in a
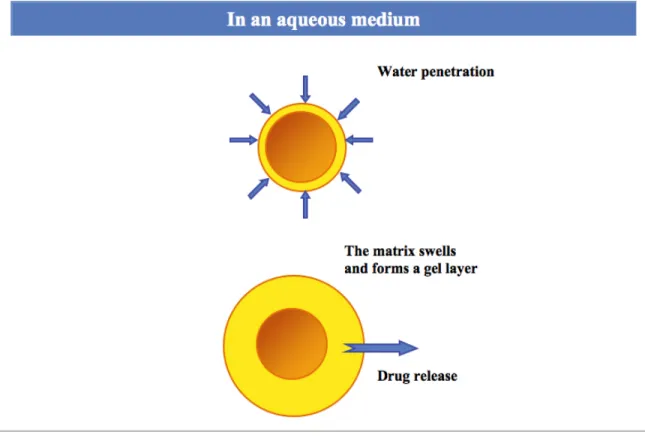
semipermeable tablet shell membrane, which is permeable to water, but not the drug or osmotic components, and has a laser-drilled orifice on the drug-layer side of the tablet. The bilayer core is comprised of a drug layer and a push layer. Figure reproduced from (Palangio, Northfelt et al. 2002) with permission from Elsevier Ltd. 28 Figure 1.7 Schematic representation of drug-release from hydrophilic polymer matrix
tablets. 32
Figure 1.8 Fronts in the swelling process (swelling, diffusion and erosion) of hydrophilic matrices during drug-release. The behaviour of the gel layer was studied using a colorimetric technique. HPMC matrices containing soluble and coloured buflomedil pyridoxal phosphate were prepared by wet granulation. Swelling studies were performed by clamping each matrix between two transparent Plexiglas® disks and the assembled device was introduced into the vessel of a USP 23 apparatus 2 containing distilled water (37ºC, 200 rpm). At fixed times during swelling, the device was taken out of the vessel and pictures of the disc matrix base were video-recorded. The front
distance was then measured in pixels and these were converted into length units. Figure adapted from (Colombo, Bettini et al. 1999) with permission of Elsevier
Ltd. 33
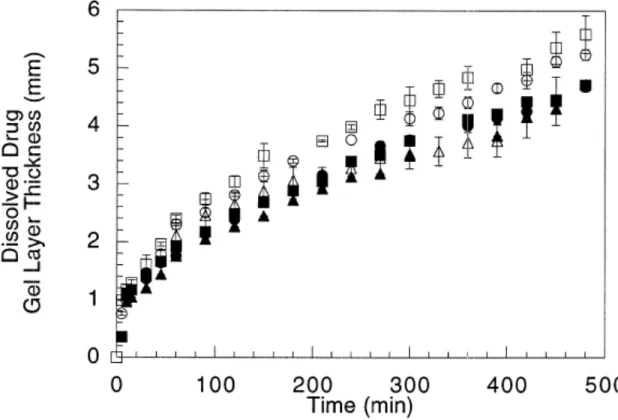
Figure 1.9 Gel layer thickness as a function of time for HPMC matrices containing different percentages of buflomedil pyridoxal phosphate, using the same conditions of Figure 1.8. Figure reproduced from (Colombo, Bettini et al. 1999) with permission of Elsevier
Ltd. 35
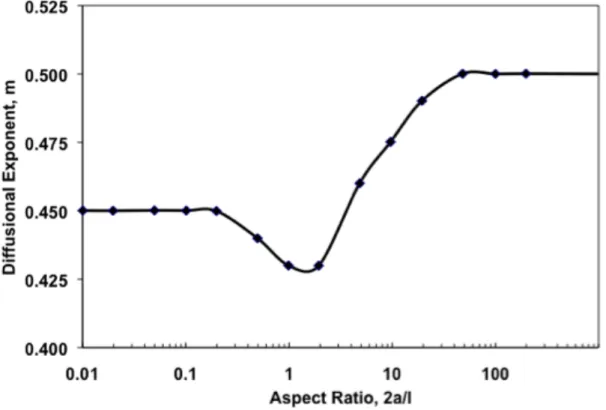
Figure 1.10 Variation of the Fickian diffusional exponent, m, with the aspect ratio, 2a/l, where 2a is the diameter and l is the thickness (height) of the device. Figure reproduced from (Peppas and Sahlin 1989) with permission of Elsevier Ltd. 39 Figure 1.11 Schematic representation of the linear amylose macromolecule with its
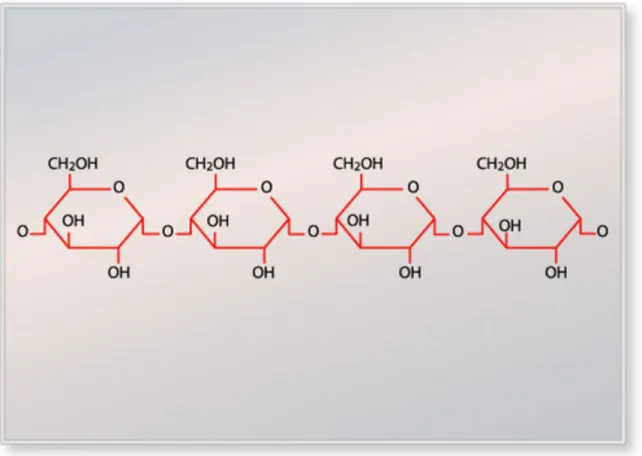
α-(1→4)-linked D-glucose units. 45
Figure 1.12 Schematic representation of the branched amylopectin macromolecule with its α-(1→4)-linked D-glucose backbones, interlinked by α-(1→6)-linkages. 46 Figure 1.13 Comparison of units cells and helix packing in A- and B-amylose. Reproduced
from (Hsien-Chih and Sarko 1978) with permission of Elsevier Ltd. 48 Figure 1.14 General representation of the synthesis of SA polymers at laboratory scale. 55 Figure 1.15 Release rate of acetaminophen from SA,G-2.7 matrices (compressed at CF
between 0.5 and 5.0 tons) as a function of dissolution time, showing a nearly constant release from approximately 1 h to 6 h, and three different regions for the drug-release rates. Figure reproduced from (Moghadam, Wang et al. 2007) with permission
of Elsevier Ltd. 58
Figure 1.16 Reaction of substitution of amylose by sodium chloroacetate. 61 Figure 1.17 General anatomy of gastrointestinal tract. Figure reproduced from (MacFarlane
and Stover 2008) with permission of Elsevier Ltd. 68
Figure 1.18 Epithelium, lamina propria and villi in the jejunal mucosa. Figure reproduced from (Moghaddami, Cummins et al. 1998) with permission of Elsevier Ltd. 73 Figure 1.19 Schematic representation of the interdigestive motility pattern, frequency of
contraction forces during each phase and average time period for each phase. Figure reproduced from (Prajapati, Jani et al. 2013) with permission of Elsevier Ltd. 77
Figure 1.20 Fluid mosaic model of cell membranes (epithelial and other cell membranes) with the integral and peripheral proteins embedded in the phospholipid bilayer. Figure reproduced from (Fry 2007) with permission of Elsevier Ltd. 84 Figure 1.21 Passive transport (simple diffusion or diffusion via pores) and carrier-mediated
transport (facilitated diffusion and active transport) across the plasma membrane. Figure reproduced from (Baynes and Riviere 2010) with permission of Elsevier
Ltd. 85
Figure 1.22 Pathways of epithelial permeability. Transcellular permeability is associated with solute or water movement through intestinal epithelial cells. Paracellular permeability is associated with movement in the intercellular space between epithelial cells and is regulated by tight junctions (one of the components responsible for the contact between epithelial cells and for the regulation of transport between extracellular and intracellular space). Figure reproduced from (Groschwitz and Hogan 2009) with
permission of Elsevier Ltd. 86
Figure 1.23 Main metabolic pathways of tramadol. The main compounds responsible for tramadol analgesia are marked in bold. Figure reproduced from (Leppert 2011) with
permission of Karger Publishers. 90
Figure 1.24 Typical plasma drug concentration versus time after oral administration of a conventional dosage form, representing the maximum concentration in plasma, Cmax, the time to reach the maximum concentration, Tmax, the therapeutic range, the MTC and the MEC, the onset time and the duration of action. 111 Figure 1.25 Plasma concentration versus time profile of acetaminophen in one volunteer after
an intravenous single dose. Figure reproduced from (Ing-Lorenzini, Desmeules et al.
2009) with permission of Elsevier Ltd. 112
Figure 1.26 Schematic representations of one-, two-, and three-compartment models. 116 Figure 1.27 Graphical illustration of the application of the trapezoidal rule to numerically
estimate the AUC for first-order absorption data. Figure reproduced from (Byers and
Sarver 2009) with permission of Elsevier Ltd. 118
Figure 1.28 Example of Level A IVIVC. (A) In vitro dissolution profiles of slow (:), medium (:), and fast (:) drug formulations. (B) In vivo studies provide plasma drug concentration of each formulation (gray lines), which can be converted to fractional
absorption profile (black lines) by deconvolution. (C) Level A IVIVC can be derived from the fractional dissolution in vitro and the fractional absorption in vivo. Figure reproduced from (Lu, Kim et al. 2011) with permission of Elsevier Ltd. 126 Figure 1.29 Example of Level B (A) and Level C (B) IVIVC. Figure reproduced from (Lu,
Kim et al. 2011) with permission of Elsevier Ltd. 127
Figure 1.30 Schematic representation of Apparatus 1 (rotating basket) and Apparatus 2
(paddle assembly) dissolution vessels. 132
Figure 3.1 Cumulative percent of acetaminophen released in vitro from HASCA matrices containing 40% of drug and increasing concentrations of NaCl (: 17.5% of NaCl, :
22.5% of NaCl, : 27.5% of NaCl). 173
Figure 3.2 Cumulative percentage of acetaminophen released in vitro from optimized HASCA matrices (32.5% of HASCA, 40% of acetaminophen, and 27.5% of NaCl) in pH gradients with different acidic pH conditions (: 10 min at pH 1.2, : 1 hr at pH 1.2, : 3 hrs at pH 3.5, : 6 hrs at pH 4.5, : no acidic medium). 175 Figure 3.3 Acetaminophen plasma concentration (expressed in µg/mL/kg) vs. time profiles
(mean ± SD) following oral administration of the HASCA SR formulation () and the
commercial IR tablet (). 177
Figure 3.4 Cumulative percentage (mean ± SD) of acetaminophen absorbed following the oral administration of HASCA SR matrix tablets to 5 healthy volunteers. 179 Figure 3.5 IVIVC plot for HASCA SR matrix tablets administered to 5 healthy volunteers (:
volunteer 1, : volunteer 2, ×: volunteer 3, : volunteer 4, : volunteer 5, ⎯⎯:
average, - - - - -: linear). 181
Figure 4.1 Plastic cage used in the dissolution experiments to avoid eventual adhesion to the
vessel or floating. 193
Figure 4.2 Cumulative % of tramadol hydrochloride released in vitro from once-daily commercial formulations (: Tridural® 100 mg, : Tridural® 200 mg, : Ralivia®
200 mg, : Zytram® XL 200 mg). 200
Figure 4.3 Cumulative percentage of tramadol hydrochloride released in vitro from once-daily SD HASCA formulations compressed using a single-stroke press machine (SSP), and once-daily commercial formulations (: 700-mg tablets with 100 mg of drug, :
800-mg tablets with 200 800-mg of drug, : Tridural® 100 mg, and : Tridural® 200 mg). Tests were performed with the tablets placed inside a cage. f2 values: 70.66 between 700-mg tablets with 100 mg and Tridural® 100 mg, 79.80 between 800-mg tablets with 200 mg and Tridural® 200 mg, 93.14 between 700-mg tablets with 100 mg and 800-mg
tablets with 200 mg. 207
Figure 4.4 Cumulative percentage of tramadol hydrochloride released in vitro from twice-daily SD HASCA formulations, compressed with the single-stroke press machine, and twice-daily commercial formulations (: 450-mg tablets with 100 mg of drug, : 500-mg tablets with 200 mg of drug, : Topalgic® LP 100 mg, and : Topalgic® LP 200 mg). Tests were performed with the tablets placed inside a cage. f2 values: 54.52 between 450-mg tablets with 100 mg and Topalgic® LP 100 mg, 52.36 between 500-mg tablets with 200 500-mg of drug and Topalgic® LP 200 mg, 88.01 between 450-mg tablets with 100 mg and 500-mg tablets with 200 mg of drug. 208 Figure 4.5 Cumulative percentage of tramadol hydrochloride released in vitro from once-daily
SD HASCA tablets with 100 mg of drug and once-daily commercial formulations with 100 mg of drug in a pH gradient versus a 40% ethanol hydro-alcoholic medium (: SD HASCA with 100 mg in a pH gradient, : Tridural® 100 mg in a pH gradient, : SD HASCA with 100 mg in a 40% ethanolic medium : Tridural® 100 mg in a 40% ethanolic medium. f2 values: 70.66 between 700-mg tablets with 100 mg of drug and Tridural® 100 mg in pH gradient, 88.51 between 700-mg tablets with 100 mg of drug and Tridural® 100 mg in a 40% ethanol hydro-alcoholic medium. 211 Figure 4.6 700-mg tablets with 100 mg of tramadol hydrochloride in: (a) pH gradient and (b)
40% ethanol hydro-alcoholic medium (b); Tridural® 100 mg in: (c) pH gradient and (d)
40% ethanol hydro-alcoholic medium. 213
Figure 5.1 (A) Effect of α-amylase concentration on the release of acetaminophen from Acetaminophen SR in a simulated gastrointestinal pH, where the residence time in simulated gastric fluid (pH 1.2) was 1 h, and the concentrations of α-amylase in simulated intestinal fluid (pH 6.8) were: 0 IU/L (dashed line), 5000 IU/L (dotted line)
Figure 5.1 (B) Effect of α-amylase concentration on the in vitro release of acetaminophen from Acetaminophen SR in a simulated gastrointestinal pH, where the residence time in simulated gastric fluid (pH 1.2) was 3 h, and the concentrations of α-amylase in simulated intestinal fluid (pH 6.8) were: 0 IU/L (dashed line), 5000 IU/L (dotted line)
and 20000 IU/L (continuous line). 229
Figure 5.2 (A) Effect of α-amylase concentration on the in vitro release of tramadol hydrochloride from Tramadol SR in a simulated gastrointestinal pH, where the residence time in simulated gastric fluid (pH 1.2) was 1 h, and the concentrations of α-amylase in simulated intestinal fluid (pH 6.8) were: 0 IU/L (dashed line), 5000 IU/L
(dotted line) and 20000 IU/L (continuous line). 230
Figure 5.2 (B) Effect of α-amylase concentration on the in vitro release of tramadol hydrochloride from Tramadol SR in a simulated gastrointestinal pH, where the residence time in simulated gastric fluid (pH 1.2) was 3 h, and the concentrations of α-amylase in simulated intestinal fluid (pH 6.8) were: 0 IU/L (dashed line), 5000 IU/L
(dotted line) and 20000 IU/L (continuous line). 231
Figure 5.3 Acetaminophen-release rate from Acetaminophen SR tablets exposed 1 h to simulated gastric fluid (pH 1.2), and 3 h to simulated intestinal fluid (pH 6.8) with 0 IU/L (dashed line), 5000 IU/L (dotted line) and 20000 IU/L (continuous line) of α-amylase. The arrows represent the time at which the tablets were placed (1 h) and were
withdrawn (4 h) from the medium with α-amylase. 238
Figure 6.1 Cumulative percent of acetaminophen released in vitro from : SD HASCA matrices containing 40% of acetaminophen, 27.5% of NaCl and 32.5% of polymer; : HPMC matrices containing 40% of acetaminophen, 27.5% of NaCl and 32.5% of polymer; and from : HPMC matrices containing 40% of acetaminophen, 0% of NaCl and 60% of polymer. The number of replicates was three. 247 Figure 6.2 600-mg SD HASCA tablet matrices (40% acetaminophen, 27.5% NaCl, 32.5% SD
HASCA) after immersion in a pH gradient simulation the pH evolution of the gastrointestinal tract (pH 1.2 for 1 h, pH 6.8 for 3 h, and pH 7.4 until the end of the dissolution test): a) 16 h of immersion (gel layer formation), and b) 22 h of immersion
(total hydration of the matrix). Figure reproduced from (Brouillet, Bataille et al. 2008)
List of initials and abbreviations
ADME: absorption, distribution, metabolism and excretion AUC: area under the plasma concentration-time curve BCS: Biopharmaceutical Classification System CF: compression force(s)
CL: clearance
Cmax: maximum drug concentration in plasma CMC: sodium carboxymethyl cellulose
CM-HAS: high-amylose sodium carboxymethyl starch with higher degree of substitution CR: controlled-release
CYP: cytochrome P450
Doct: octanol/water distribution coefficient at pH 7.4 DS: degree of substitution
ED50: minimum effective dose for 50% of the population
EMEA: European Agency for the Evaluation of Medical Products FDA: Food and Drug Administration
FIP: International Pharmaceutical Federation
HASCA: high-amylose sodium carboxymethyl starch HCl: hydrochloric acid
HEC: hydroxyethyl cellulose HP: hydraulic press
HPC: hydroxypropyl cellulose
HPLC: high-performance liquid chromatography HPMC: hydroxypropyl methylcellulose
IR: immediate-release
IVIVC: in vitro-in vivo correlation(s) IVIVR: in vitro-in vivo relationship(s) k: elimination rate constant of the drug ka: absorption rate constant of the drug Ka: dissociation constant
LADME: liberation, absorption, distribution, metabolism and excretion LC: liquid chromatography
MC: mass spectrometer
MDR1: multidrug resistance 1 gene MDTvitro: mean in vitro dissolution time MDTvivo: mean in vivo dissolution time MEC: minimum effective concentration MMC: migrating motor complex
MR: modified-release
MRT: mean in vivo residence time MTC: minimum toxic concentration NaCl: sodium chloride
NMR: nuclear magnetic resonance PD: pharmacodynamics
Pg-p: P-glycoprotein PK: pharmacokinetics
pKa: logarithmic measure of the acid dissociation Poct: octanol/water partition coefficient
SA: substituted amylose
SA,CA-n: substituted amylose polymers substituted with chloroacetate SA,G-n: substituted amylose polymers substituted with glycidol
SA,R-n: substituted amylose polymers, where R represents the substituent and n the degree of substitution
SA/V: surface area/volume SD: standard deviation SD: spray-dried
SD HASCA: spray-dried high-amylose sodium carboxymethyl starch SEM: scanning electron microscopy
SGF: simulated gastric fluid SIF: simulated intestinal fluid SR: sustained-release
SSP: single-stroke press SULT: sulfotransferase
SUPAC: scale-up and post-approval changes t1/2: elimination half-life
TD50: toxic dose of drug for 50% of the population
Tmax: period of time required to achieve the maximum drug concentration in plasma TT: tablet thickness
TW: tablet weight
UDP: uridine diphosphate
UGT: UDP-glucuronosyltransferase USP: United States Pharmacopeia
Vd: apparent volume of distribution of a drug XRD: X-ray diffraction
Acknowledgements
First of all, I would like to express my sincere gratitude to my first director of research, Prof. Louis Cartilier, for his assistance and guidance, his confidence and his encouragement.
I would also like to thank Prof. Grégoire Leclair for having accepted to become my new director and for his guidance during the last two years, without which finishing this PhD would have never been possible.
I would like to express my sincere gratitude to the members of the jury.
I gratefully acknowledge the generous scholarship support of Fundação para a Ciência e Tecnologia (Portugal).
Thank you Prof. Pedro Amores da Silva for being the co-director at the begging of this PhD, for helping me with the first contacts at University of Montréal and for your trust and support.
Furthermore, I would like to thank all the students of the laboratory of Professor Cartilier, in particular to Fabien Brouillet for all the well appreciated support, and to Salma Abdelaziz for helping me with the sampling in the early-morning hours, allowing me to avoid spending 36 hours or more with no sleep, but also to Shadi Moghadam and Hong Wei Wang for their kind patience to answer my questions.
I thank the co-authors of the papers produced during this PhD for their collaboration, in particular to Soula Kyriacos who was responsible for the clinical tests.
I would also like to thank all the members of the other laboratories of the faculty, in particular to Prof. Hildgen and to Jean Michel Rabanel for the endless help in the purchase of materials.
I thank the administrative and support staff of the Faculty, especially Mrs. Andrée Mathieu, Lucie Racine and Josée Desrochers for facilitating my work both administratively and technically, and always with a smile.
Thank you so much to all my great friends in Montreal for making all these years so special and fun and for putting up with my bad temper.
Also, I would like to thank Jeanne Leblond Chain and all the students and members of the Group Meeting Axe Formulation for proofreading my papers and for their helpful suggestions.
Last but not least, I wish to express my deepest gratitude to my parents for their endless love and support.
1.1 Pharmaceutical dosage forms intended to oral drug
administration
1.1.1. General principles
The general objective of the administration of a pharmaceutical dosage form is to deliver an adequate dose of drug to a pharmacological target, so that a predictable therapeutic response to the drug (or drugs) included in the dosage form, which can be to prevent, cure or control a determined diagnosed pathological state, can be achieved. There are numerous dosage forms into which a drug can be incorporated in order to achieve a suitable and effective treatment of a disease.
The first requirement to take into consideration when formulating a new oral dosage form is a good knowledge of the pathway and the vast anatomical and physiological dissimilarities that the dosage form and the drug it contains will encounter during their passage throughout the gastrointestinal tract and until the drug reaches its target, so that an adequate pharmacokinetic and pharmacodynamic profile is attained. Moreover, the physicochemical and biological properties of the drug, the design of the dosage form, the drug-release mechanism and the particular disease factors are other factors that can influence the bioavailability of a drug and interact with one another. Dosage forms are also subject to intra- and inter-patient variability. Therefore, the delivery of an adequate dose of drug to a pharmacological target remains a major challenge in the development of new pharmaceutical dosage forms.
Dosage forms are constituted of two main components: pharmaceutical drugs (or active ingredients) and excipients (also called auxiliary substances or additives). A dosage form can comprise one or several drugs (Le Hir, Chaumeil et al. 2009). A pharmaceutical drug is a substance intended to exert a pharmacological activity. In addition to being used in the treatment and prevention of a determined disease, a drug can also be used in the medical diagnosis of a disease. The excipients are the components in the dosage form, or used in its
manufacturing process, which do not possess any pharmacological activity. Initially, the excipients were merely inactive substances used as vehicles or diluents for drugs and/or included in a pharmaceutical dosage form for varied and specialized pharmaceutical functions such as preserve, solubilise, suspend, modify dissolution, improve the compressibility, thicken, flavour and/or colour drug products (York 2002). Above all, they aim to improve the physicochemical properties of the drug in the dosage form, and ensure that the drug substance remains active and stable for a sufficiently long period of time. However, excipients have progressed and, although they are still necessary for their original functions, some are used nowadays in the control of drug action, contributing, as a result, to the improvement of drug efficacy in the human body.
Dosage forms can be designed for administration by diverse routes of administration to maximize therapeutic response. Depending on the route of administration and the type of formulation, different excipients may be used. The numerous excipients used in the formulation of dosage forms can also be explained by the large variety of physicochemical characteristics of drugs (Le Hir, Chaumeil et al. 2009).
The relationship between the drug, its dosage form and the route by which it is administered governs how much of the drug and how fast it enters the systemic circulation (Ashford 2002). Some routes, such as the parental routes (intravenous, intramuscular, intrathecal, subcutaneous…), imply the irruption of physiological barriers, and others such as the oral, the topical and the transmucosal (ocular, nasal, buccal, pulmonary, rectal, vaginal…) routes, among many others, do not imply the irruption of any physiological barriers.
The present thesis is focused on the development and evaluation of a novel excipient for oral sustained-release (SR) dosage forms. Besides the oral route, the intravenous route was also used in a clinical study using human volunteers. Therefore, only these two routes, and in particular the oral, will be described.
If a drug is given intravenously it is administered directly into the bloodstream, and thus the entire amount of drug administered reaches the systemic circulation and is available for distribution into other body tissues and the site(s) of action of the drug. On the other hand, if a drug is administered by a route other than the intravenous, there is no guarantee that the entire dose will reach the systemic circulation, because all routes of administration where a systemic action is required, apart from the intravenous, involve the absorption of the drug into
the blood from the route of administration (Ashford 2002). Nonetheless, the intravenous route has its disadvantages, for instance, patients are not typically able to self-administer, it passes most of the natural defences of the body, and it can carry fatal air boluses.
Among the routes of administration that require an absorption step, the oral route is by far the most popular for administration of drugs intended for systemic action because it presents certain advantages (Le Hir, Chaumeil et al. 2009), which will be described in the next section.
1.1.2. Oral drug administration
Compared with other routes of administration, the oral route is the simplest, the most natural and convenient for the patient (non-invasive), and usually the safest and least expensive means of drug administration (Kokate, Marasanapalle et al. 2005; Le Hir, Chaumeil et al. 2009). The oral route also allows the administration of high doses of drug with only a single administration (Aiache, Aiache et al. 2001). It is estimated that currently about 90% of pharmaceutical dosage forms are administered orally (Kokate, Marasanapalle et al. 2005), being about 80% of the pharmaceutical forms administered by the oral route solid dosage forms (tablets, capsules…) (Jivraj, Martini et al. 2000). Although oral dosage forms are essentially intended for absorption into the bloodstream through the various epithelia and mucosa of the gastrointestinal tract, a few are destined to produce a local effect in the tract, such as a temporarily increase of the pH of the stomach.
The pharmacokinetic properties of the oral route of administration are the result of the great variability of environmental conditions and obstacles that the drug will encounter along the gastrointestinal tract, during its passage through the gastrointestinal membrane into the bloodstream as well as during its passage through the liver. In fact, the relatively slow onset of action after administration, the possibilities of reduced and irregular absorption and the biodegradation of certain drugs by the enzymes and secretions of the gastrointestinal tract constitute some of the disadvantages of this route of administration (York 2002). Other disadvantages are a potential altered bioavailability caused by drug and food interactions, the modification of the contents and microflora of the gastrointestinal tract by unabsorbed drug
and the occurrence of eventual nausea or gastrointestinal tract discomfort due to drugs that cause local irritation (Shargel, Wu-Pong et al. 2004).
The progression of a drug in the body is a dynamic process that leads to the therapeutic effect of the same. After oral ingestion, the dosage form moves along the oesophagus towards the stomach. Then, it remains in the stomach until it can pass the pylorus and be transferred to the small intestine, where most of drugs are absorbed. The distinct phenomena that take place in the gastrointestinal tract after drug administration and may influence the bioavailability of drugs administered orally must be taken into consideration when designing a new oral dosage form. Indeed, in order to have the desired pharmacotherapeutic effect, it is necessary that the dosage form be able to deliver the drug to the section(s) of the gastrointestinal tract where it can be absorbed and assure that the drug is available in the body in a form that permits its absorption and passage into the systemic circulation. However, many factors can contribute to a decrease of the bioavailability of an orally administered drug. These factors include anything that adversely affects the release of the drug from the dosage form, its dissolution into the gastrointestinal tract fluids, its stability in solution in the same fluids, its passage through and stability in the gastrointestinal tract membrane, and its passage through the liver into the systemic circulation (Ashford 2002). After crossing the gastrointestinal tract membrane, drugs pass into the hepatic portal system and through the liver before they are transported via the bloodstream to its target site. Consequently, the amount of an oral dose of drug that reaches the systemic circulation can also be decreased by first-pass or presystemic metabolism by the gastrointestinal tract membrane and/or the liver. The factors contributing to a decrease of the amount of an orally administered drug that reaches the systemic circulation will be detailed in a following section.
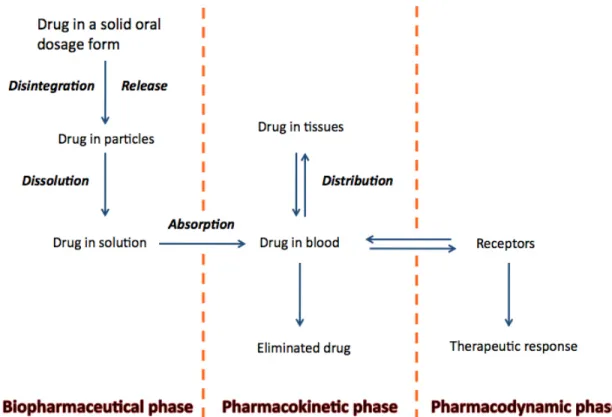
The different stages between drug administration and the attainment of the therapeutic effect are generally described as a series of three phases: the biopharmaceutical phase, the pharmacokinetic phase, and the pharmacodynamic phase (Figure 1.1).
Figure 1.1 Representation of the three phases between drug administration and the attainment of the therapeutic effect: the biopharmaceutical phase, the pharmacokinetic phase, and the pharmacodynamic phase.
1.1.3. Pharmaceutical oral dosage forms
The dosage forms administered orally can be classified into two major categories (Aiache, Aiache et al. 2001):
1. Liquid forms, which include solutions, syrups, suspensions and emulsions.
2. Solid forms, which include tablets, powders, granules, pills, capsules (hard and soft gelatine capsules) and suppositories (suppositories may be also classified as semi-solid dosage forms).
The most popular oral dosage forms are tablets, capsules, suspensions, solutions and emulsions (York 2002). Although tablets and capsules are more widely used than liquid preparations for oral administration, the latter possess some advantages relatively to solid
dosage forms. These advantages include, among others, the immediate availability for absorption, as the drug must be in solution to be absorbed, leading to a faster therapeutic effect, if required. Liquids are easier to swallow than solids and are, therefore, particularly suitable for paediatric and geriatric use. In addition, the administration of a solution of a drug is less likely to cause irritation and damage of the gastric mucosa by certain drugs because of the immediate dilution by the gastric contents (Billany 2002). However, these dosage forms also present some disadvantages, compared with solid dosage forms, which are related, mostly, to the storage, transport and stability of the ingredients in aqueous solution (both drugs and excipients), which are more susceptible to hydrolysis and to growth of microorganisms in solution, and to the administration of solutions, i.e., taste and lower accuracy of each dosage (Billany 2002).
Tablets are the most common solid dosage forms, and contain each a single dose of one or more drugs as well as one or more excipients. They are obtained by compression of uniform volumes of a mixture of powders held within a confined space. Depending on the type of tablet, they can be swallowed in one piece or split, chewed, dissolved or dispersed in water before administration, or retained in the mouth, where the drug is released (Alderborn 2002; Kottke and Rudnic 2002). Tablets present several advantages, including (Jivraj, Martini et al. 2000; Aiache, Aiache et al. 2001; Alderborn 2002; Ashford 2002):
1. It represents a convenient and safe way of drug administration, leading to an improvement of the patient compliance.
2. It is relatively easy to manufacture and transport solid oral dosage forms, as they do not need to be sterilized, are compact, and can be produced in large quantities by automated machines, allowing robust and quality-controlled production procedures at a relatively low price. Tablets can also be prepared in a versatile way with respect to their use and to the delivery of the drug.
3. Oral solid dosage forms, especially the ones in the dry and condensed form, are generally physically and chemically more stable, allowing a longer stability of the comprised ingredients, including drugs.
4. The preparation procedure enables accurate dosing of the drug per single dose and administration of larger amounts of drug in a restricted volume.
When a solid dosage form is administered orally, the first step to make the drug available is its release from the dosage form. This release can be immediate or modified. The drug-release mechanism states the dissolution of the drug and, consequently, has an effect on its absorption and pharmacokinetics.
1.1.4. Drug-release from oral solid dosage forms: immediate versus
modified drug-release
The drug-release characteristics of a dosage form generally have a major effect on the therapeutic efficacy of the delivered drug. Based on their drug-release characteristics, tablets can be classified into two main types, immediate-release (IR) and modified-release (MR).
1.1.4.1 Immediate drug-release dosage forms
IR or ‘conventional’ tablets are designed to release the complete dose of drug contained within the dosage form, immediately following administration, i.e., the goal of this formulation is fast and complete drug-release in vivo, providing only a single and transient burst of drug. The released drug is assumed to be in a form that is therapeutically active and immediately available for absorption into the systemic circulation (Alderborn 2002; Collett and Moreton 2002). The fast release of drugs from IR tablets is achieved by fragmentation of the whole structure of the dosage form. When the tablet comes into contact with the fluids of the gastrointestinal tract, the liquid wets the solid and penetrates its pores. Consequently, the tablet disintegrates into granules or aggregates of primary particles, which subsequently deaggregate into their primarily drug particles. A deaggregation directly into fine particles will set up conditions for the fastest dissolution of the drug (Leblanc, Aiache et al. 1997; Alderborn 2002; Hoener and Benet 2002). However, drug dissolution can start before the complete fragmentation of the tablet. After the drug is in solution in the gastrointestinal tract, absorption may take place. The rate-limiting step in the dissolution process can be either the rate of disintegration of the dosage form and the size of the resulting aggregates or the deaggregation
process (Hoener and Benet 2002). A disintegrant is usually included in the formulation of IR tablets to ensure that the tablet, when in contact with a liquid, breaks up into small fragments, promoting rapid drug dissolution. The two main mechanisms of action of disintegrants are (Alderborn 2002; Kottke and Rudnic 2002):
1. The promotion of liquid penetration into the pores of the tablet, resulting in the tablet breaking into fragments.
2. The induction of the rupture of the tablet by swelling of the disintegrating particles when in contact with liquids, by formation of gas or by enzymatic action. The smaller the primary particles obtained are, i.e., the larger the effective surface area, the faster will be the dissolution of the drug.
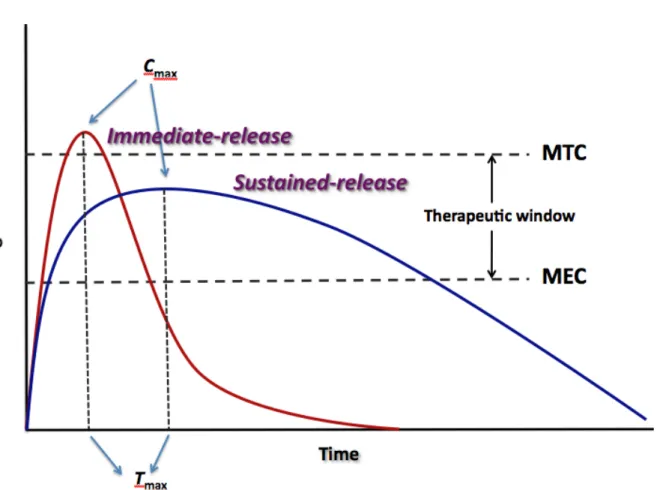
Figure 1.2 Difference between the plasma drug concentrations versus time profiles for immediate-release and sustained-release dosage forms.
The pharmacokinetic behaviour of IR dosage forms consists generally of a fast increase of the plasma drug concentration until a maximum is attained (high maximum concentration, Cmax, and short time to reach the maximum concentration, Tmax) followed by the decaying of the plasma concentration corresponding to the elimination phase.
For most drugs there is an optimum plasma concentration range, usually known as therapeutic window or therapeutic range within which desired therapeutic effects are achieved. The therapeutic window lies between the MEC and the MTC (Figure 1.2), which represent the minimum effective (or therapeutic) concentration and minimum toxic concentration of drug, respectively. The minimum effective concentration is the minimum concentration of drug that has to be achieved in the plasma for the desired therapeutic or pharmacological effect to be elicited. The minimum toxic concentration is the concentration of drug in the plasma above which side effects or toxic effects occur.
For many diseases, the ideal dosage regimen is that by which an optimum therapeutic concentration of drug in the blood plasma, and hence at the site(s) of action of the drug, is attained immediately and then maintained as stable as possible within the therapeutic window for the desired duration of the treatment. Provided dose size and frequency of administration are correct, plasma concentrations of a certain drug lying within its therapeutic window can be achieved promptly and maintained by means of multiple administrations of IR oral dosage forms (Collett and Moreton 2002). Nonetheless, this dosage regimen has a few limitations. When IR dosage forms are administered, the plasma concentration-time profile of a drug fluctuates over successive dosing intervals, even when the 'steady-state' condition (when the overall rate of drug supply equals the overall rate of drug elimination from the body) is achieved. As long as the amount of drug is above the minimum effective concentration, a pharmacological response is observed. However, it is not possible to maintain a stable drug concentration within the therapeutic window for the duration of treatment. In addition, these fluctuations can lead to a patient being undermedicated or overmedicated for periods of time. The first situation happens if, following the oral administration of equal doses of a drug, the interval between each administered dose is longer than the time required for complete elimination of the previous dose. In this case, the plasma concentration-time profile corresponds to a series of isolated single-dose profiles and the plasma concentration only lies within the therapeutic window of the drug for a relatively short period following the
administration of each dose. On the other hand, if the time interval between successive equal doses is less than that required for complete elimination of the previous absorbed dose, overmedication leading to eventual toxicity may occur due to accumulation of the drug in the body and plasma following successively administered doses (Proudfoot 2002). These limitations are even more significant for drugs with short biological half-lives, because of their more frequent dosing constraint, which makes it more difficult to keep plasma concentrations within the therapeutic window, especially when the therapeutic window is very narrow. An example of such a drug is theophylline, which has a narrow therapeutic window and a relatively short half-life in children (Kadlec, Ha et al. 1978). Furthermore, poor patient compliance is more likely to happen in the case of regimens requiring frequent administration, and is often an important reason for therapeutic inefficiency or failure (Li, Robinson et al. 1987; Collett and Moreton 2002).
1.1.4.2 Modified drug-release dosage forms
The limitations and requirements regarding the administration of IR dosage forms led pharmaceutical scientists to put a vast amount of work into designing MR dosage forms, which are intended to provide the drug at more precise temporal and spatial placement within the body. The United States Pharmacopeia definition of MR system is: “the one for which drug-release characteristics of time course and/or location are chosen to accomplish therapeutic or convenience objectives not offered by conventional dosage forms…”
Some authors have suggested two main distinct classifications within the MR dosage forms: sustained-release (referred herein as SR) dosage forms and controlled-released (referred herein as CR) dosage forms. According to this terminology, SR denotes any dosage form designed to maintain therapeutic plasma or tissue concentrations of the drug for an extended period of time by providing drug at a decreased release rate and, thus, slowing down the absorption rate. The Cmax attained after a single administration of a SR dosage form will be usually lower than that attained after the administration of a single IR dosage form containing the same amount of drug, and the Tmax will be longer compared to the IR dosage form (Figure 1.2). CR, on the other hand, indicates that the delivery system is able to provide some actual
therapeutic control, whether this be of a temporal nature, spatial nature, or both; that is, it attempts to control drug concentrations in the target tissue or cells. These definitions suggest that SR systems, which only prolong therapeutic blood or tissue concentrations of the drug for an extended period of time, cannot be considered as CR systems (Li, Robinson et al. 1987; Jantzen and Robinson 2002). However, there has been considerable confusion regarding the terminology of these dosage forms (Li, Robinson et al. 1987; Buri and Doelker 1997; Jantzen and Robinson 2002).
Thus, CR may be considered to include a broad number of objectives such as, among others, 1) to increase drug solubility and dissolution rates in order to improve absorption and, as a result, bioavailability; 2) to prolong retention in the stomach in order to control not only the rate of release but also the site of release; 3) to protect drugs and bioactive agents, such as peptides, proteins and enzymes, from degradation within the gastrointestinal tract; 4) to protect the stomach from the irritating effects of some drug by means of, for example, enteric coatings; and 5) to deliver drugs to their absorption window or to specific targets within the gastrointestinal tract, often the colon (site-specific) (Li, Robinson et al. 1987; Ranade 1991).
The main goals of oral SR products, on the other hand, can be described as follows (Li, Robinson et al. 1987; Ranade 1991; Gupta and Robinson 1992; Collett and Moreton 2002; Das and Das 2003; Rajabi-Siahboomi 2003; Kumar, Bhowmik et al. 2010):
1. To attain a therapeutic concentration of drug in the plasma (within the therapeutic window of the drug) quickly, which provides a fast onset of the desired therapeutic response in the patient, and, then, to maintain the concentrations within the therapeutic window, with a maximum reduction of fluctuations, for a longer period of time after the administration of a single dose. The decreased fluctuations of plasma concentrations result in more uniform and prolonged clinical effects with lower incidence and/or severity of systemic and local side-effects, better treatment of diseases where symptoms exacerbate if the plasma concentration of drug drops below the minimum effective concentration, and better overnight maintenance of the therapeutic action.
2. To reduce dosage frequency, which generally improves patient comfort and compliance and may reduce the total amount of drug administered over the duration of treatment. 3. To possibly hinder the drug degradation rate by delaying disintegration or dissolution of