Science Arts & Métiers (SAM)
is an open access repository that collects the work of Arts et Métiers Institute of Technology researchers and makes it freely available over the web where possible.
This is an author-deposited version published in: https://sam.ensam.eu Handle ID: .http://hdl.handle.net/10985/14979
To cite this version :
Claudio VERGARI, Laurent GAJNY, Isabelle COURTOIS, Eric EBERMEYER, Kariman ABELIN-GENEVOIS, Youngwoo KIM, Tristan LANGLAIS, Raphaël VIALLE, Ayman ASSI, Ismat
GHANEM, Jean DUBOUSSET, Wafa SKALLI - Quasi-automatic early detection of progressive idiopathic scoliosis from biplanar radiography: a preliminary validation - European Spine Journal p.1-7 - 2019
Any correspondence concerning this service should be sent to the repository Administrator : archiveouverte@ensam.eu
a Arts et Metiers ParisTech, LBM/Institut de Biomecanique Humaine Georges Charpak, 151 bd de l'Hopital, 75013
Paris, France.
b Unite Rachis, CHU - Hopital Bellevue, Saint-Etienne, France
c Department of Orthopaedic Surgery, Centre médico-chirurgical et de réadaptation des Massues, Lyon, France. d Sorbonne University, Department of Paediatric Orthopaedics, Armand Trousseau Hospital, APHP,26, avenue
du Docteur Arnold-Netter, 75012 Paris, France
e Laboratory of Biomechanics and Medical Imaging, Faculty of Medicine, University of Saint-Joseph, Beirut,
Lebanon
* corresponding author: c.vergari@gmail.com
Quasi-automatic early detection of progressive idiopathic
scoliosis from biplanar radiography: a preliminary validation
Claudio Vergari *a, Laurent Gajny a, Isabelle Courtois b, Eric Ebemeyer b,
Kariman Abelin-Genevois c, Youngwoo Kim a, Tristan Langlais d, Raphael Vialle d,
Ayman Assi e, Ismat Ghanem e, Jean Dubousset a, Wafa Skalli a
Abstract
Purpose To validate the predictive power and reliability of a novel quasi-automatic method to calculate the severity index of adolescent idiopathic scoliosis (AIS).
Methods Fifty-five AIS patients were prospectively included (Age: 10-15, Cobb: 16° ± 4°). Patients underwent low-dose biplanar x-rays and a novel fast method for 3D reconstruction of the spine was performed. They were followed until skeletal maturity (stable patients) or brace prescription (progressive patients). The severity index was calculated at the first exam, based on 3D parameters of the scoliotic curve, and it was compared with the patient’s final outcome (progressive or stable). Three operators have repeated the 3D reconstruction twice for a subset of 30 patients to assess reproducibility (through Cohen’s kappa and intraclass correlation coefficient).
Results 85% of the patients were correctly classified as stable or progressive by the severity index, with a sensitivity of 92% and specificity of 74%. Substantial intra-operator agreement and good inter-operator agreement were observed, with 80% of the progressive patients correctly detected at the first exam. The novel severity index assessment took less than 4 minutes of operator time.
Conclusions The fast and semi-automatic method for 3D reconstruction developed in this
work allowed for a fast and reliable calculation of the severity index. The method is fast and user friendly. Once extensively validated, this severity index could allow very early initiation of conservative treatment for progressive patients, thus increasing treatment efficacy and therefore reducing the need for corrective surgery.
Keywords: adolescent idiopathic scoliosis; 3D reconstruction; reliability; feature extraction;
Introduction
Adolescent idiopathic scoliosis (AIS) is a three-dimensional deformity of the spine which, if left untreated in its progressive form, can lead to respiratory or cardiovascular impairment and more in general a decrease in quality of life [1]. Corrective surgery is invasive, and it is accompanied by non-negligible risks of complications. Bracing can be used to efficiently slow down or stop the progression, and patients often prefer it to observation [2, 3]. Early detection of progressive curves offers the opportunity to undergo effective, non-operative treatments to the patients, thus reducing the need of surgery. This concept lead several associations to endorse screening for scoliosis [4, 5], in order to detect the pathology as early as possible. Nevertheless, such screening remains controversial [6], mainly because of cost and potentially unnecessary radiation exposure, although today low-dose radiography is available. Moreover, the benefits of detection of early scoliosis cases are hindered by the lack of robust methods to recognized which of these cases are at risk of progression.
Several factors are associated with curve progression, the most common being the skeletal maturity and menarcheal age, Cobb angle, and scoliosis in the family. Other geometrical factors could be associated with progression, such as the rib-vertebra angle as proposed by Mehta [7], the back surface shape [8], spinal torsion [9], as well as patient characteristics such as alterations of the vestibular system or the spinal cord [10]. In particular, it was suggested that the three-dimensional shape of the scoliotic curve could be indicative of progression risk [11, 12]. Indeed, a 3D phenotype of progressive curves was recently defined that can discriminate progressive and stable scoliosis with an overall accuracy of 82%, and 89% of correctly detected progressive curves [13]. However, a limitation of the previous study was that a fully experienced user was needed to perform a thorough 3D reconstruction of the spine from biplanar radiography, which might be difficult to implement in clinical routine.
The aim of this work was to develop a fast and semi-automatic method to calculate a robust severity index (s-index), to predict progression in untreated IS during growth.
Methods
Subjects
Data were collected prospectively from four hospitals, after approval of the ethical committee. Inclusion criteria were: diagnosis of AIS, Cobb angle between 10° and 25°, European Risser sign < 3, age > 10 years, no previous treatment for scoliosis. All curve topologies were included (thoracic, thoracolumbar and lumbar). Exclusion criteria were: supernumerary vertebrae, transition anomaly, non-standard position in biplanar radiography. All patients underwent a low-dose biplanar radiography (EOS system, EOS Imaging, Paris, France) at inclusion, which corresponded to their diagnosis of AIS, in the standardized free-standing position [14]. Patients who did not respect this position were excluded (arms held too high, too low or asymmetrically, obvious leaning forwards or backwards, etc.).
Part of this cohort (thirty patients) was already used in the previous validation work [13], but some patients were imaged with older stereoradiographic devices with low image quality; these patients were excluded from the current study. Cohort size for this sensitivity/specificity study was defined based on the hypothesis of 40 % prevalence for progressive AIS [15–17] and a statistical power of 0.8 [18], leading to a minimal cohort of 50 patients with at least 20 progressive cases.
Patients were followed until prescription of brace (considered as progressive scoliosis) or skeletal maturity without bracing (Risser sign ≥ 3 and Cobb angle < 25°, considered as stable scoliosis). Follow-up was also performed with EOS biplanar x-rays. Patients were considered progressive when showing Risser sign ≤ 2 and a Cobb angle higher than 25°, consistently with SOSORT guidelines [1], but also if they showed an increase of more than 5° Cobb angle and/or vertebral axial rotation in 6 months [19], together with worsening of the clinical appearance with hump increase. The progressive character of each patient was confirmed by consensus of the prescribing clinician and an expert surgeon (J.D.), who analyzed the biplanar radiography of these patients at decision of treatment while blinded to the value of the severity index. Patients for whom there was no consensus were excluded.
Quasi-automatic 3D reconstruction
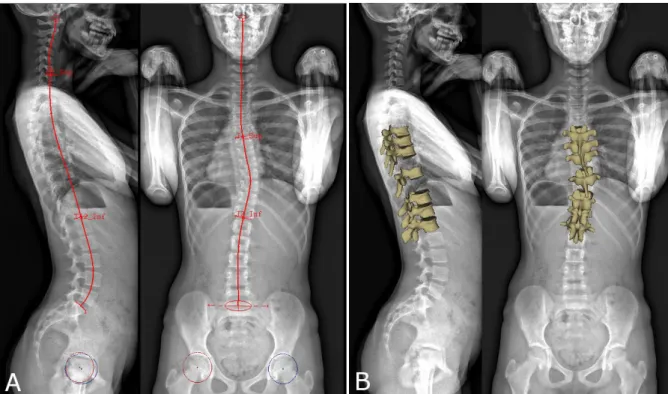
A quasi-automatic 3D reconstruction of the spine was performed in three steps, which will be detailed below: the operator first selected a few anatomical landmarks on the frontal and lateral radiographs (Figure 1A), then an automatic algorithm provided an initial solution of 3D reconstruction, on which the operator could perform fast manual adjustment of some key vertebrae (the apex, junctions and the adjacent to the junctions, Figure 1B) which were projected over the original radiography (Figure 2).
More in detail, the following landmarks were digitized in both views (Figure 1): the sacral plate, left and right acetabula and the spinal midline through the centre of all vertebral bodies, from the odontoid apophysis of C2 to L5 lower endplate. The upper endplate of C7 and lower endplate of T12 were also selected in the lateral view, while the two endplates delimiting the main scoliotic curve were selected in the frontal view. The junctional levels of the main curve Fig. 1 (A) Manual initialization of the 3D reconstruction. The sacral plate, acetabula and the spinal midline from the odontoid apophysis of C2 vertebra to L5 lower endplate were selected in both views. The upper endplate of C7 and lower endplate of T12 were selected in the lateral view, while the main scoliotic curve was selected in the frontal view. (B) 3D reconstruction of the 7 key vertebrae that were manually adjusted: the apex, the junctional vertebrae and the adjacent to the junctional vertebrae.
were defined to obtain the maximization of Cobb angle, and they were often characterized by a local discontinuity of vertebral axial rotation (i.e., a sudden change of vertebral axial orientation).
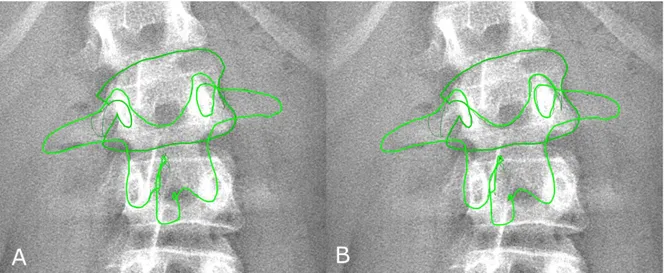
The initial solution was automatically calculated through statistical inference [20, 21] and image analysis [22, 23]. The 3D reconstructed vertebrae thus obtained were retro-projected (Figure 2) on the frontal radiography. The operator was only required to adjust horizontal and vertical position and axial rotation of 7 key vertebrae: the curve apex, two junctional vertebrae and the adjacent to the junctional vertebrae. The aim of this step was to better fit the projection of the 3D model to the frontal radiography; the sagittal radiography was not used at this stage since the initial solution was sufficiently accurate in this plane.
Severity index
The patient’s severity index was automatically calculated, as previously described [13], from the following parameters relative to the main scoliotic curve: Cobb angle, vertebral axial rotation at the apical level, intervertebral axial rotation at the upper and lower junctional levels, torsion index of the curve and hypokyphosis index of the apical vertebra. All parameters were calculated in the patient’s reference frame. Predictive discriminant analysis was used to compare each patient’s parameters to a previously built database of 53 healthy subjects, 17 pre-bracing and 31 severe AIS patients. The comparison was summarized in a severity index: an index lower than 0.4 was associated with a stable scoliosis while an index higher than 0.6 with a progressive one. Values in between were considered doubtful (non-classified).
Validation
The relevance of the severity index calculated with this quasi-automatic method was evaluated by comparing the index’s classification with the actual patients’ outcome (progressive or stable). A confusion matrix was built with the number of true negatives, false negatives, true positives and false negatives. Sensitivity (true positives rate) and specificity (true negatives rate) were also calculated.
A reproducibility study was performed to determine reliability of the severity index: three operators (two researchers with two and five-years’ experience in 3D reconstruction,
Fig. 2 Position of the vertebral model for apical vertebra (L2) before (panel A) and after manual adjustment. In panel B, the contour does not perfectly match the vertebra because only fast rigid transformations (translation and axial rotation) were required to compute the severity index. In this example, the vertebra was displaced by 3 mm (corresponding to 16 pixels) and it was axially rotated by less than 1°.
respectively, and one surgeon with one day experience) repeated the quasi-automatic reconstruction process twice on a subset of 30 patients. Cohen’s kappa and percentage agreement were calculated to assess intra-operator repeatability while Intraclass Correlation Coefficient (ICC) was calculated to determine inter-operator reproducibility. All calculations were performed in Matlab 2016b.
Results
Patients
Fifty-five patients were included, forty-six girls (12 ± 1 years old, European Risser sign ≤ 2, 16 ± 4° Cobb angle) and nine boys (13 ± 1 years old, Risser sign ≤ 2,16 ± 3° Cobb angle). Table 1 reports patient demographical data and their geometrical parameters related to the severity index. No patient dropped out of the study. Thirty-six patients were progressive while 19 were stable.
Severity index
Table 2 reports the confusion matrix of the severity index classification based on the fast 3D reconstruction of the spine. Overall, 85% of the patients were correctly classified, with a sensitivity of 92% and specificity of 74%. Three patients (8 %) were false negative, i.e., their progressive character was not recognized, but they all had a Cobb angle lower than 12°. Four patients were false positive (stable curves detected as progressive).
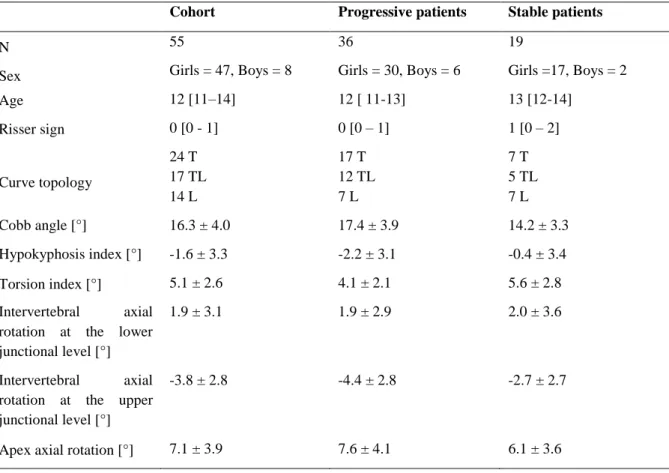
Table 1. Clinical parameters of the included cohort (average ± standard deviation). Curve topologies: T = Thoracic (apex in T1-T11), TL = thoraco-lumbar (apex in T12-L1), Lumbar (apex in L2-L5). Age, and European Risser sign were expressed as median [1st-3rd quartile].
Cohort Progressive patients Stable patients
N 55 36 19
Sex Girls = 47, Boys = 8 Girls = 30, Boys = 6 Girls =17, Boys = 2
Age 12 [11–14] 12 [ 11-13] 13 [12-14] Risser sign 0 [0 - 1] 0 [0 – 1] 1 [0 – 2] Curve topology 24 T 17 TL 14 L 17 T 12 TL 7 L 7 T 5 TL 7 L Cobb angle [°] 16.3 ± 4.0 17.4 ± 3.9 14.2 ± 3.3 Hypokyphosis index [°] -1.6 ± 3.3 -2.2 ± 3.1 -0.4 ± 3.4 Torsion index [°] 5.1 ± 2.6 4.1 ± 2.1 5.6 ± 2.8 Intervertebral axial
rotation at the lower junctional level [°]
1.9 ± 3.1 1.9 ± 2.9 2.0 ± 3.6
Intervertebral axial
rotation at the upper junctional level [°]
-3.8 ± 2.8 -4.4 ± 2.8 -2.7 ± 2.7
Reliability
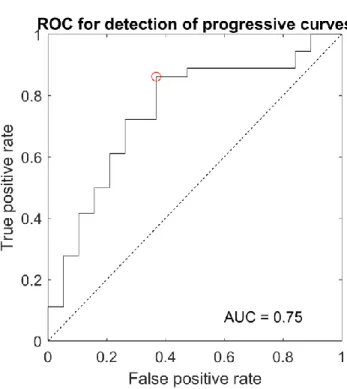
180 reconstructions were performed (30 patients x 3 operators x 2 reconstructions). “Substantial” intra-operator agreement [24] was observed for all three operators (Cohen’s kappa between 0.6 and 0.7), with percentage agreement between 81 and 85%, while ICC showed good inter-operator agreement (0.63). Fourteen patients in this cohort were progressive, corresponding to 84 reconstructions (14 x 3 operators x 2 repetitions): 80% of these reconstructions were correctly classified as progressive. Figure 3 reports a receiver operating characteristic curve for the detection of progressive scoliosis.
Quasi-automatic 3D reconstruction
The initial manual identification of the spinal curve and specific endplates lasted 2.5 minutes in average, while the final manual adjustment of seven key vertebrae lasted less than one minute. Fig. 2 shows an example of rigid manual adjustment.
Overall, the apexes were displaced by 0.1 ± 0.2 mm (max 4.2 mm) and rotated by 0.1 ± 0.1° (max 1.8°).
Discussion
A semi-automatic method to calculate a predictive index of progressive scoliosis from biplanar radiography was described in the present
work. The performance of the s-index confirmed the results of the previous validation, which was based on manual 3D reconstruction: at least 80% of the progressive patients were detected in both studies, even when inter-operator variability was introduced. However, operator-time time was reduced from about 10-15 minutes for an expert operator to less than 4 minutes for a newly trained one. Operator-time did not depend on the operator’ experience; however, all operators had knowledge of spinal anatomy and of the radiological appearance of the important landmarks. Moreover, this implementation of the severity index showed good to substantial intra- and inter-operator reliability. Three patients were false negatives, i.e. they were progressive, but they were
Table 2. Confusion matrix of progressive vs stable scoliosis detection.
S-index ≤ 0.4 0.4 < S-index < 0.6 S-index ≥ 0.6
Stable scoliosis (N = 19) 14 (74 %) 1 4 (21 %)
Progressive scoliosis (N = 36) 3 (8 %) 0 33 (92 %)
Fig. 3 Receiver operating characteristic curve for the detection of progressive scoliosis. Area under curve (AUC) was 0.75.
classified as stable scoliosis. However, these patients were at a very early stage, with Cobb angle lower than 12°. Therefore, a low severity index for such an early stage of scoliosis should not be interpreted as a zero risk of progression. Rather, the patient is not at an immediate risk of progression, and the next follow-up exam and s-index evaluation could be delayed. Four false positives were stable scoliosis which were classified as progressive. These patients had Cobb angle between 16 and 25°, and they all presented relatively high apical axial rotation (between 4° and 8°). Further refinement of the s-index through larger databases and additional clinical parameters could improve these rates.
Rate of scoliosis progression was 65 % in this study, since 36 progressive patients out of 55. A recent meta-analysis by Di Felice et al. [17] reported a progression rate of 49%, with a large 95% confidence interval of 19%-79%. The present study falls within the higher spectrum of this confidence interval, while the study by Danielsson et al [15] falls on the lower part of the spectrum, with a 40% progression rate. Lonstein and Carlson [19] reported an even lower rate of 23 % progression. However, progression rates should be compared with care, because of differences of inclusion and progression criteria. For instance, Danielsson et al. included patients with 23-39° Cobb angle (some of which would be considered as already progressed in this study), while Lonstein and Carlson included 12% of patients with Cobb angles lower than 10°, which would not be considered as scoliotic according to SRS and SOSORT criteria. This work has some limitations. First, fifty-five patients still represent a relatively small cohort of patients; data collection is slow because of the long follow-up required to ascertain patient’s outcome. Part of the cohort of patients included in this study was already published in the first validation of the severity index [13]. In the present work there are actually less total patients because the previous cohort included several radiographies acquired using stereoradiographic devices [25] with lower image quality. These were not adapted to the image analysis techniques used for the initialization of the 3D reconstruction in the present method, where all acquisitions were performed with an EOS system.
Indeed, the proposed severity index requires the availability of calibrated biplanar radiographies of the patient, which are not available in every clinical center and could decrease the diffusion of the method. Moreover, inclusions were limited to AIS: non-idiopathic scoliosis were excluded, as well as early-onset scoliosis. Nevertheless, this study confirmed the previously obtained index’s discriminatory power on adolescent patients [13]. Moreover, this study allowed to validate a novel user-friendly method to calculate the severity index, based on the digitization of well-known anatomical landmarks (vertebral endplates, pelvic acetabula) and on simple horizontal translation and axial rotation of only 7 vertebrae. A multicentric international data collection is under way to include more patients at first exam and follow them to skeletal maturity or brace treatment, in order to form a larger cohort for extensive validation.
The second limitation is that criteria for brace decision vary between clinicians and hospitals, and it is difficult to enforce quantitative standards such as the SRS recommendations. The main criteria for brace decision were "an increase of 5° Cobb angle and/or vertebral axial rotation in 6 months, together with worsening of the clinical appearance with rib hump increase". However, the "worsening of the clinical appearance" could be subjective, and the complete clinical exam was taken into account by the clinician when deciding for brace. To overcome this limitation, radiographies of all progressive patient were reviewed by an expert senior surgeon, who was blinded to the value of the severity index, in order to establish collegiate clinical agreement on the progressive character of those patients. No more than a couple of patients were excluded from the study because of disagreement between the expert and the prescribing clinician, i.e., patients that the expert would not have treated by brace; these cases were not further documented. This collegiate review took place before the calculation of
the severity index, so it is completely independent from it, allowing to confirm the progressive character of all included patients, as was done in our previous work [13].
Finally, patients’ follow-up was not complete for this study, since it stopped at the decision of bracing (progressive patients) or at European Risser sign ≥ 3 with Cobb angle < 25° (stable patients). On the one hand, progression after bracing is largely influenced by the patient’s compliance and response to bracing, so these aspects become important factors that should be included in the estimation of progression risk towards need for surgery. On the other hand, rate of progression decreases at Risser 3 for patients presenting low Cobb angle, so estimation of risk is less crucial. Still, progression risk is not zero event at this stage, so patients can continue their radiological examinations, albeit less frequently [26].
The proposed method to calculate the severity index requires manual intervention to initialize and finely adjust a 3D reconstruction of the main scoliotic curve. Although the whole process takes less than 4 minutes of operator-time, work is in progress towards a fully automatic 3D reconstruction, based on larger database of patients and image processing and analysis, to obtain a more accurate and robust calculation of the severity index.
In the present work, a semi-automatic method was proposed to calculate the severity index from biplanar radiography. Its main advantage is that it is fast and user-friendly. The resulting severity index was able to correctly detect 80% of the progressive patients. Once extensively validated, such index could allow very early initiation of conservative treatment for progressive patients, thus increasing treatment efficacy and therefore reducing the need for surgery.
Acknowledgements
The authors are grateful to the ParisTech BiomecAM chair program on subject-specific musculoskeletal modelling (with the support of ParisTech and Yves Cotrel Foundations, Société Générale, Proteor and Covea).
References
1. Negrini S, Donzelli S, Aulisa AG, et al (2018) 2016 SOSORT guidelines: orthopaedic and rehabilitation treatment of idiopathic scoliosis during growth. Scoliosis Spinal Disord 13:3. https://doi.org/10.1186/s13013-017-0145-8
2. Weinstein SL, Dolan LA, Wright JG, Dobbs MB (2013) Effects of Bracing in Adolescents with Idiopathic Scoliosis. N Engl J Med 369:1512–1521. https://doi.org/doi:10.1056/NEJMoa1307337
3. Negrini S, Minozzi S, Bettany-Saltikov J, et al (2015) Braces for idiopathic scoliosis in
adolescents. Cochrane database Syst Rev 6:CD006850.
https://doi.org/10.1002/14651858.CD006850.pub3
4. Roussouly P, Labelle H, Rouissi J, Bodin A (2013) Pre- and post-operative sagittal balance in idiopathic scoliosis: a comparison over the ages of two cohorts of 132 adolescents and 52 adults. Eur Spine J 22:203–215. https://doi.org/10.1007/s00586-012-2571-x
5. Grivas TB, Hresko MT, Labelle H, et al (2013) The pendulum swings back to scoliosis screening: screening policies for early detection and treatment of idiopathic scoliosis -current concepts and recommendations. Scoliosis 8:16. https://doi.org/10.1186/1748-7161-8-16
6. Hresko MT, Talwalkar V, Schwend R, et al (2016) Early Detection of Idiopathic Scoliosis in Adolescents. J Bone Joint Surg Am 98:e67. https://doi.org/10.2106/JBJS.16.00224
7. Mehta MH (1972) The rib-vertebra angle in the early diagnosis between resolving and progressive infantile scoliosis. J Bone Jt Surgery, Br Vol 54–B:230–243
8. Korvin G De, Randriaminahisoa T, Cugy E, et al (2014) Detection of progressive idiopathic scoliosis during growth using back surface topography: A prospective study
of 100 patients. Ann Phys Rehabil Med 57:629–639.
https://doi.org/https://doi.org/10.1016/j.rehab.2014.09.002
9. Poncet P, Dansereau J, Labelle H (2001) Geometric torsion in idiopathic scoliosis: three-dimensional analysis and proposal for a new classification. Spine (Phila Pa 1976) 26:2235–2243
10. Kong Y, Shi L, Hui SCN, et al (2014) Variation in Anisotropy and Diffusivity along the Medulla Oblongata and the Whole Spinal Cord in Adolescent Idiopathic Scoliosis: A Pilot Study Using Diffusion Tensor Imaging. Am J Neuroradiol 35:1621 LP-1627 11. Perdriolle R, Vidal J (1981) [A study of scoliotic curve. The importance of extension
and vertebral rotation (author’s transl)]. Rev Chir Orthop Reparatrice Appar Mot 67:25– 34
12. Dubousset J (1994) Three-dimensional Analysis of the Scoliotic Deformity. In: The Pediatric Spine: Principles and Practice. Raven Press L
13. Skalli W, Vergari C, Ebermeyer E, et al (2017) Early detection of progressive adolescent idiopathic scoliosis: A severity index. Spine (Phila Pa 1976) 42:823–830
14. Faro FD, Marks MC, Pawelek J, Newton PO (2004) Evaluation of a functional position for lateral radiograph acquisition in adolescent idiopathic scoliosis. Spine (Phila Pa 1976) 29:2284–2289
15. Danielsson AJ, Hasserius R, Ohlin A, Nachemson AL (2007) A prospective study of brace treatment versus observation alone in adolescent idiopathic scoliosis: A follow-up mean of 16 years after maturity. Spine (Phila Pa 1976) 32:2198–2207. https://doi.org/10.1097/BRS.0b013e31814b851f
16. Bunnell WP (1986) The Natural History of Idiopathic Scoliosis Before Skeletal Maturity. Spine (Phila Pa 1976) 11:773–776
17. Di Felice F, Zaina F, Donzelli S, Negrini S (2018) The Natural History of Idiopathic Scoliosis during Growth: A Meta-Analysis. Am J Phys Med Rehabil 97:346–356. https://doi.org/10.1097/PHM.0000000000000861
18. Bujang MA, Adnan TH (2016) Requirements for Minimum Sample Size for Sensitivity and Specificity Analysis. J Clin Diagn Res 10:YE01-YE06. https://doi.org/10.7860/JCDR/2016/18129.8744
19. Lonstein JE, Carlson JM (1984) The prediction of curve progression in untreated idiopathic scoliosis during growth. J Bone Jt Surg - Am Vol 66:1061–1071
20. Humbert L, De Guise JA, Aubert B, et al (2009) 3D reconstruction of the spine from biplanar X-rays using parametric models based on transversal and longitudinal
inferences. Med Eng Phys 31:681–687.
https://doi.org/10.1016/j.medengphy.2009.01.003
21. Gajny L, Ebrahimi S, Vergari C, et al (2018) Quasi-automatic 3D reconstruction of the full spine from low-dose biplanar X-rays based on statistical inferences and image analysis. Eur Spine J. https://doi.org/10.1007/s00586-018-5807-6
22. Ebrahimi S, Angelini E, Gajny L, Skalli W (2016) Lumbar spine posterior corner detection in X-rays using Haar-based features. In: 2016 IEEE 13th International Symposium on Biomedical Imaging (ISBI). pp 180–183
23. Ebrahimi S, Gajny L, Skalli W, Angelini E (2018) Vertebral Corners Detection on Sagittal X-rays based on Shape Modelling, Random Forest Classifiers and Dedicated Visual Features. Comput Methods Biomech Biomed Eng Imaging Vis. https://doi.org/https://doi.org/10.1080/21681163.2018.1463174
24. Landis JR, Koch GG (1977) The Measurement of Observer Agreement for Categorical Data. Biometrics 33:159–174. https://doi.org/10.2307/2529310
25. Pomero V, Mitton D, Laporte S, et al (2004) Fast accurate stereoradiographic 3D-reconstruction of the spine using a combined geometric and statistic model. Clin Biomech 19:240–247. https://doi.org/10.1016/j.clinbiomech.2003.11.014
26. Kohashi Y, Oga M, Sugioka Y (1996) A New Method Using Top Views of the Spine to Predict the Progression of Curves in Idiopathic Scoliosis During Growth. Spine (Phila Pa 1976) 21:212–217