THÈSE
En vue de l’obtention du
DOCTORAT DE L’UNIVERSITÉ DE TOULOUSE
Délivré par : Université Toulouse 3 Paul Sabatier (UT3 Paul Sabatier) Cotutelle internationale avec : Ghent University (UGent), BelgiumPrésentée et soutenue par :
Ratha SOR
Le Lundi 10 juillet 2017Titre
:Modélisation des changements spatio‐temporels des communautés de
macroinvertébrés benthiques dans les rivières d'Asie et d'Europe
ED SEVAB : Écologie, biodiversité et évolution Unité de recherche : Évolution et Diversité Biologique (UT3 Paul Sabatier, France) Aquatic Ecology (UGent, Belgium) Directeur(s) de Thèse : Prof Sovan LEK (Université Toulouse 3 Paul Sabatier, France) Prof Peter GOETHALS (Ghent University, Belgium) Dr Pieter BOETS (Ghent University, Belgium) Rapporteurs : Prof Philippe USSEGLIO‐POLATERA (University of Lorraine, France) Dr Nam SO (Mekong River Commission, Laos PDR) Prof. Olivier THAS (Ghent University, Belgium) Autre(s) membre(s) du jury : Prof Michele TACKX (Université Toulouse 3 Paul Sabatier, France) Prof Young‐Seuk PARK (Kyung Hee University, Republic of Korea) Prof Sovan LEK (Université Toulouse 3 Paul Sabatier, France) Dr Saveng ITH (Royal University of Phnom Penh, Cambodia) Prof Peter GOETHALS (Ghent University, Belgium) Prof Olivier THAS (Ghent University, Belgium) Dr Pieter BOETS (Ghent University, Belgium)communities in Asian and European rivers
MSc Ratha SOR
Supervisors:
Prof Dr Sovan LEK
Laboratoire Evolution & Diversité Biologique, UMR 5174, Université Paul Sabatier – Toulouse III, 118 route de Narbonne, 31062 Toulouse cédex 4 – France
Prof Dr Peter GOETHALS
Laboratory of Environmental Toxicology and Aquatic Ecology, Ghent University, Campus Coupure building F, Coupure links 653, B9000 Ghent, Belgium
Co
-supervisor
: Dr Pieter BOETSProvincial Centre of Environmental Research, Godshuizenlaan 95, 9000 Ghent, Belgium
Thesis submitted in fulfilment of the requirements for the degree of Doctor (PhD) in Ecology, Diversity and Biology (Université Paul Sabatier – Toulouse III) and in Applied Biological Sciences (Ghent University).
– Toulouse III, 118 route de Narbonne, 31062 Toulouse cédex 4 – France.
Laboratory for Environmental Toxicology and Aquatic Ecology (1 year), Department Applied Ecology and Environmental Biology, Faculty of Bioscience Engineering, Ghent University, Campus Coupure building F, Coupure links 653, B9000 Ghent, Belgium.
Please refer to this work as follows:
Sor R., 2017. Modelling spatio-temporal changes of benthic macroinvertebrate communities in Asian and European rivers. Joint-PhD thesis, University of Toulouse/Ghent University, Toulouse, France.
The author and the supervisors give the authorization to consult and to copy parts of this work for personal use only. Every other use is subject to the copyright laws. Permission to reproduce any material contained in this work should be obtained from the author.
i
Acknowledgements
Firstly, I would like to express my sincere thanks and profound gratitude to my thesis directors Prof Dr Sovan LEK, Prof Dr Peter GOETHALS and Dr Pieter BOETS for their scientific support. They have a huge pile of practical, ecological and theoretical knowledge. Their guidance, advice, suggestions and encouragements allowed me to survive during this scientific journey. I thank you all very much for your precious time spent on reading and correcting my work and discussing with me with an open mind. I also highly appreciate the freedom I received and the possibility I got to begin my PhD research project.
I am grateful to my thesis referees, jury members and all reading committees (Prof Philippe USSEGLIO-POLTERA, Prof Michele TACKX, Prof Young-Seuk PARK, Dr Nam SO, Prof Olivier THAS and Dr Saveng ITH) for their acceptance to review and evaluate this thesis. My grateful appreciation is due to lecturers and senior research staff from the Faculty of Science, Royal University of Phnom Penh (RUPP), who always supported and encouraged me to continue my PhD. They include Prof MEAK Kamerane, Lecturers: THAO Sokunthia, UK On Norong, THAI Iengly, HAP Sophorn, ITH Saveng, PHAUK Sophany, MEAS Senghun and KHEAM Sokha, Nicholas SOUTER and other lecturers in the Department of Biology (RUPP). Many thanks go to technical, administrative and management staff in EDB lab (UPS-TLS3): Nicole Hommet, Linda Jalabert, Dominique Pantalacci, and in the Environmental Toxicology and Aquatic Ecology lab: Sigrid Schuermans, Marianne Van den Hove, Sylvie Bauwens, Veerle Lambert, Nancy De Saeyer. They facilitated all of administrative procedures during my stay in each laboratory.
Warm thanks also go my AQUAECO team leaders, colleagues and friends: Gaël Grenouillet, Sébastien Brosse, Loïc Tudesque, Mathieu Chevalier, Pengbun Ngor, Ratha Chea, Ratha Seng, Kong Heng, Bunyeth Chan, Phanith Long, Sophea Iv, Sophany Soeun, Chuanbo Guo, Chao Wang, Mingli Lin, Kevin Cilleros, Marine Cambon, Jade Bruxaux, Lucie Kuczynski and other Cambodian friends. You all kept me a live with fun and food! Loïc, thank you very much for your helps with GIS, your editing my French thesis summary and your frequent friendly conversations. Sophea, highly appreciated for your help translating my thesis summary into French. Thank you also my friends from UGent and from the Environmental Toxicology and Aquatic Ecology lab: Niels De Troyer, Wout Van Echelpoel, Sacha Gobeyn, Jana Van Butsel,
ii
Minar Naomi Damanik Ambarita, Marie Anne Eurie Forio, Tuan Long Ho, Selamawit Negassa Chawaka, Natalia Carolina Donoso Pantoja, Rubén Jerves Cobo, Daniel Mercado Garcia, Thi Hanh Tien Nguyen, Tri Trương Trịnh Từ, Stijn Bruneel, Nathalie Claire Paracueles, Channy Chim, Saosometh Chhith and other friendly people. Our lunch was always relaxing and funny! Financial means are very crucial to make this scientific mission possible. I am therefore grateful to the Erasmus Mundus LOTUS Unlimited project (European Commission) and the Belmont forum TLSCC projects for providing the chance to do this research. And also, I would like to thank the Mekong River Commission (MRC) and the Flemish Environment Agency (VMM) for the opportunity to study their samples.
My thankful appreciation owe to Prof Sovan LEK and Mrs Sithan LEK for their hospitality, kindness, care, and delicious food. They consider me like their own child, and their house feels like a home for me in Toulouse. I do enjoy gardening (especially during the weekend!), shopping and travelling with them. Many thanks to my second parents and their family in Belgium and my second mum (Judy Santmire) in the USA for their warm welcome, treats and talks during my stressing moments, and to brothers and sisters in churches (in Cambodia, France, and Belgium) for their supportive prayers. Highest thanks be to God for he has given me this wonderful scientific mission and for his wisdom and blessing so that I can complete this assignment with perseverance and joy.
Grateful thanks is extended to my beloved parents, brother and sister. It is blessing to be born and grow up in such a warm and lovely family.
កូនសូមអរគ ុណេ កពុក អនកម្ដយជអេនក ស្រមប់ករចិញចឹមបីបច់ែថរក និងទំន ុកប្រមុង
្រគប់ែបបយ៉ង។ អរគ ុណបង្របុស និងបង្រសី ែដលេមើលែថ និងករពរប្អូន ំងពីតូចជមួយ ពុកែម៉។ េសចក្ដី្រស ញ់ ករផគត់ផគង់ និងករេលើកទឹកចិត្តរបស់អនកទ ំងអស់គនគមនអ្វីកត់ៃថ្លបន េឡើយ។ ក្ដីសុខរបស់អនកទ ំងអស់គន ជក្ដីសុខរបស់ខញុំែដរ។
iii
PART I: SYNTHESIS
Table of Contents
Summary ... v
1. General Introduction ... 1
1.1 Background to the study ... 1
1.2 Macroinvertebrates in Asian and European rivers: a general overview ... 3
1.3 Modelling techniques and applications ... 5
1.4 Research problem, aims and objectives ... 5
2. Materials and Methods ... 8
2.1 Case study in the LMB and dataset ... 8
2.1.1 The LMB ... 8
2.1.2 Data collection and processing ... 8
2.2 Case study in Flemish rivers and dataset ... 10
2.2.1 Flanders ... 10
2.2.2 Data collection and processing ... 12
2.3 Statistical analyses and modelling approaches ... 13
2.3.1 Communities clustering and diversity measures ... 13
2.3.2 Comparative analyses ... 14
2.3.3 Regression and Multivariate analyses ... 15
2.3.4 Model development, validation and performance ... 15
3. Main Results ... 21
3.1 Macroinvertebrate communities and diversity patterns in the LMB ... 21
3.1.1 Overall macroinvertebrate communities ... 21
3.1.2 Spatial community patterns and their relationship with environmental factors ... 22
3.1.3 Macroinvertebrate diversity and its relation to environmental factors ... 27
3.2 Macroinvertebrate communities and diversity patterns in Flemish rivers ... 28
3.2.1 Overall macroinvertebrate communities ... 28
3.2.2 Spatio-temporal community composition and environmental factors ... 29
3.2.3 Spatio-temporal diversity pattern and its relation to environmental factors ... 32
3.3. Modelling and predicting ... 37
3.3.1 Performance variation of modelling techniques applied in the LMB ... 37
3.3.2 Modelling alien mollusc occurrence and their co-occurrence with native molluscs ... 39
3.3.3 Optimizing the prediction of alien mollusc occurrence ... 41
4. General Discussion ... 43
4.1 Overall community composition and diversity in the two river systems ... 43
4.2 Spatio-temporal changes of communities and their relation to environmental factors ... 44
4.2.1 The LMB ... 44
4.2.2 Flemish rivers ... 47
4.3 Model development, performance and predictions ... 51
4.3.1 Modelling techniques and their application in the LMB ... 51
4.3.2 Predicting alien species occurrence and their co-occurrence with native molluscs ... 52
4.3.3 Optimizing the prediction of alien mollusc occurrence ... 53
5. General Conclusion and Perspectives ... 55
5.1 General conclusion ... 55
5.2 Implications for management and restoration ... 56
5.3 Perspectives ... 57
References ... 59
Article 1. Spatial organization of macroinvertebrate assemblages in the Lower Mekong Basin. Sor, R., Boets, P., Chea, R., Goethals, P., Lek, S.
Limnologica (2017), 64: 20-30
Article 2. Uniqueness of sampling site contributions to the total variance of macroinvertebrate communities in the Lower Mekong River.
Sor, R., Legendre, P., Lek, S.
Ecological Indicators (revision submitted)
Article 3. Effects of species prevalence on the performance of predictive models. Sor, R., Park, Y.S., Boets, P., Goethals, P., Lek, S.
Ecological Modelling (2017), 354: 11-19
Article 4. Spatio-temporal co-occurrence of alien and native molluscs: a modelling approach using physical-chemical predictors.
Sor, R., Boets, P., Lek, S, Goethals, P.
Aquatic Invasions (2017), 12: 147-158
Article 5. Optimizing the reliability of classification tree models in predicting alien mollusc occurrence: a hindcasting- and forecasting-based approach.
Sor, R., Boets, P., Lek, S, Goethals, P.
v
Summary
Overall aims: Freshwater tropical and temperate river systems are known to support different biotic communities. In this study, I investigated benthic macroinvertebrate community composition and diversity and its spatial and temporal variation both in tropical Asian and temperate European regions. I also examined the influences of physical-chemical water quality variables on community composition, variations and diversity, and modelled the occurrence of selected species.
Locations: Tropical Asia: the Lower Mekong Basin (LMB), covering an area of 609,000 km2;
Temperate Europe: Western Europe, Flemish rivers (Belgium), covering an area of 13,787 km2. Materials and Methods: For the LMB, data collected from 2004 to 2008 were used, and median values of this period were analysed. For Flemish rivers, data collected from 1991 to 2010 were used. The data were divided into 4 periods: D1: 1991-1995, D2: 1996-2000, D3: 2001-2005 and D4: 2006-2010. The medians of each period were used for detailed spatial analyses. Multivariate analyses were applied to relate community composition and diversity to physical-chemical variables. Five modelling techniques namely Logistic Regression (LR), Random Forest (RF), Support Vector Machine (SVM), Artificial Neural Network (ANN) and Classification Tree (CT) were used to model the occurrence of selected species.
Main results:
Community composition variations, diversity and relationship with environmental variables
From the LMB, 299 macroinvertebrate taxa belonging to 196 genera and 90 families were identified: 131 insects, 98 molluscs, 38 crustaceans, and 32 annelids. These are the largest numbers ever reported for the LMB. Alien taxa were not assessed due to the lack of distribution data and the limited taxonomic knowledge. Insects were mostly found at the upstream parts, which were characterized by high altitude, clear water with high concentration of dissolved oxygen (DO). Molluscs, crustaceans and annelids dominated the downstream parts, which were characterized by a large surface area of watersheds, deep and wide rivers and high water temperature. These diverse compositions found at different spatial scales resulted in an increased local diversity (Shannon-Weiner, H’) from the upstream (H’ = 1.9) to the downstream (H’ = 2.7) parts, and in a great amount of total variation, or beta (β) diversity (BDTotal = 0.8, on a 0-to-1 scale). When computed separately for each component community (i.e. insects, molluscs, crustaceans and annelids), molluscs and insects had a higher variation and their LCBDs greatly contributed to β diversity of global communities, whereas crustaceans and
vi
annelids had a lower variation and contributed less to the β diversity. A high degree of uniqueness in community composition in this tropical system mostly occurred along the mainstream of the rivers, which are highly associated with anthropic disturbance.
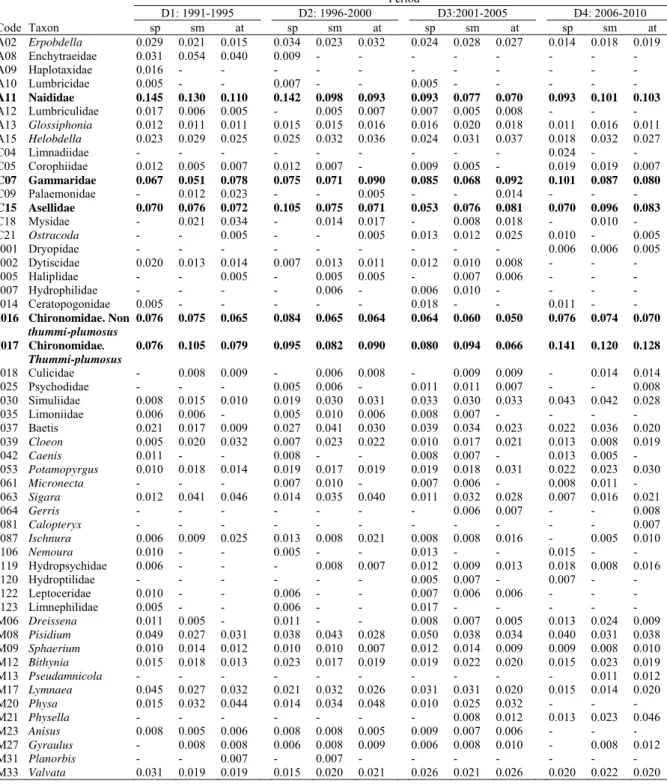
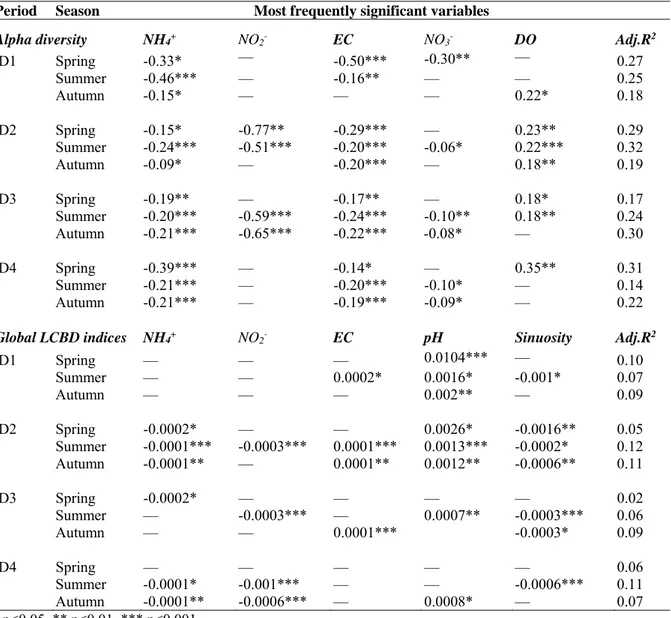
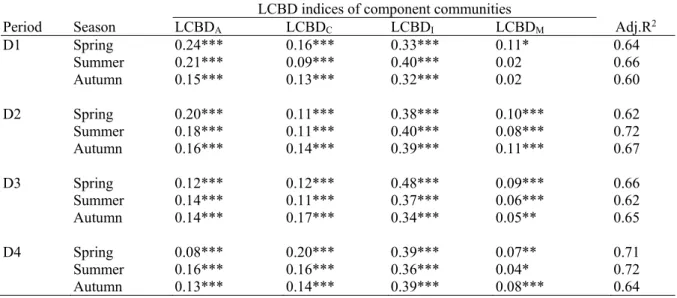
From Flemish rivers, 207 macroinvertebrate taxa belonging to 145 families were identified: 131 insects, 34 molluscs, 21 crustaceans and 21 annelids. Seventy-three alien macroinvertebrate taxa were collected. From the past (D1) to the recent period (D4), most taxa and their abundance were linked to high values of DO and low values of other water quality variables. However, Chironomidae thummi-plumosus, Naididae and Asellidae were found to be negatively associated with DO concentration, but positively related to the concentration of ammonium (NH4+), phosphate, chemical oxygen demand (COD) and nitrate (NO3-). Local diversity increased from D1 (H’ = 1.6) to D3 (H’ = 1.9), but decreased in D4 (H’ = 1.6), which is due to a tremendous increase in overall abundance of macroinvertebrates in the latest period when the water quality was substantially improved. This may indicate that water quality improvement is favourable for some dominant taxa, and thus increases the homogenization of the communities and subsequently reduces the local diversity. Beta diversity of global communities was moderate, but significantly increased from the past (BDTotal = 0.50) to the most recent period (BDTotal = 0.59). When the water quality was poor (i.e. in the 1990s), a significant seasonal diversity (α and β) was observed; the diversity was low in Spring compared to Summer and Autumn. However, the seasonal difference was not found in the 2000s during which the rehabilitation program for improving water quality in most of parts of Flanders was step by step implemented. When computed separately for each component community, molluscs and insects had a high β diversity which always increased from D1 to D4, compared to β diversity of annelids (the lowest) and crustaceans which fluctuated between D1 and D4. LCBDs of the four components significantly and highly contributed to the β diversity of global communities. A high degree of uniqueness in community composition in this temperate system was more related to sites situated in the main harbour watercourses and in brackish polders, where high values of EC and pH were recorded.
Species occurrence modelling
For the LMB, the occurrence of 199 species could be predicted using LR, RF, SVM and ANN. The four modelling techniques yielded significantly different performances (p<0.01), of which ANN yielded the highest performance and was found to better predict the occurrence of rare species. For Flemish rivers, the occurrence of alien molluscs and their co-occurrence with native molluscs were predicted using CT. Based on field data from D1 to D4, the CT models
vii
were only able to reliably predict the “co-occurrence”, but not the sole occurrence of “alien” molluscs. The co-occurrence was mainly dependent on sinuosity and a set of chemical water quality variables (e.g. NH4+, NO3-, COD, pH). When the CT models were optimized by incorporating field and cloned data (i.e. a dataset obtained by independently duplicating the field data points by k different individuals) via hindcasting and forecasting models, the occurrence of alien molluscs was correctly predicted with a low error rate. This result corresponds to field observations, where alien mollusc occurrence has been observed over the last two decades in Flanders.
Main conclusion and remarks: The environmental conditions of the two systems certainly favour a different macroinvertebrate community composition, and thus lead dissimilar variation. The LMB was found to support higher diversity compared to Flemish rivers. This could be due to the fact that most invertebrates from the LMB were identified to the species level, while the invertebrates from Flemish rivers were identified only to family or genus level. However, these findings indeed are not revealing the real composition and diversity for the LMB because it is very large, compared to Flemish rivers, but has been hardly studied. The number of reported taxa from the LMB is thus most likely to be underestimated. On the other hand, Flemish rivers have been extensively investigated and monitored regularly. Nevertheless, the two systems showed some similarities: molluscs and insects had a higher total variation, compared to crustaceans and annelids. Moreover, a high degree of uniqueness in community composition of the two systems mostly occurred at sites where a high level of anthropic disturbance was observed. Among the measured environmental variables, altitude, surface area of watersheds, river width and depth, Secchi depth, DO, EC and water temperature were the key factors affecting macroinvertebrate community composition and diversity in the LMB; whilst in Flemish rivers, DO, EC, pH, NH4+, NO3-, COD, phosphate and sinuosity were the key variables. These findings can provide useful information and insights which could be used to support management, conservation and restoration planning in each system.
Among modelling techniques applied in the LMB, ANN performed the best, and yielded better results when predicting the occurrence of rare species. The prediction of the occurrence of alien molluscs in Flemish rivers was successfully optimized using CT models. Whether in the past or recent periods, the results of this optimization correspond to field observations. To test for transferability, the successfully optimized models are suggested to be validated using data collected outside Flanders.
viii
Résumé
Objectifs généraux: les systèmes fluviaux tropicaux et tempérés d'eau douce sont connus pour soutenir différentes communautés biotiques. Dans cette étude, menée dans une région d’Asie tropicale et dans une région d’Europe tempérée, j'ai étudié la composition et la diversité de la communauté des macro-invertébrés benthiques ainsi que leurs variations spatiales et temporelles. J'ai également examiné les influences des variables physico-chimiques de la qualité de l'eau sur les variations et la diversité de la composition de la communauté et j’ai modélisé l'occurrence d'espèces sélectionnées.
Localisation géographique: Asie tropicale: le bassin aval du Mékong (LMB), couvrant une superficie de 609 000 km2; Europe tempérée: Europe occidentale, fleuves flamands (Belgique), couvrant une superficie de 13 787 km2.
Matériel et méthodes: Pour le LMB, les données recueillies de 2004 à 2008 ont été utilisées et les valeurs médianes de cette période ont été analysées. Pour les rivières flamandes, les données collectées de 1991 à 2010 ont été utilisées. Les données ont été divisées en 4 périodes: D1: 1991-1995, D2: 1996-2000, D3: 2001-2005 et D4: 2006-2010. Les médianes de chaque période ont été utilisées pour des analyses spatiales détaillées. Des analyses multivariées ont été appliquées pour relier la composition et la diversité de la communauté aux variables physico-chimiques. Cinq techniques de modélisation, à savoir la régression logistique (LR), les Random Forest (RF), le Support Vector Machine (SVM), les réseaux de neurones artificiels (ANN) et les arbres de classification (CT) ont été utilisées pour modéliser l'occurrence desespèces sélectionnées.
Principaux résultats:
Variations de la composition des communautés, diversité et relation avec les variables environnementales
Dans le cours aval du Mékong LMB, 299 taxons de macro-invertébrés distribués dans 196 genres et 90 familles ont été identifiées; dont 131 insectes, 98 mollusques, 38 crustacés et 32 annélides. Il s‘agit du plus grand inventaire réalisé pour le bas Mékong (LMB). Les taxons exotiques n'ont pas été évalués en raison du manque de données de distribution et des connaissances taxonomiques limitées. Les insectes se trouvaient principalement dans zones amont, caractérisées par une haute altitude, une eau claire avec une forte concentration d'oxygène dissous (DO); tandis que les mollusques, les crustacés et les annélides sont majoritaires dans les parties aval, caractérisées par une grande surface des bassins
ix
hydrographiques, des rivières profondes et larges et une température élevée de l'eau. Ces compositions diverses trouvées à différentes échelles spatiales donnent lieu à une diversité locale (Shannon-Weiner, H') qui s’accroit depuis les zones amont (H' = 1,9) vers les zones aval (H'= 2,7) ainsi qu’à une grande variation de biodiversité ou bêta-diversité (β) (BDTotal = 0,8 sur une échelle de 0 à 1). Lorsqu'ils sont calculés séparément pour chaque composante des communautés (ex. insectes, mollusques, crustacés et annélides), les mollusques et les insectes ont une variation plus élevée et leurs LCBD ont largement contribué à la diversité des communautés, alors que les crustacés et les annélides ont une variation plus faible et ont contribué moins à la bêta diversité. Un haut degré d'unicité dans la composition de la communauté de ce système tropical se produit surtout le dans les rivières, qui sont fortement associés aux perturbations anthropiques.
Dans les rivières flamandes, 207 taxons de macro-invertébrés appartenant à 145 familles ont été identifiés, dont 131 insectes, 34 mollusques, 21 crustacés et 21 annélides. Soixante-treize taxa exotiques de macro-invertébrés ont été récoltés. Dès le passé (D1) jusqu’à la période récente (D4), la plupart des taxa et leur abondance étaient liés à des valeurs élevées de DO et de faibles valeurs d'autres variables de qualité de l'eau; à l'exception du Chironomidae
thummi-plumosus, des Naididae et des Asellidae qui se sont révélés négativement associés à la
concentration de DO, mais liés positivement à la concentration d'ammonium (NH4+), de phosphate, de demande chimique en oxygène (COD) et de nitrate (NO3-). La diversité locale a augmenté de D1 (H' = 1,6) à D3 (H' = 1,9), mais a diminué en D4 (H' = 1,6), ce qui est dû à une augmentation énorme de l'abondance globale de macro-invertébrés dans la dernière période où la qualité de l'eau s'est considérablement améliorée. Cela peut indiquer que l'amélioration de la qualité de l'eau favorise fortement certains taxons dominants, ce qui augmente l'homogénéisation des communautés et diminue ensuite la diversité locale. La bêta diversité des communautés était modérée, mais a significativement augmenté de 1990s (BDTotal = 0,50) à la période la plus récente (BDTotal = 0,59). Lorsque la qualité de l'eau était médiocre (c'est-à-dire dans les années 1990s), une grande diversité saisonnière (α et β) a été observée; la diversité était faible au printemps par rapport à l'été et l'automne. Cependant, la différence saisonnière n'a pas été constatée dans les années 2000s au cours de laquelle le programme de réhabilitation de la qualité de l'eau dans la plupart des régions de la Flandre a été mis en place avec succès. Lorsqu'ils ont été calculés séparément pour chaque composante de la communauté, les mollusques et les insectes ont montré une grande β-diversité qui a toujours augmenté de D1 à D4, par rapport à la β-diversité des annélites (la plus faible) et des crustacés qui ont fluctué
x
entre D1 et D4. Les LCBDs des quatre composants ont considérablement contribué à la diversité des communautés. Un haut degré d'unicité de la composition de la communauté dans ce système tempéré était plus lié aux sites situés dans les cours d'eau du port principal et dans les polders saumâtres, où des valeurs élevées de conductivité électrique (EC) et de pH ont été enregistrées.
Modélisation d'occurrence d'espèces
Pour le LMB, l'occurrence de 199 espèces pourrait être prédite en utilisant LR, RF, SVM et ANN. Les quatre techniques de modélisation ont donné des résultats significativement différents (p<0,01), maisc’est l’ANN qui a donné les résultats les plus probants afin de prédire au mieux l'apparition d'espèces rares. Pour les rivières flamandes, l'apparition de mollusques exotiques et leur co-occurrence avec des mollusques indigènes ont été prédites à l'aide de CT. Sur la base des données de terrain de D1 à D4, les modèles de CT ne pouvaient prédire de manière fiable que la co-occurrence, mais pas la seule occurrence de mollusques exotiques. La co-occurrence dépendait principalement de la sinuosité et d'un ensemble de variables chimiques de qualité de l'eau (par exemple NH4+, NO3-, COD, pH). Lorsque les modèles CT ont été optimisés en incorporant des données de terrain et des données clonées (c'est-à-dire un ensemble de données obtenu par duplication indépendante des points de données de terrain par
k individus différents) par des modèles de diffusion et de prévision, l'occurrence de mollusques
exotiques a été correctement prédite avec un faible taux d'erreur. Ces résultats correspondent aux observations de terrain, où l'apparition de mollusques exotiques a été observée au cours des deux dernières décennies en Flandre.
Conclusions principales et remarques: Les conditions environnementales des deux systèmes favorisent certainement une composition différente de la communauté des macro-invertébrés et entraînent ainsi une variation différente. Nous avons constaté que le LMB possédait une plus grande diversité par rapport aux rivières flamandes. Cela pourrait être dû au fait que la plupart des invertébrés du LMB étaient identifiés au niveau de l'espèce, tandis que les invertébrés des rivières flamandes étaient identifiés uniquement à la famille ou au genre. Cependant, ces résultats ne révèlent pas vraiment la composition et la diversité réelles pour le LMB car il est très important, par rapport aux rivières flamandes, mais a été peu étudié. Le nombre de taxons du LMB est donc très probablement sous-estimé. En revanche, les rivières flamandes ont fait l'objet de suivis approfondis et ont été surveillées régulièrement. Néanmoins, les deux systèmes ont montré des similitudes; les mollusques et les insectes ont une variation totale plus élevée que les crustacés et les annélides. En outre, un degré élevé d’homogénéisation dans la
xi
composition de la communauté des deux systèmes se produit principalement dans les sites où un niveau élevé de perturbation anthropique a été observé. Parmi les variables environnementales mesurées, l'altitude, la superficie des bassins hydrographiques, la largeur et la profondeur, la profondeur de Secchi, la DO, la EC et la température de l'eau ont été les facteurs clés de la composition et de la diversité de la communauté des macro-invertébrés dans le LMB; tandis que dans les rivières flamandes, DO, EC, pH, NH4+, NO3-, COD, phosphate et sinuosité étaient les variables clés. Ces résultats peuvent fournir des informations et des idées utiles qui pourraient être utilisées pour soutenir la gestion, la conservation et la planification de la restauration dans chaque système.
Parmi les techniques de modélisation appliquées dans le LMB, l’ANN a permis d’obtenir les meilleurs résultats pour la prédiction de l'apparition d'espèces rares. La prédiction de l'apparition de mollusques exotiques dans les rivières flamandes a été réalisée avec succès à l'aide de modèles CT. Que ce soit dans les périodes passées ou récentes, les résultats de ces prédictions correspondent aux observations sur le terrain. Pour tester leur « transférabilité », les modèles les plus performants pourront être validés à l'aide de données collectées en dehors de la Flandre.
xii
Samenvatting
Doelstelling: In deze studie werd de benthische macroinvertebraten gemeenschap en diversiteit onderzocht in een tropisch en gematigde regio en werd de spatiale en temporele variatie in kaart gebracht. Tevens werd het effect van de fysico-chemische waterkwaliteit op de samenstelling en diversiteit onderzocht.
Locatie: Tropisch Azië: het Mekong bekken met een totale oppervlakte van 609,000 km2;
Gematigd Europa: beken en rivieren in Vlaanderen (België), met een totale oppervlakte van 13,787 km2.
Materiaal en Methoden: Voor het Mekong bekken werden data verzameld tussen 2004 en 2008 gebruikt en werd de mediaan bepaald. Voor Vlaanderen werden data verzameld tussen 1991 en 2010 gebruikt. De Vlaamse data werden in vier perioden ingedeeld, D1: 1991-1995, D2: 1996-2000, D3: 2001-2005 and D4: 2006-2010. Multivariate data analyse werd gebruikt om de samenstelling van de macroinvertebraten gemeenschap te koppelen aan de fysico-chemie. Vijf verschillende modelleertechnieken namelijk: Logistische Regressie (LR), Random Forest (RF), Support Vector Machine (SVM), Artificiële Neurale Netwerken (ANN) en Classificatiebomen (CT) werden gebruikt om de aanwezigheid van de taxa te modelleren. Resultaten:
Samenstelling in gemeenschap, diversiteit en relatie met milieuomstandigheden
In het Mekong bekken werden 299 taxa behorende tot 90 macroinvertebraten families geïdentificeerd van de welke 131 taxa behoorden tot de insecten, 98 taxa tot de mollusken, 38 taxa tot de kreeftachtigen en 32 taxa tot de wormen. Insecten werden hoofdzakelijk teruggevonden in de stroomopwaartse delen, welke gekenmerkt worden door een relatief grote hoogte, helder water en voldoende zuurstof. Mollusken, kreeftachtigen en wormen domineerden de lager gelegen gedeelten en waren sterk geassocieerd met diepere en bredere rivieren en een hogere watertemperatuur.
De verschillende gemeenschappen die voorkwamen in de verschillende locaties resulteerde in een verhoogde lokale diversiteit (Shannon-Wiener, H’) van stroomopwaarts naar stroomafwaarts en een sterke variatie in de totale variatie (β diversiteit). Wanneer elke gemeenschap individueel geanalyseerd werd, zag men een hogere variatie voor mollusken en insecten en droeg hun lokale diversiteit bij aan de globale diversiteit, terwijl de variatie voor kreeftachtigen en wormen veel kleinere was en ze minder bijdroegen aan de globale biodiversiteit.
xiii
Voor Vlaamse rivieren werden er 207 taxa (behorende tot 145 macroinvertebraten families) geïdentificeerd: 131 insecten, 34 mollusken, 21 kreeftachtigen en 21 wormen. Van D1 tot D4 steeg het aantal taxa en was de abundantie voor de meeste taxa gelinkt aan een verbetering in zuurstofgehalte en een daling in nutriënten, behalve voor de tolerante taxa zoals Naididae en Chironomidae welke daalden met een verbetering in waterkwaliteit. De lokale diversiteit steeg van D1 naar D3, maar daalde in D4, wat vooral ook te wijten is aan de enorme toename in abundantie gedurende de laatste periode, welke ook gekenmerkt wordt door een verbetering in de waterkwaliteit. Dit kan er op duiden dat de verbetering in waterkwaliteit het voorkomen van bepaalde dominante soorten promoot en dus ook bijdraagt tot een homogenisatie van de gemeenschap en dus een daling kan veroorzaken van de lokale biodiversiteit. De beta-diversiteit van de macroinvertebraten gemeenschap was gemiddeld, maar steeg van D1 tot D4. In het begin van de jaren 90 van vorige eeuw, wanneer de waterkwaliteit matig tot slecht was trad er een significant seizoenale diversiteit (α en β) op, de diversiteit was eerder laag in de lente en hoger in de zomer en herfst. Echter deze seizoenale diversiteit werd niet geobserveerd begin de jaren 2000s, wanneer het herstel van onze waterlopen volop startte en zijn eerste vruchten begon af te werpen.
Wanneer de diversiteit voor elke gemeenschap apart werd berekend, hadden mollusken en insecten altijd een hoge beta-diversiteit, welke altijd steeg van D1 naar D4, dit in tegenstelling tot de beta-diversiteit van wormen en kreeftachtigen welke fluctueerde tussen D1 en D4. De diversiteit van de vier verschillende gemeenschappen droeg significant bij tot de globale diversiteit. In de brakke polderwaterlopen en in de havens werden unieke gemeenschappen vastgesteld, locaties die werden gekenmerkt door een hoge Ph en geleidbaarheid.
Soorten voorspellingsmodellen
In het Mekong bekken werden de soorten voorspeld aan de hand van LR, RF, SVM en ANN. DE verschillende modelleertechnieken gaven een verschillende uitkomst. ANN gaf het beste resultaat en was ook beter in het voorspellen van het voorkomen van weinig voorkomende soorten.
In Vlaanderen werd het voorkomen van inheemse en uitheemse mollusken voorspeld op basis van classificatiebomen. Op basis van de data waren classificatiebomen in staat om een goede voorspelling te maken van het samen voorkomen van inheemse en uitheemse mollusken, maar niet van de uitheemse mollusken alleen. Het samen voorkomen van beide soorten was voornamelijk afhankelijk van de sinuositeit en verschillende waterkwaliteitsvariabelen (e.g. NH4+, NO3-, COD, pH). Na optimalisatie van de modellen door gebruik te maken van veld data
xiv
en gekloonde data (bekomen na het onafhankelijk dupliceren van de veld data door k verschillende individuen) en door gebruik te maken van hind- en forecasting kon het voorkomen van de mollsuken beter voorspeld worden met een lagere foutenmarge.
Conclusie en bedenkingen: De verschillende milieuomstandigheden aanwezig in de twee onderzochte systemen geven duidelijk aan dat zee en verschillende samenstelling in de macroinvertebraten gemeenschap teweeg brengen en dus ook leiden tot een verschil in variatie en diversiteit. In het Mekong bekken werd er een hogere diversiteit gevonden in vergelijking met Vlaanderen. Dit is voornamelijk te wijten aan het feit dat in het Mekong bekken macroinvertebraten tot op soort werden geïdentificeerd, terwijl in Vlaanderen slechts tot op genus of familie niveau wordt gedetermineerd. Daarenboven is ook de geografische omvang van beide systemen verschillend en dus moeilijk vergelijkbaar. Het is zo dat er in het Mekong bekken nog weinig studies rond macroinvertebraten zijn uitgevoerd en mogelijk is er dus zelfs nog een onderschatting van de werkelijk diversiteit. Desalniettemin vertoonden beide systemen toch ook enkele gelijkenissen, mollsuken en insecten vertoonden een hogere variatie in diversiteit in vergelijking met wormen en kreeftachtigen. Daarenboven werden vooral verstoorde milieu gekenmerkt door een hoge graad van uniekheid in samenstelling van de macroinvertebratengemeenschap. In het Mekong bekken waren vooral de volgende variabelen belangrijk voor de samenstelling en diversiteit van de macroinvertebraten gemeenschap: breedte en diepte van de rivier, de Secchi diepte, het zuurstofgehalte, de geleidbaarheid en de water temperatuur. In Vlaanderen waren het vooral volgende variabelen die een belangrijke rol speelden: zuurstofgehalte, geleidbaarheid, pH, ammonium, nitraat, CZV, fosforgehalte en sinuositeit. Deze informatie kan nuttig aangewend worden voor het beheer en herstel van aquatische ecosystemen.
Onder de gebruikte moelleertechnieken in het Mekong bekken, leverde ANN de beste prestatie en leverde het de beste resultaten voor het voorspellen van weinig voorkomende soorten. Het voorkomen van uitheemse mollusken kon in Vlaanderen goed voorspeld worden op basis van classificatiebomen. Om de algemene toepasbaarheid van deze modellen na te gaan wordt er voorgesteld om ook data buiten Vlaanderen te gebruiken.
1
1. General Introduction
1.1 Background to the study
Invertebrates, defined as organisms without backbones, are the majority of the global animal species, with an estimation of ~98% (May 1988; Chapman 2009). The invertebrates that can be seen without the aid of a microscope are referred to “macroinvertebrates”, which mainly comprise insects (an estimation of ~73%), arachnids (~9%), nematodes (~7%), molluscs (~3%), crustaceans (~2%), flatworms (~1%) and annelids (~0.4%) (Chapman 2009; IUCN 2014). In freshwater ecosystems, insects, molluscs, crustaceans and annelids are the most commonly found and most studied, compared to the other groups of invertebrates (Collier and Lill 2008; Arab et al. 2009; Pérez-Quintero 2011; Szöcs et al. 2014; Sor et al. 2017a).
Macroinvertebrates are a key component of freshwater ecosystems (Palmer et al. 1997; Bogan 2008). Firstly, they are considered as ecosystem engineers (Jones et al. 1994; Chowdhury et al. 2016). For example, crustaceans and insects are responsible for regulating decomposition, shredding detritus and bioturbation. Molluscs also contribute to bioturbation, sediment formation and filtering of water, while most annelids regulate decomposition and autotrophs although some of them also promote bioturbation and sediment formation (Palmer et al. 1997). Secondly, macroinvertebrates are key networks of food chains that are important in maintaining freshwater and terrestrial food webs (Fig. 1.1). Molluscs, crabs, shrimps and other benthos (e.g. annelids and insects) are the food sources for reptiles (e.g. turtles), numerous carnivorous fish species (Chea et al. 2016), and some terrestrial predators including birds (Poulsen et al. 2004). Moreover, freshwater macroinvertebrates are generally used as bioindicators and bioassessment. For instance, the presence of mayflies, caddisflies and stoneflies (insects) can indicate good water quality conditions, while the presence of annelids, clams, pouch snails, water bugs and crayfish can indicate a moderate to high level of pollution in the water (Feld and Hering 2007; Collier and Lill 2008; Królak and Korycińska 2008; Wang et al. 2012). Due to these facts, macroinvertebrates have been used for bioassessment, which is useful to support management, restoration and conservation planning in freshwater ecosystems (Heino and Mykrä 2006; Kudthalang and Thanee 2010).
2
Fig. 1.1 Freshwater food web in the Tonle Sap Lake and River ecosystem, Cambodia. The size of each circle represents the biomass (tonne/km2) of each functional group (e.g. shrimps, crabs, molluscs etc. (Chea et al. 2016).
Structure and spatial patterns of lotic macroinvertebrate communities are known to organize along a longitudinal downstream river/stream gradients (Vannote et al. 1980; Friberg et al. 2010). In the upstream parts, the communities are mainly characterized by a high abundance of insects (Collier and Lill 2008; Arab et al. 2009; Jiang et al. 2013), whereas the downstream communities are characterized by a high abundance of molluscs, crustaceans and worms (Arscott et al. 2005; Collier and Lill 2008; Pérez-Quintero 2011). For pristine or undisturbed rivers, structural and functional macroinvertebrate communities are adapted to conform to the most suitable positions, depending on the available energy flow and environmental variability, throughout the river’s continuum (RCC, Vannote et al. 1980). According to RCC, communities in the headwaters, collecting energy from decayed leaves, needles and stems, are mostly composed of shredders, collectors and less grazers/scrapers. The mid-reach, being strongly exposed to sunlight, supports more grazers/scrapers and collectors, and the lower-reach, having a low photosynthesis production in the rivers (due to high turbidity and surface film) and high energy inputs (mostly from upstream sources), is home to numerous collectors. However, in large/floodplain rivers, which receive a high level of disturbance, the RCC cannot be applied to address the biological systems. This is because differences between biotic community composition in these rivers are determined by spatial and temporal heterogeneity along the rivers (Sedell et al. 1989), and by natural and human-derived disturbances (Clarke et al. 2008; Muñoz et al. 2009).
3
Distribution, composition and diversity patterns of macroinvertebrates greatly vary depending on studied climatic regions (e.g. tropical vs temperate), zoogeographic regions (e.g. Palaearctic, Nearctic, Neotropical, Afrotropical, Oriental and Australasian) and geographic regions (e.g. Asia, Europe, America and Africa) (Martin et al. 2008; Yeo et al. 2008; Bogan 2008; Ferrington 2008). The variation in composition and diversity found from each climatic and zoogeographic region may reveal the different favourable environmental conditions for diverse taxonomic groups to live on (Dudgeon et al. 2006; Boulton et al. 2008). However, the ecological processes in these systems appear to be driven by more or less the same variables, e.g. drought, disturbance, nutrient concentration and trophic structure (Boulton et al. 2008; Dudgeon 2008). Nevertheless, geographic regions that lie in the tropical zone harbour a higher biodiversity, at least for most invertebrate taxa, than those lie in the southern or northern temperate zone (Sodhi et al. 2004; Boulton et al. 2008). However, stream invertebrate ecology in many parts of tropical region (e.g. South America, Africa, and Asia) remains little investigated, whereas stream invertebrates in temperate regions (e.g. North America, Europe, Australia and New Zealand) have been well studied (Dudgeon 2008; Boyero et al. 2009).
1.2 Macroinvertebrates in Asian and European rivers: a general overview
Taxonomic and ecological knowledge on freshwater macroinvertebrates in Asia, as mentioned earlier, is still limited (Boulton et al. 2008; Boyero et al. 2009). Most research in the tropical Asia is largely restricted to a few geographic regions including the Hong Kong and Peninsular Malaysia (Resh 2007; Boyero et al. 2009; Leung and Dudgeon 2011; Al-Shami et al. 2013). A wider range of studies has also been revealed from the northern subtropical Asian rivers, e.g. Yangtze and the Upper Mekong River or the so-called Lancang River in China. Research topics from these river basins include species distribution, spatio-temporal patterns and species records (Nieser et al. 2005; Shao et al. 2008; Qi et al. 2012). However, most of the research findings are reported in Chinese and are not publically available; only a few are accessible, e.g. the benthic macroinvertebrates as indicators of ecological status in Yangtze River (Pan et al. 2013) and the seasonal variability of metazooplankton (including crustaceans) communities and new mollusc species records from the Upper Mekong Basin (Du et al. 2011; Wu et al. 2014). For the Lower Mekong Basin, more investigations have been recently conducted in Thai streams (Boonsoong et al. 2010; Kudthalang and Thanee 2010; Phaphong and Sangpradub 2012; David and Boonsoong 2014) and recently also some Philippine streams have been investigated (Tampus et al. 2012; Sinco et al. 2014; Fajardo et al. 2015; Magbanua et al. 2015,
4
Forio et al. 2017). Most of these studies are related to species diversity, description of new species and using benthos to assess water quality in river systems (Parnrong et al. 2002; Sangpradub et al. 2002; Flores and Zafaralla 2012). Macroinvertebrates from other geographic areas including Myanmar, Laos, Cambodia and Vietnam, which mainly share the Lower Mekong Basin, remain very scarce.
On the contrary, knowledge on macroinvertebrates from river systems in Europe has been extensively studied (Boyero et al. 2009). Since the adoption of the European Water Framework Directive (WFD) (European Commission 2000), freshwater macroinvertebrates have become the central focus (Pollard and Huxham 1998; Hering et al. 2010). Macroinvertebrates from hundreds of streams have been studied and used to assess water quality (Buffagni et al. 2001; Verdonschot and Nijboer 2004). Within 10 years of the implementation, ~1,900 papers resulted from research projects associated with WFD (Hering et al. 2010). This results in a very well documented knowledge on freshwater macroinvertebrates and their ecological applications for Europe. Furthermore, a diverse assessment methods have been developed (Birk et al. 2012), some of which have applied a predictive modelling framework that is based on macroinvertebrates or use environmental variables to predict future distribution, occurrence and abundance of particular taxa (Goethals et al. 2007; Everaert et al. 2013; Boets et al. 2015). When macroinvertebrate composition and diversity are related to measured environmental variables, key factors driving spatio-temporal changes have been known to be more or less the same regardless of geographic or climatic regions. For instance, macroinvertebrate communities in river basins from southern China (Pearl, Yangtze and Qiangtang rivers), from northern Portugal (the Olo, Corgo, Pinhao and Tua rivers) and from Susquehanna River (New York, North America) have been reported to be influenced by land use types including anthropogenic disturbance (Allan 2004; Bruns 2005; Cortes et al. 2011; Cortes et al. 2013). Another example can be found from European Mediterranean (Evrotas River, Greece) and Asian streams (Peninsular Malaysia) that stream size (e.g. width and depth), dissolved oxygen and pH were the key factors influencing macroinvertebrate composition and variation (Al-Shami et al. 2013; Salmah et al. 2014; Karaouzas and Płóciennik 2016). These indicate that similar ecological processes can be expected from different ecological systems.
5
1.3 Modelling techniques and applications
Various modelling techniques have been widely and increasingly implemented in ecological systems (Lek et al. 1996; Park et al. 2003; Schröder et al. 2007; Lencioni et al. 2007; Guo et al. 2015). The techniques applied are generally used to explain and predict the relationship between the occurrence or abundance of studied species and environmental variables (Goethals et al. 2007; Boets et al. 2013). Utilization of modelling techniques to combine both explaining and predicting such relationships is also commonly applied (Roura-Pascual et al. 2009; Call et al. 2016). Applications of predictive models have provided knowledge and improved the understanding of the ecology and behaviour of studied taxa, which could be used to support decision making, management and conservation planning. For instance, many previous studies have used predictive models to predict the occurrence and distributional areas of plants, herbs, macroinvertebrates and fish (Thuiller et al. 2005; Roura-Pascual et al. 2009; Vicente et al. 2011; Boets et al. 2013; Chen et al. 2015; Guo et al. 2015).
However, the application of predictive models has been suggested to be carefully taken into account because they can have a wide variation in performance (Segurado and Araujo 2004; Elith et al. 2006; Guisan et al. 2007). Some models even yield contrasting predictions of habitat suitability (e.g. Guisan et al. 2007; Evangelista et al. 2008; Roura-Pascual et al. 2009). Furthermore, predictive models are sensitive to parameterization and selection criteria during the modelling process (Araújo and Guisan 2006; Elith et al. 2006), and thus can result in an uncertainty of current or past/future projections of species distributions (Svenning et al. 2008; Buisson et al. 2010). Due to this fact, when calibrating and validating predictive models, carefully taking into account the data characteristics (e.g. sample size, species prevalence or environmental predictors), parameterization and selection criteria are usually recommended (Luoto et al. 2006; Dormann et al. 2008).
1.4 Research problem, aims and objectives
The Lower Mekong Basin (LMB), which includes portions of Thailand, Laos, Cambodia and Vietnam, is characterized by a long and large floodplain (Eastham et al. 2008) and is known for its high biodiversity (Sodhi et al. 2004). However, the knowledge of macroinvertebrates in the LMB is poorly investigated. Given that this river basin is being impacted by various anthropogenic disturbances such as agricultural activities, aquaculture, urbanization and mining (Sodhi et al. 2004; Nhan et al. 2007; Köhler et al. 2012), there is an urgent need to study the
6
patterns of spatial organization, community structure and variations of macroinvertebrates in this basin and their relation to environmental factors. Up to date, only a few studies (except for those conducted in Thailand) have been published on the basin, e.g. community structure and composition of littoral invertebrates in the Mekong delta (Wilby et al. 2006) and the diversity and distribution of crustaceans and molluscs in the Indo-Burma region (Cumberlidge et al. 2011; Köhler et al. 2012). Yet, no attempt has been made to examine the large spatial patterns, community structures, variations (i.e. β diversity) of macroinvertebrate communities and their relation to key environmental variables nor the application of predictive modelling in this hardly studied basin.
On the other hand, river systems in Europe as well as in Flanders suffered from severe water quality degradation in previous decades (e.g. from 1980s to 1990s). During these periods, some native species were reported to disappear (Bernauer and Jansen 2006) and only those that were able to withstand the water quality degradation remained. At the same time, most European river systems have been exposed to a number of alien macroinvertebrate species (Leuven et al. 2009; Boets et al. 2016). From the 2000s until now, the water quality of European rivers has been greatly improved. This water quality improvement does not only promote the occurrence and abundance of native species, but also favours the alien species to spread widely, which consequently may lead to changes in community composition. As such, investigation spatio-temporal changes in community composition, variations and predicting the occurrence of alien species across Flemish rivers, which have been poorly studied, will provide insights into the ecology of overall communities and of studied alien species. Results from this investigation can be used to support management and conservation planning.
The aims and specific objective (or questions) of the present study are:
Aim 1. Investigating general patterns of macroinvertebrate communities and their relation to environmental variables in the two systems, i.e. the LMB and Flemish rivers.
1.a. Investigating patterns of spatio-temporal variation in macroinvertebrate assemblages/communities.
1.b. Analysing the variability of macroinvertebrate composition among the assemblages/communities, and determining key indicator/important taxa (the most representative taxa/taxa with high among-site variance).
1.c. Identifying the important environmental variables that are associated with the particular macroinvertebrate assemblages/communities.
7
Aim 2. Determining the total variation in macroinvertebrate communities (i.e. total β diversity) and the key determinants in the two systems.
2.a. Is there a moderate or a large amount of total β diversity? 2.b. What are the taxa that contribute most to the total β diversity?
2.c. What are the environmental conditions and component communities (e.g. annelids, crustaceans, insects and molluscs) that significantly influence the total β diversity?
Aim 3. Predicting macroinvertebrate species occurrence and analysing the performance of modelling techniques applied in the LMB.
3.a. Predicting the occurrence of macroinvertebrate species and comparing the performance of the applied techniques based on a complete prevalence range (i.e. 0.0-1.0), and different prevalence ranges (i.e. at a 0.1 interval).
3.b. Analysing how the species prevalence affects the behaviour of modelling techniques’ performance.
Aim 4. Predicting the occurrence of alien species and their co-existence with native species and identifying the key determining variables in Flemish rivers over the past two decades (1991-2010).
4.a. Identifying key determining physical-chemical variables associated with the occurrence of alien species (i.e. alien molluscs) and with the co-occurrence of alien and native species, using a classification tree modelling technique.
4.b. Optimising the reliability of classification tree models in predicting alien mollusc occurrence.
8
2. Materials and Methods
2.1 Case study in the LMB and dataset
2.1.1 The LMB
The Mekong River Basin is divided into the Upper Mekong Basin (UMB) and the Lower Mekong Basin (LMB). The UMB on the Tibetan plateau in China is composed of narrow, deep gorges and small, short tributaries, whereas the LMB stretches from Yunnan province in South China to the delta in Vietnam and it covers approximately 70% of the total length of the whole basin (Eastham et al. 2008). The LMB consists of a large floodplain and long, broad tributaries and it drains more than 76% of the Mekong basin. The climate of the LMB is dominated by a tropical monsoon rainfall system, which is characterized by a dry (November – April) and a wet (May – October) season generated by the northeast monsoon and the south-west monsoon, respectively. The most intensive rainfall falls from July to September, while the lowest precipitation is observed between January and April (Adamson et al. 2009). The annual rainfall of the LMB varies from 1,000 – 1,600 mm in the driest regions to 2,000 – 3,000 mm in the wettest regions (Hoanh et al. 2003). A higher precipitation is found in the eastern mountainous regions of Laos and in northeast Thailand (Eastham et al. 2008).
The largest floodplain water body of the LMB is the Tonle Sap Lake (TSL) in Cambodia (Adamson et al., 2009), which is the largest freshwater lake in Southeast Asia (Sarkkula et al. 2003). The TSL is connected to the Mekong through the Tonle Sap River, and thus creating an exceptional hydrological cycle. In the wet season, the TSL receives excess water from the Mekong River and expands its surface area from 2,500 km2 to 15,000 km2. In the dry season when the rain ceases and water levels drop in the Mekong, a reverse flow occurs; the drained water from the TSL flows to the Mekong delta (Arias et al. 2011). The Mekong delta is characterized by a number of man-made canals, which are mostly used for domestic and agricultural activities (Kummu et al. 2008).
2.1.2 Data collection and processing
Benthic macroinvertebrates were sampled at 60 sampling sites along the main channel of the LMB and its tributaries by the Mekong River Commission (MRC) (Fig. 2.1). This sampling was carried out once a year in March during the dry season from 2004 to 2008. At each sampling site, macroinvertebrates were sampled from three locations in the benthic zone: near the left and right banks, and in the middle of the rivers. At each location, a minimum of three samples (where inter-sample variability is low, e.g. tributaries) to a maximum of five samples (where
9
inter-sample variability is higher, e.g. the main channel and the delta) were collected using a Petersen grab sampler which has a sampling area of 0.025 m2. With the grab sampler, four sub-samples were taken and pooled to give a single sampling unit covering a total area of 0.1 m2. In total, between nine (3 samples × 3 locations) and fifteen (5 samples × 3 locations) pooled samples were collected at each sampling site. Each pooled sample was rinsed using a sieve (0.3 mm mesh size). In the field, the samples were sorted and then preserved by adding 10% formaldehyde to obtain a final concentration of about 5%. In the laboratory, they were identified to the lowest taxonomic level possible and counted using a compound microscope (40 – 1,200 magnification) or a dissecting microscope (16 – 56 magnification). Macroinvertebrate abundance data per sampling unit was averaged across all samples (between 9 and 15 samples) collected from each sampling site.
Fig. 2.1 The Lower Mekong Basin (LMB, A) and macroinvertebrate sampling sites (shaded dots, B). Sub-samples and replicates were taken at each sampling site as illustrated in C.
10
At the sampling site, geographic coordinates and altitude were determined with a GPS (Garmin GPS 12XL). River width was measured in the field using a Newcon Optik LRB 7x50 laser rangefinder. Other physical-chemical variables were measured at the three locations where macroinvertebrates were sampled. River depth was measured using a line metre. With a handheld water quality probe (YSI 556MP5), water temperature, dissolved oxygen, pH and electrical conductivity were measured at the surface (0.1-0.5 m) and at a depth of 3.5 m or at a maximum depth of the river (wherever less than 3.5 m) and then the average value was recorded for each location. Water transparency was measured with a Secchi disc by lowering it into the water and recording the depth at which it was no longer visible. The physical-chemical data of each sampling site was the averaged value across the three sampling locations. Distance from the sea and the surface area of watersheds drained at each sampling site was determined using a Geographic Information System (ArcGIS 10.0, ESRI). Geographic data (ArcGIS shapefiles) about the LMB (river networks, basin boundaries, land covers, and subcatchments derived from topographical maps) was provided by the MRC.
In total, 108 samples were collected from the 60 sampling sites. In 2008, 3 sampling sites were sampled further away from their original sampling coordinates, and thus were considered as different sampling sites (see Appendix T1). Therefore, a total of 63 sampling sites were taken into account in the analyses. Because of unequal sampling efforts (i.e. unequal and different number of samples at each site during the 5-year sampling period) and missing values of environmental variables, we used median values from the collected data to represent each site in the analyses, as suggested by McCluskey and Lalkhen (2007). These median values were used in all of the analyses corresponding to the case study of the LMB.
2.2 Case study in Flemish rivers and dataset
2.2.1 Flanders
Flanders (northern Belgium) is located in Northwest Europe and its Northwestern part is bordered by the North Sea (Fig. 2.2A). Flanders has a total area of 13,522 km2, and is considered as one of the most densely populated regions in Europe (477 inhabitants/km2 in 2015,
https://en.wikipedia.org/wiki/). Flanders is classified as a lowland area, which is divided into different rivers basins (Fig. 2.2B). This region is influenced by a temperate oceanic climate, as same as most of northwestern European countries are (e.g. UK, France, Luxembourg, Netherland and Denmark) (Peel et al. 2007). Flanders has a dense watercourse network including navigable canals. Agriculture, industry and residential areas are the main land use
11
types of Flanders and its landscape is characterized by highly fragmented and complex mosaic of land use types (Poelmans and Van Rompaey 2009). This fragmentation and complexity may have put a high pressure on habitat quality and biodiversity in Flanders.
Fig. 2.2 Map of Flanders indicating: (A) the most important watercourses and geographic locations, the polder area (grey) and the three main harbours indicated by rectangles (Boets et al. 2016), (B) different river basins (van Griensven and Vandenberghe 2006) and (C) monitoring sites between 1991-2010, which were used in the present study.
12 2.2.2 Data collection and processing
The Flemish Environment Agency (VMM) has collected biological and environmental data in Flanders since 1989. The monitoring sites include all types of watercourses from all river basins. Every three year from the beginning, a fixed set of sampling locations was sampled. Most of the sampling locations were only sporadically sampled, and thus results in a large dataset of more than 11,000 biological samples collected at more than 2500 sites spread over different water bodies (Fig. 2.2C). In this monitoring program, the sampling protocol was entirely based on the method as described by Gabriels et al. (2010). Macroinvertebrates were collected using a standard handnet, which is made of a metal frame (0.2 m by 0.3 m) to which a conical net is attached with a mesh size of 300 µm. The kick sampling was made along the watercourses at a stretch of approximately 10-20 m. Each sample was collected for three minutes for small watercourses (less than 2 m wide) or five minutes for larger rivers. At sampling sites where the kick sampling method was not possible, artificial substrates were used. Three replicates of artificial substrates, which consisted of polypropylene nets (5 litres) filled with bricks of different sizes, were left in the water for a period of at least three weeks after which they were retrieved. Leaving this period enables species to colonize the substrates. The different sampling efforts of the two sampling approaches (the kick and artificial substrate sampling) may have repercussion on the diversity of sampled invertebrates. However, according to Gabriels et al. (2010), the two approaches are standardized semi-quantitative methods and are similar in terms of sampled macroinvertebrate abundance. In the laboratory, macroinvertebrates in the VMM database were identified to the level (family or genus) needed for the calculation of the biotic water quality index.
Electrical conductivity (EC), pH and dissolved oxygen (DO) were measured in the field with a hand-held probe (Cond 315i, oxi 330, wtw, Germany and 826 pH mobile, Metrohm, Switzerland). All additional chemical variables, i.e. ammonium (NH4+), chemical oxygen demand (COD), biological oxygen demand (BOD), total phosphorus (Pt), nitrate (NO3-), nitrite (NO2-), Kjeldahl nitrogen, orthophosphate (oPO4), were retrieved from the monitoring dataset compiled by the VMM and which is online accessible (www.vmm.be). Nutrient analysis was performed spectrophotometrically in accordance to ISO 17025. GIS software (version 9.3.1) applied on the Flemish Hydrographic Atlas was used to determine the slope and the sinuosity of a watercourse at a different height in between two points (1000 m apart) and on a stretch of 100 m, respectively.
13
Data from 1991 to 2010 was used for the analyses. Based on the preliminary data mining, the overall communities had a temporal change (especially a somewhat different community composition for the late 2000s) which could be grouped based on a five-year interval. Therefore, the data were then divided into 4 periods. Each period consisted of samples from a five-year sampling effort (i.e. D1: 1991-1995, D2: 1996-2000, D3: 2001-2005 and D4: 2006-2010). This division can provide useful information on changes in community composition for each period. To analyse spatial variation in the community composition, the median values were used to represent each site for each period. This is because, as mentioned earlier, only a fixed set of sampling locations was sampled regularly whereas most of the other sampling locations were sporadically sampled. For the modelling purposes (see the detailed in the “Modelling” section below), all collected samples were used.
2.3 Statistical analyses and modelling approaches
I analysed only four groups of macroinvertebrates in this study. This is because they are the most commonly studied animals and are generally used as bioindicators and assessment in freshwater ecosystems (Feld and Hering2007; Collier and Lill 2008; Wang et al. 2012). The four groups included annelids, crustaceans, insects and molluscs. These four groups were designated as component communities in following paragraphs onwards. All the applied statistical analyses and modelling approaches were performed using functions of packages in the R language program (R Core Team 2013).
2.3.1 Communities clustering and diversity measures
Samples were clustered based on the Bray-Curtis dissimilarity of macroinvertebrate abundance data by using Ward's hierarchical method. The Bray-Curtis dissimilarity distance (Legendre and Legendre 2012) between the macroinvertebrate samples was calculated using the Hellinger transformation in the package vegan of R (Rao 1995).
The macroinvertebrate indicator taxa in each assemblage were determined using the Indicator Value (IndVal, Dufrene and Legendre 1997) with the package labdsv of R (Roberts 2013). The Indicator Value of a taxon is an index ranging from 0 to 1, indicating the least to most important taxa occurring in a group of sites. A value of 1 is obtained when every individual of the taxon is found only in the group and when it occurs at all sites of that group. A high number of taxa with significant Indicator Values may provide information on the habitat they prefer to share. Taxa having Indicator Values with a p-value ≤0.01 were retained as the most important taxa representing a given assemblage (consisting of a group of sites).
14
Macroinvertebrate richness, abundance and Shannon-Wiener diversity (H’) were calculated for each sampled site, cluster and group. To quantify beta (β) diversity, the community composition data were first Hellinger-transformed (Legendre and Gallagher 2001; Legendre and Legendre 2012). For Hellinger-transformed data, the total variance, or total β diversity (BDTotal), of a community composition data table is an index between 0 and 1, and it can be partitioned into local contribution (LCBD) and species contribution (SCBD) indices. An LCBD value is an index showing the degree of uniqueness in taxonomic composition in each site, computed as the relative contribution of a site to BDTotal, so that the LCBD indices sum to 1, whereas an SCBD index shows the relative degree of variation of a taxon across all sites. The BDTotal, LCBD and SCBD indices were computed using the function “beta.div” available in the
adespatial package in R (Dray et al. 2016). The Hellinger transformation was used because the
corresponding Hellinger distance is one of the dissimilarity functions admissible for β diversity analyses (Legendre and Gallagher 2001; Legendre and De Cáceres 2013); it does not give high weights to the rare species. In addition to LCBD, Hellinger-transformed data also allow researchers to compute SCBD indices; this is not allowed by most other admissible dissimilarity functions (Legendre and Gallagher 2001; Legendre and De Cáceres 2013). SCBD indices that were higher than the mean of SCBD values identified the taxa that were the most important contributors to BDTotal. In the following paragraphs, BDTotal, LCBD and SCBD designate the indices of the global macroinvertebrate communities, whereas BDATotal, BDCTotal, BDMTotal, BDITotal, and LCBDA, LCBDC, LCBDM and LCBDI designate the BDTotal and LCBD indices for annelid, crustacean, mollusc and insect communities, respectively.
2.3.2 Comparative analyses
Descriptive statistics were used to describe and summarize the information of the collected data. These included minima, maxima, mean, range, standard deviation (sd), sample size, and percentage. In most cases, mean and standard errors were used to indicate significant differences in macroinvertebrate composition, environmental conditions and model performances between/among groups. Where applicable and appropriate, a one-way ANOVA or a Kruskal-Wallis test was used to test for significant differences between/among unmatched groups (≥3 groups). One-way ANOVA was applied when residuals of the models were normal (Shapiro-Wilk test, p > 0.05, and homoscedastic (Bartlett's test, p > 0.05)); otherwise, the non-parametric test (Kruskal-Wallis) was used. For matched groups (dependent samples), a multi-factor ANOVA and a Friedman test were used when the data was normal and not-normal distributed, respectively.