Science Arts & Métiers (SAM)
is an open access repository that collects the work of Arts et Métiers Institute of
Technology researchers and makes it freely available over the web where possible.
This is an author-deposited version published in: https://sam.ensam.eu
Handle ID: .http://hdl.handle.net/10985/19558
To cite this version :
Amélie BEAUVILLE DIT EYNAUD, Nathalie KLEMENT, Lionel ROUCOULES, Olivier GIBARU, Laurent DURVILLE - Risk and decision analysis for Reconfigurable Assembly System Design under uncertainties In: 13th International Conference on Modeling, Optimization and Simuation -MOSIM'20 - November 12-14, 2020 Agadir - Morocco "New advances and challenges for
sustainable and smart industries", Maroc, 2020-11 - 13th International Conference on Modeling, Optimization and Simuation - MOSIM'20 - November 12-14, 2020 Agadir - Morocco "New advances and challenges for sustainable and smart industries" - 2020
Any correspondence concerning this service should be sent to the repository Administrator : [email protected]
Design under uncertainties
Am´elie BEAUVILLE DIT EYNAUD, Nathalie
KLEMENT, Lionel ROUCOULES, Olivier GIBARU Laurent DURVILLE Arts et M´etiers Institute of Technology, LISPEN Groupe PSA
HESAM Universit´e Route de Gisy
8 boulevard Louis XIV, 59046 Lille, France 78943 V´elizy-Villacoublay
[email protected] France
ABSTRACT: To face the variable demand of the market, modular and mobile equipment are integrated on production lines. Previous works proposed design and evaluation methodologies to build reconfigurable production systems. However, taking the right decision concerning investments and the choice of equipment may be complex. In this paper, we present RAS design from a risk and decision analysis perspective to support decision making. Market demand scenarios are associated with occurrence probabilities. A decision tree represents consecutive scenarios, for which the decision maker is proposed to make a choice regarding investments for the assembly line. The utility function is computed based on the decision makerˆas attitude to risk. The objective function computing the final score of a scenario and a decision covers investments, reconfigurability rate and performance of the system. Implications of early investments towards reconfigurability can be identified. The approach is applied on a real use case from the automotive industry.
KEYWORDS: Changeability, Reconfigurability, Reconfigurable Assembly System, Decision Support Tool, Decision analysis
1 INTRODUCTION
To face a volatile and unpredictable customer de-mand, developments of a new generation of produc-tion systems, Reconfigurable Manufacturing and As-sembly Systems (RMS and RAS), have been carried out. (Koren et al., 1999) formalized the paradigm of reconfigurability in Production Systems (PS), and defined six core characteristics of production systems: scalability, modularity, integrability, customisation, convertibility and diagnosability.
Fluctuations of the market imply the need of a pro-duction system able to follow changes in terms of product type or production volume. Depending on the economical context, companies need to quickly configure and set adjustment parameters of the sys-tem. In order to achieve these quick changes, RMS and RAS integrate modular tools and machines, and easily movable equipment (Beauville dit Eynaud et al., 2018). An important point is also to integrate consideration of changeability at early stages of pro-duction system development (Andersen et al., 2017). Companies are not familiar with changeable systems and research works focus on supporting the indus-try in the process of RMS integration. Furthermore,
decision makers struggle with the evaluation of new generation PS on criteria which are hardly compara-ble on a same scale. Indeed, the comparison of per-formance metrics with reconfigurability indicators is questionable. We aim to support RMS Design by an-swering the question of how to invest and adjust in the best way the production system.
During the PS life-cycle, the economical context will change. In this paper, the demand is modeled by sce-narios, for which are periods of time are correspond-ing to a market requirement, for which a configuration has to be selected. In the proposed Reconfigurable Production System Design Problem (RPSDP), con-secutive scenarios are considered, and implications of early decisions in a previous scenario are taken into account in next scenarios. In this paper, a ”scenario” corresponds to the succession of a decision step fol-lowed by a market evolution (event). The problem to solve is the choice to invest or not in a new resource for each time period, without knowing with certainty how the market will change.
MOSIM’20 - November 12-14, 2020 - Agadir - Morocco
2 STATE OF THE ART
2.1 Decisions in reconfigurable production systems design
Previous research focused on providing support tools for companies to choose appropriate resources and PS configuration in the design process. (Andersen et al., 2017) and (Beauville dit Eynaud et al., 2020) pro-posed RMS/RAS design methodologies, covering de-sign steps from needs identification to final decision. In order to support the design process, reconfigura-bility metrics have been investigated and developed based on the six core characteristics of reconfigura-bility (Wang et al., 2017; R¨osi¨o et al. 2019; Beauville dit Eynaud et al., 2020). In particular, (Beauville dit Eynaud et al., 2020) defined quantitative metrics for reconfigurability evaluation of RAS, and compared obtained metrics with performance indicators evalu-ated by discrete event simulation (DES). Results are then made available on a dashboard for the decision maker.
However, during the design procedure, the company needs to evaluate various technical solutions (for ex-ample fixed, movable or mobile robots), several lay-out configurations, and different demand scenarios. Then, based on metrics evaluated for all these cases, a decision has to be taken. The decision maker faces many indicators with a complex imbrication: if a technology has been adopted in a first investment step, this decision will have consequences on invest-ment decisions in the next steps, that is to say in the next scenarios. The problem can be modeled using a tree structure, where each node corresponds to an investment decision or to an event (market change). 2.2 Risk decision analysis
Decision analysis supports judgement in the case of complex, multi-criteria and multi-stages scenar-ios. It enables an objective, mathematical-based de-cision instead of a bias-distorted dede-cision when con-ducted without methodology (Tversky and Kahne-man, 1974). Risk decision analysis covers the study of alternatives, influences between parameters and their prioritisation. The scope of decision analysis is wide and covers the economic sphere, risk analysis in engi-neering, medicine, etc.
In the domain of floating production storage and of-floading units, (Lassagne, 2000) studied the impact of the integration of risk-reduction measures on offshore installations on both technical and economical sides. In the automotive sector, (Tchoffa et al., 2012) ap-plied decision analysis on the management of indus-trial incidents. With their model, authors are able to
evaluate the impact of the different incident causes, their inter-relations and their probabilities of occur-rence.
The methodology to model a decision problem in an uncertain environment is the following (Clemen and Reilly, 2013):
1. Identification of the situation and objectives 2. Identification of alternatives
3. Problem modeling
4. Determination of the best alternative 5. Sensitivity analysis
The decision maker’s attitude to risk is evaluated based on equivalent lotteries which enables to define the utility function. The principle of an equivalent lottery is to give the choice between two lotteries: for example, winning a high gain with 10 % chance and not winning at all with 90 % chance, or winning a small gain with 50 % chance. If the decision maker chooses the second lottery, he is risk-averse. In the case of conflicting objectives, the equivalent lotter-ies also support the definition of the multi-attribute utility function based on the company’s priorities. In the problem modeling step, an influence diagram is built to represent in a formal way decisions, un-certainties, values and inferences. It is an oriented acyclic graph with decision nodes and value nodes (deterministic nodes) (Clemen and Reilly, 2013). The influence diagram is an extension of Bayesian net-works, as the nodes of the graph correspond to prob-ability distributions and arcs between nodes to de-pendencies between those distributions. The decision tree is then built to represent the sequentiality of de-cisions and events in an explicit way. A decision tree is an oriented graph with uncertainty nodes, decision nodes and terminal nodes.
The resolution process is decomposed in two steps, with the objective to maximise the expected value of the profit (Goodwin, 2004). Using the decision tree, in the roll-forward step, the final payoffs of each alternative, corresponding to a branch of the decision tree, are calculated. Then, the rollback step consists in the computing of the profit value for each terminal node. The chosen decisions are the ones with the highest expected values.
2.3 Conclusion of the literature review In a volatile environment, it is complex to take ob-jective decisions regarding investments. Furthermore, decision makers can be influenced by a bias regarding
new technologies: mistrust or on the contrary blind trust.
The industry needs a decision support tool for the de-sign of RMSs and RASs. Previous works fixed dede-sign methodologies and evaluation criteria to help design and rating of the integration of new technological so-lutions or configurations of the production system. However, the quantity of parameters to take into ac-count while conceiving a manufacturing system (per-formance, reconfigurability, and costs metrics) makes the decision process complex. In addition, it is com-plex to have a clear overview of consequences of con-secutive decisions over scenarios. By modeling uncer-tainty about future market trends, it is possible to simulate the system evolution following consecutive decisions.
Decision makers need an overview over market de-mand scenarios supporting multi-criteria evaluation of decisions.
3 DECISION ANALYSIS FOR RAS
DE-SIGN
3.1 Case study: Multi-product assembly line The case study is a multi-product engine assembly line in the automotive industry, facing a varying de-mand in both product mix and volume. To face changing market requirements, the new strategy of the company is to transform its production system into a RAS. However, taking decisions in this context is complex. Indeed, decision makers are not familiar with the new reconfigurable equipment, and in ad-dition, the production system seeks contrary goals: being efficient, as well as rapidly reconfigurable and economically interesting.
The objective is to maximise the utilisation rate of machines, minimise investments and maximise recon-figurability of the system.
Alternatives offered to the decision-maker are, at the beginning of each scenario, to choose to invest in a new resource, or to abstain from investing. Each resource type has a different price, reconfigurability rate and utilisation rate. This last parameter is de-termined by running the same scenarios in a Discrete Event Simulation software, enabling assessment of the performance of the production system with the new machine. The price of resources is also known, and the reconfigurability metric of each resource is com-puted by means of the formula defined in (Beauville dit Eynaud et al., 2020), based on reconfigurability characteristics defined by (Koren et al., 1999). In this study, we propose two scenarios for the vari-ations of the market demand: an increase and a de-crease of the demand.
3.2 Model
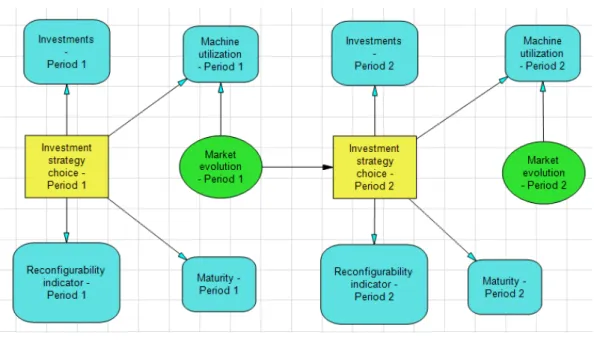
The approach is implemented in the decision analy-sis software Decision Programming Language (DPL9) developed by Syncopation. The utility function is de-termined by equivalent lotteries generated with AS-SESS tool. The user indicates the attributes (deci-sion parameters) of the problem, boundary values, and the tool supports the determination of the multi-attribute utility function. In this problem, the four attributes are the investment level, the machine util-isation rate, the reconfigurability indicator and the maturity indicator. The maturity metric depicts the level or readiness of the proposed technological bricks. Figure 1 depicts the influence diagram built in DPL9. Two scenarios are represented. The squares cor-respond to decision nodes, ovals to chance nodes (events) and squares with rounded edges are value nodes. Arrows between nodes represent influences between them. The model includes two consecutive scenarios. At the beginning of a time period, a de-cision regarding purchasing of new resources is taken by the company. Then, a scenario run is material-ized by the realisation of a market evolution. The same procedure occurs a second time to illustrate the second scenario.
The decision tree of the problem is symmetric. The four decision alternatives are illustrated Figure 2: no investment (no action), add a fixed robot, add a mov-able robot, or add a mobile robot.
A chance node can lead to four possibilities: strong market decrease, low decrease, low increase or strong increase of the demand. In the first scenario, depict-ing a rise of the market demand, the probability of strong decrease is 0 %, the probability of low decrease as well as low increase are 40 %, and the probability to face a strong increase is 20 %. The second scenario simulates a decline of the demand, and is modeled by a 70 % chance of strong market decrease, 30 % chance of low decrease and 0 % of chance of increase (for both low and strong possibilities).
3.3 Results
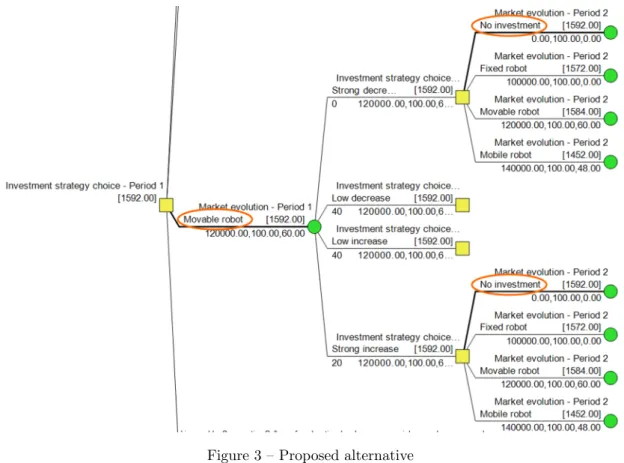
Figure 3 presents an extract of the decision tree af-ter DPL9 simulation. Considering given probability distributions and values for the attributes, the multi-attribute utility function is maximised when a mov-able robot is added to the system in the first time period, and no investments are done in the second period.
Indeed, in the first scenario, the market evolution is uncertain and is likely to increase or decrease. This explains why it is relevant to integrate on the line a resource which can be easily added or removed. In the
MOSIM’20 - November 12-14, 2020 - Agadir - Morocco
Figure 1 – Influence diagram (DPL9)
Figure 2 – Decision node (DPL9)
second period however, a decrease is certain, and it is preferable not to increase unnecessarily the capacity of the system.
In the second scenario, the decision analysis suggests to add fixed resources on the engine assembly line. Indeed, as the demand increase is quite certain, the most reasonable choice is to invest in resources for a long-term high-throughput production.
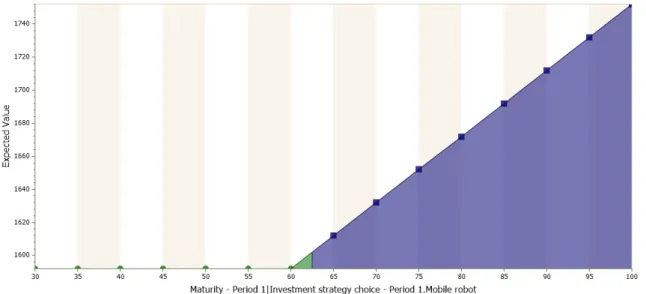
In a second step, a sensitivity analysis is conducted to verify the robustness of the solution regarding input parameters. In this paper, we propose to conduct a sensitivity analysis on the maturity indicator of the mobile robot. For now, the value of this metric is MR = 0.48. The hypothesis we want to verify is if
the increase of MRhas an impact on the final decision
proposed by DPL9. Figure 4 shows the results of the sensitivity analysis. The abscissa corresponds to the value of MRfor the mobile robot, and the ordinate is
the expected value. From this graph, we can read that above a value of 0.6 for the maturity index, there is a policy change in the model, and the solution ”mobile robot” will be preferred.
3.4 Discussion
The contribution of decision analysis for RMS/RAS design concerns decision support in an industrial con-text where companies are divided between the urge to integrate new components to have state-of-the-art production facilities, but are limited by the high price of flexible solutions. We propose an approach to en-able statistically-based objective decision in an uncer-tain environment.
The specificity encountered when designing a recon-figurable system is the inability to predict exactly sales and the need to assess the transformability po-tential of the line. Thus, expected production vol-umes and product mix can be formulated as scenarios defined by probabilities of occurrence. We are able to build a model taking into account the three axes to evaluate a reconfigurable system : costs, performance and reconfigurability.
Influence diagrams and decision tree are efficient tools to represent and communicate on various scenarios. They give a clear overview on relationships between decisions, events and relevant values, and illustrate at one sigh all possible alternatives.
Results obtained in this study are promising and give a new insight in the RMS/RAS design process. By enabling a sensitivity analysis on one of the input cri-teria, such as the maturity of a type of resource, this approach supports the industry to evaluate the right moment when to invest in a new type of resource. This way, the method helps the upgrade of produc-tion facilities regarding Industry 4.0.
Figure 3 – Proposed alternative
4 CONCLUSION
In this paper, we propose the application of decision analysis on the RPSDP. The utility function is built based on the parameters of the RMS/RAS, which are the reconfigurability, the productivity and the invest-ment cost of the system. The attitude towards risk of the decision maker and the relative weights of the attributes are obtained by evaluation of equivalent lotteries. For the studied production scenarios, oc-currence probabilities are defined and validated by experts. Based on this data, and by applying deci-sion analysis on the RPSDP, we obtain a suggestion for the design strategy.
Our methodology provides an evaluation of many pa-rameters of the problem, and aims to erase psycho-logical bias in the design process. Furthermore, the summation of all relevant data and scenarios in a sin-gle decision tree supports communication in decision meetings.
The tool used for decision analysis is currently inde-pendent of other modules of the approach. Further research will focus on the automation of the anal-ysis, by implementing gateways between the recon-figurability indicators calculation module, the DES software, optimisation module, and the risk decision analysis software.
ACKNOWLEDGMENTS
This work took place in the framework of the Open-Lab ”Materials and Processes” combining ENSAM network, GeorgiaTech Lorraine and Groupe PSA. REFERENCES
Andersen, A.-L., ElMaraghy, H., ElMaraghy, W., Brunoe, T. D. and Nielsen, K., 2017. A partic-ipatory systems design methodology for change-able manufacturing systems. International Jour-nal of Production Research 2(3): p. 1-19. Beauville dit Eynaud, A., Klement, N., Roucoules,
L., Gibaru, O. and Durville, L., 2018. UML-based reconfiguration rate analysis of assembly line depending on robot integration. IFAC-PapersOnLine 51-11: p. 1168-1173.
Beauville dit Eynaud, A., Klement, N., Roucoules, L., Gibaru, O. and Durville, L., 2020. Frame-work for the design and evaluation of a reconfig-urable production system based on mobile robot integration. Submitted to the Journal of Manu-facturing Systems. Under Review.
Clemen, R. T. and Reilly, T., 2013. Making Hard Decisions with DecisionTools - 3rd Edition. South-Western, Mason.
Goodwin, P., 2004. Decision trees and influence diagrams. In: Decision Analysis for
Manage-MOSIM’20 - November 12-14, 2020 - Agadir - Morocco
Figure 4 – Result of the sensitivity analysis
ment Judgment - 3rd Edition, Goodwin, P. and Wright, G., p.143–164. Wiley ISBN: 0-470-86108-8
Koren, Y., Heisel, U., Jovane, F., Moriwaki, T., Pritschow, G., Ulsoy, G. and van Brussel, H., 1999. Reconfigurable Manufacturing Systems. Annals of the CIRP 48: p. 527-540.
Lassagne, M., 2000. Applying a Decision-Analysis-Based Method to the Evaluation of Potential Risk Reducing Measures: The Case of a Float-ing Production Storage and OffloadFloat-ing Unit in the Gulf of Mexico. SPE Annual Technical Con-ference and Exhibition.
R¨osi¨o, C., Aslam, T., Srikanth, K. B. and Shetty, S., 2019. Towards an assessment criterion of recon-figurable manufacturing systems within the au-tomotive industry. IFAC-PapersOnLine 28: p. 76-82.
Tchoffa, D., Duta, L. and El Mhamedi, A., 2012. Decision analysis in management of industrial incidents. IFAC Proceedings Volumes 45(6): p. 23-25.
Tversky, A. and Kahneman, D., 1974. Judgement under uncertainty: heuristics and biases. In: Wendt D., Vlek C. (eds) Utility, Probability, and Human Decision Making. Theory and Decision Library 11: p. 141-162. Springer, Dordrecht Wang, G. X., Huang, S. H., Yan, Y. and Du, J. J.,
2017. Reconfiguration schemes evaluation based on preference ranking of key characteristics of reconfigurable manufacturing systems. Interna-tional Journal of Advanced Manufacturing Tech-nologies 89: p. 2231-2249.