3D Stochastic Modelling of Insulin Sensitivity in STAR: Virtual trials analysis
Vincent Uyttendaele*, **, Jennifer L. Knopp**, Geoffrey M. Shaw***, Thomas Desaive*,and J. Geoffrey Chase**.
* GIGA – In silico Medicine, University of Liège, Belgium
(email: [email protected], [email protected]) **Department of Mechanical Engineering, University of Canterbury, Christchurch, New Zealand
*** Department of Intensive Care, Christchurch Hospital, New Zealand
Abstract: Glycaemic control has shown beneficial outcomes for critically ill patients, but has been proven hard to achieve safely, increasing risk of hypoglycaemia. Patient metabolic variability is one of the main factor influencing glycaemic control safety and efficacy. STAR is a model-based glycaemic controller using a unique patient-specific risk-based dosing approach. STAR uses a 2D stochastic model, built from population data using kernel density methods, to determine potential forward future evolution in patient-specific insulin sensitivity (SIn+1), based on its current value (SIn).
This study uses virtual trial to compare the current 2D stochastic model used in STAR, with a new 3D stochastic model. The new 3D model also uses prior insulin sensitivity value (SIn-1) to determine
distribution of likely future SIn+1. A total of 587 virtual patient glycaemic control episodes longer than 24
hours from three different studies are used here. Safety (% blood glucose (BG) measurements < 4.0 and < 2.2 mmol/L), performance (% time in the target 4.4-8.0 mmol/L band), insulin administration and nutrition delivery (% goal feed) are compared.
Results show similar performance (90% BG in 4.4-8.0 mmol/L), and similar safety, with slightly higher % BG < 4.0 mmol/L (0.9 vs. 1.4%) and % BG < 2.2 mmol/L (0.02 vs. 0.03%) for the 3D model, was achieved for similar workload. The slightly lower median BG level (6.3 vs. 6.0 mmol/L) for the 3D stochastic model is explained by the higher median insulin rate administered (2.5 vs. 3.0 U/hr). More importantly, simulation results showed higher nutrition delivery using the 3D stochastic model (92 vs. 99 % goal feed).
The new 3D stochastic model achieved similar safety and performance than the 2D stochastic model in these virtual simulations, while increasing the total calorific intake. This higher nutritional intake is potentially associated with improved outcome in intensive care units. The 3D stochastic model thus better characterises patient-specific metabolic variability, allowing more optimal insulin and nutritional dosing. Therefore, a pilot clinical trial using the new 3D stochastic model could be realised to assess and compared clinical outcomes using the new stochastic model.
Keywords: Glycaemic control, Hyperglycaemia, Insulin, Clinical trial, Virtual Trial, Stochastic Modelling
1. INTRODUCTION
Hyperglycaemia, hypoglycaemia and highly variable blood glucose (BG) concentrations are associated with higher mortality, morbidity and length of stay in intensive care units (ICU) (Bagshaw et al., 2009; Capes et al., 2000; Egi et al., 2006; Egi et al., 2010; Krinsley, 2008). Hyperglycaemia is a common complication for critically ill patients, suggesting glycaemic control (GC) to lower BG levels (McCowen et al., 2001). GC using insulin therapy has shown positive outcomes, but has been proven difficult to achieve safely and effectively, significantly increasing risk of hypoglycaemia (Brunkhorst et
al., 2008; Chase et al., 2010a; Finfer et al., 2009; Finfer et al.,
2012; Krinsley, 2004, 2005; Preiser et al., 2009; Reed et al., 2007; Van den Berghe et al., 2001; Van den Berghe et al., 2003).
Safe and effective GC is required for all patient, and is a function of protocol design, not patient metabolic state (Uyttendaele et al., 2017). Patients metabolic variability is one of the most important factors making GC hard to achieve safely. Fixed table-based GC protocols thus often fail to provide safe control, completely lacking patient variability. Model-based GC protocols are thus used to assess intra- and inter- patient variability and offer patient-specific insulin therapy, directly managing risk (Chase et al., 2011).
STAR is a model-based GC framework, which has shown promising results across different ICU settings (Evans et al., 2012; Fisk et al., 2012; Stewart et al., 2016). STAR uses a unique patient-specific risk-based approach to titrate insulin and nutrition safely. Patient-specific insulin sensitivity (SI) is calculated using a clinically validated physiological model (Lin et al., 2011), and distribution of likely future SI variability is determined using a stochastic model (Lin et al., 2008). This
distribution of likely future SI allows to calculate potential future BG outcomes for a given intervention. STAR thus determines which intervention best overlaps a clinically chosen BG target band.
Virtual trials (Chase et al., 2010b), using virtual patients, are used in this study to assess the impact of a new 3D stochastic model implemented in STAR. Such trials allow safety and performance assessment of GC outcomes for protocols tested on virtual cohorts, prior to clinical implementation. The 2D stochastic model uses current identified patient-specific SI value to compute distribution of likely future SI changes. Compared to its predecessor, the new 3D stochastic model is constructed using both previous and current SI values to forecast future SI variability. It thus uses the prior variability in SI to enhance prediction. BG outcomes are compared with the 2D stochastic model, to determine whether this new 3D model significantly improves safety and performance of STAR, by better characterizing inter-patient variability.
2. METHODS
2.1 STAR protocol and model-based insulin sensitivity
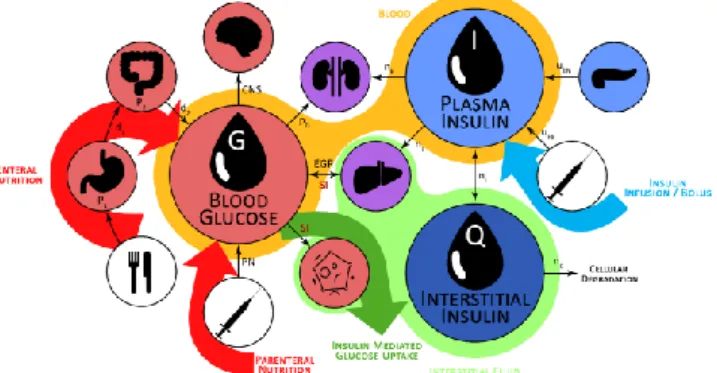
The physiological model describing the glucose-insulin pharmacokinetics is schematically represented in Figure 1, and is defined (Lin, et al., 2011):
𝐺̇ = −𝑝𝐺. 𝐺(𝑡) − 𝑆𝐼. 𝐺(𝑡) 𝑄(𝑡) 1 + 𝛼𝐺. 𝑄(𝑡) +𝑃(𝑡) + 𝐸𝐺𝑃 − 𝐶𝑁𝑆 𝑉𝐺 (1) 𝐼̇ = −𝑛𝐾. 𝐼(𝑡) − 𝑛𝐿 𝐼(𝑡) 1 + 𝛼𝐼. 𝐼(𝑡)− 𝑛𝐼(𝐼(𝑡) − 𝑄(𝑡)) + 𝑢𝑒𝑥(𝑡) 𝑉𝐼 + (1 − 𝑥𝐿) 𝑢𝑒𝑛(𝐺) 𝑉𝐼 (2) 𝑄̇ = 𝑛𝐼(𝐼(𝑡) − 𝑄(𝑡)) − 𝑛𝐶 𝑄(𝑡) 1 + 𝛼𝐺𝑄(𝑡) (3)
Where G(t) is blood glucose (mmol/L), I(t) is plasma insulin (mU/L), Q(t) is interstitial insulin (mU/L), P(t) is glucose from dextrose intake (mmol/min), and SI is insulin sensitivity (L/mU/min). Main clearance rates and parameters are defined in (Lin, et al., 2011; Pretty et al., 2014).
The time-varying SI parameter describes the patient-specific metabolic response to insulin. SI is determined hourly from clinical data using integral-based fitting methods (Docherty et
al., 2012; Hann et al., 2005), accounting for intra-patient
variability.
Figure 1 – Schematic representation of the glucose-insulin physiological model defined in Equations (1) – (3).
2.2 2D vs. 3D stochastic model
STAR uses a stochastic model, built on population data using kernel density estimations, to predict likely 1-3 hourly future changes in SI (Lin, et al., 2008). Based on the predicted distribution of future SI, the distribution of likely corresponding predicted future BG concentrations can be determined for a given intervention (Figure 2). STAR seeks the best intervention ensuring the 5th percentile of predicted
BG ≥ 4.4 mmol/L, while maximizing the overlapping with the clinically specified target band (4.4-8.0 mmol/L). This unique risk-based dosing approach, significantly decreases risk of hypoglycaemia, while improving GC performance. STAR is the standard of care of two different ICUs, in Christchurch Hospital, New Zealand, and Gyula, Hungary.
Figure 2 – STAR uses stochastic models to forecast change in SI based on current SI value, and determines BG outcomes for given insulin and nutrition intervention.
One important feature of STAR is its ability to modulates both insulin and nutrition inputs. Enteral nutrition can be lowered if insulin only intervention is not sufficient decrease BG levels, but STAR will always try to reach back 100% goal feed (GF) to maximise carbohydrates intake. Insulin is administered as intravenous boluses, with an equivalent maximum of 6U/hr, and authorizing up to 3U/hr in continuous infusion for consistent resistant patients. Enteral nutrition administration can be modulated between 30-100% of the total calorific GF if needed. As patient weight is not always known, 100% GF is estimated based on body frame size, age, and sex of the patient. More details can be found elsewhere (Stewart et al., 2018). The 2D stochastic model uses only current SI (SIn) as input to
determine the distribution of likely future SI (SIn+1). The new
3D stochastic model uses both previous (SIn-1) and current SIn
values to determine the distribution of future SIn+1
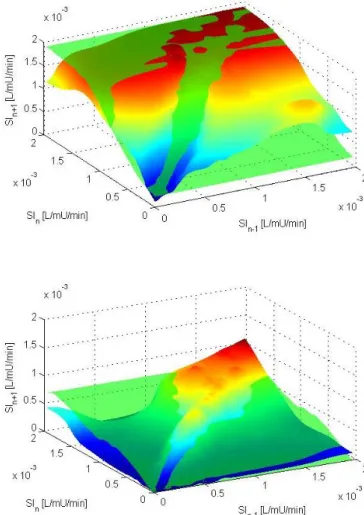
(Uyttendaele et al., 2018a). These stochastic models are made using local data density weighted Gaussian kernel estimation (Lin, et al., 2008). The resulting 5th-95th percentile prediction
ranges are shown in Figure 3, where the 2D stochastic model is constant across all SIn-1, while the 3D model is variable
across both SIn and SIn-1, yielding narrower and wider
prediction ranges.
Figure 3 – Comparison between 2D (green) and 3D (colour) stochastic model surfaces of the 5th (bottom) and 95th (top)
percentile predictions of future SIn+1. The 2D model is constant
across SIn-1, where the 3D model is different for every (SIn-1,
SIn) pair, both narrower and wider across the range.
Previous studies have shown the 3D model better captures SI variability, with tighter prediction bands for over 70% of the time, and showed stable patients tend to remain stable where variable patients are more likely to remain variable and are more variable than the 2D model represents (Uyttendaele, et
al., 2018a; Uyttendaele et al., 2018b). This outcome suggests
more aggressive dosing can be used for these more stable time periods, improving BG outcomes without compromising safety.
2.3 Virtual trials and virtual patients
Virtual trials are used to simulate GC protocols on virtual cohort, allowing to assess and compare BG outcomes for these protocols (Chase et al., 2018; Chase, et al., 2010b). Virtual patients are created from real patient clinical data, and are characterised by their SI profile over time. SI is considered treatment independent and hourly constant. Two different protocols can thus be simulated on a same virtual patient, resulting in different BG outcomes. Virtual trial simulations are a powerful tool allowing to avoid any undesired behaviour prior to clinical implementation. Virtual trials have been previously validated and shown generalisable across different ICUs practices (Dickson et al., 2017).
A total of 587 virtual patient episodes longer than 24 hours are used in this study, totalling 65260 hours of GC. These virtual patient episodes were created using clinical data from 3 different studies in 2 different countries (STAR protocol, Christchurch, New Zealand (Evans, et al., 2012); SPRINT protocol, Christchurch, New Zealand (Chase et al., 2008); STAR protocol, Gyula, Hungary (Benyo et al., 2012)). Patient demographic details are in (Stewart, et al., 2016).
2.4 Analyses
New 2D and 3D stochastic models are created using SI from 411 (70%) random patient episodes out of the total 587. Virtual trial of STAR using the 2D and 3D stochastic models are simulated on the other 176 (30%) patient episodes, allowing fair GC outcome comparison. This overall process is realised three times, where patient episodes are each time randomly chosen for the training (70%) and testing (30%) sets, resulting thus in 528 simulated GC episodes. Thus, one virtual patient episode is possibly simulated three times if not used to build the stochastic models, but results will be different time to time according to the specific 2D and 3D stochastic models built. Safety and performance from GC simulation results are thus compared between both stochastic models. In this analysis, BG data is resampled hourly to allow fair comparison across different measurement intervals. Safety is evaluated by the %BG ≤ 4.4 mmol/L, %BG ≤ 4.0 mmol/L (mild hypoglycaemia) and %BG ≤ 2.2 mmol/L (severe hypoglycaemia). Performance is assessed by the percentage time in band (%BG with 4.4-8.0 mmol/L), and the median [IQR] per-patient BG. Insulin and nutrition %GF rates are also compared. Finally, workload is assessed by numbers of BG measurements per day, where a higher value would indicate more work for the change in stochastic models.
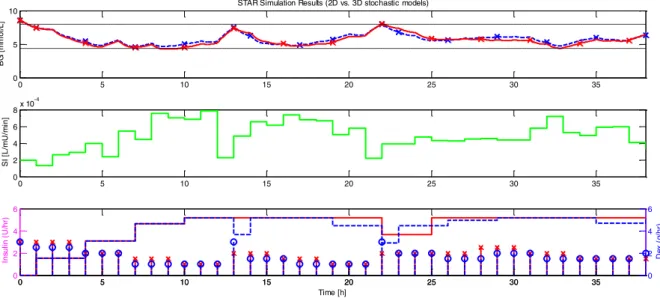
Figure 4 – Simulation results comparison using the 2D (blue) and 3D (red) stochastic models for the same patient. Top panel shows the evolution of simulated BG, crosses represent BG measurements. Middle panel show this patient-specific SI profile. Bottom panel shows insulin boluses and nutrition rates over time.
3. RESULTS
Clinical and simulation results are summarised in Table 1 for each protocol. An example of the GC outcome results for each protocol is shown for one patient in Figure 4. Resampled BG, insulin rate, and percentage goal feed rate cumulative distribution functions (CDFs) are shown in Figure 5.
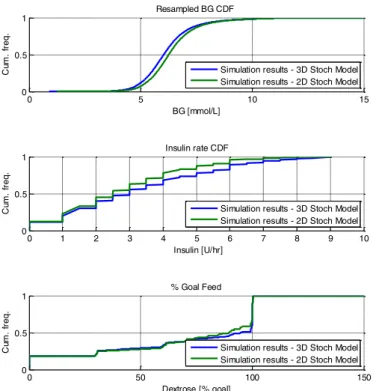
Regarding performances, simulations results in Table 1 show both models achieved similar 90% time in the 4.4-8.0 mmol/L band for similar workload (11.6 vs. 11.7 measurements per day). The median [IQR] BG level achieved is slightly lower for the 3D stochastic model (6.3 [5.7, 6.9] vs. 6.0 [5.5, 6.7] mmol/L), reflected in Figure 5 (top). Additionally, both median [IQR] insulin and nutrition rates are higher for the 3D stochastic model (3.0 [1.5, 5.0] vs. 2.5 [1.5, 4.0] U/hr, and 92 [70, 100] vs. 99 [66 100] %), also reflected in Figure 5 (middle and bottom).
Concerning safety, the 3D stochastic model achieved lower % BG > 8.0 mmol/L (8 vs 7%), but higher % BG < 4.4 mmol/L (2 vs. 3%). More specifically, 0.5% higher BG < 4.0 mmol/L (mild hypoglycaemia) is observed for the 3D stochastic model, while very low % BG < 2.2 mmol/L (severe hypoglycaemia) for both models (0.02 vs. 0.03%) occurred. However, 12 patients experienced severe hypoglycaemia with the 3D stochastic model, compared to 9 patients with the 2D stochastic model.
These overall result trends can be seen in Figure 4, showing simulation results for one patient. BG (top) is similar, but slightly lower for the 3D stochastic model simulation (red). Insulin bolus sizes are often ~0.5 U/hr higher (bottom), as well as nutrition rates for the 3D stochastic model. The protocol simulations are based on identical SI profiles (middle), characterising this patient-specific metabolic evolution over time, thus really reflecting GC outcomes behaviour difference of these two protocols on the same underlying patient.
Table 1 – Simulation results summary for safety and performance comparison. BG stats are calculated from hourly resampled BG as measurement intervals can differ treatment to treatment. Data is presented as median [IQR] where appropriate.
4. DISCUSSION
Overall, these simulations show both protocols using the 2D or 3D stochastic model achieved safe and effective GC, with very low % BG < 4.4 mmol/L and high 90% time in the 4.4-8.0 mmol/L target band. The main difference between the two approach remains in the insulin and nutrition rates administered. As expected, the higher insulin rate administered allowed higher per-patient median nutritional deliver rates as a function of goal feed rate, improving a delivery rate that is near the best in the world (Stewart, et al., 2018). Therefore, the similar safety and performance, achieved with similar workload, were realised with overall greater carbohydrates delivery.
0 5 10 15 20 25 30 35
0 5
10 STAR Simulation Results (2D vs. 3D stochastic models)
B G [ m m o l/L ] 0 5 10 15 20 25 30 35 0 2 4 6 8x 10 -4 S I [L /m U /m in ] 0 5 10 15 20 25 30 35 0 2 4 6 Time [h] In su lin ( U /h r) 0 5 10 15 20 25 30 35 0 2 4 6 D ex (g /h r) 2D model 3D model # Patients 528 528 Total hours 60246 60267
Mean measurements per day 11.6 11.7 BG level (mmol/L) 6.3 [5.7, 6.9] 6.0 [5.5, 6.7] Insulin rate (U/hr) 2.5 [1.5, 4.0] 3.0 [1.5, 5.0] Nutrition rate (%GF) 92 [70 100] 99 [66 100] % BG in 4.4-8.0 mmol/L 90 90 % BG in 8.0-10.0 mmol/L 6 5 % BG > 10.0 mmol/L 2 2 % BG < 4.4 mmol/L 2 3 % BG < 4.0 mmol/L 0.9 1.4 % BG < 2.2 mmol/L 0.02 0.03 # patients (%) < 2.2 mmol/L 9 (1.7) 12 (2.3)
Figure 5 – Cohort resampled BG, insulin rate, and %GF CDFs comparison between simulations.
A recent study showed STAR capacity to deliver nutrition rates better than 158 ICUs in 20 different countries (Stewart,
et al., 2018), which may be associated with improved clinical
outcomes in ICU (Heyland et al., 2011). In this study, the new 3D stochastic model provided even better carbohydrate delivery compared to the previous 2D stochastic model. As explained, previous analysis on the new 3D stochastic model has shown the 3D stochastic model has consistently tighter prediction bands more than 70% of the time, particularly when SI is stable. These virtual trials confirm the accuracy on the forward prediction of SI variability of the new 3D stochastic model, allowing more aggressive dosing, while increasing calories intake and ensuring both safety and performance. The 3D stochastic model thus improves the patient-specific GC approach in STAR.
Based on these results, a pilot clinical trial can be realised to assess and compare safety, performance, nutrition delivery and workload of STAR using this new 3D stochastic model.
5. CONCLUSIONS
This study compared virtual trial results of STAR GC protocol using a 2D stochastic model, using only current SI to predict future SI, and a new 3D stochastic model using both current and previous SI to predict future SI changes. Simulations results showed similar safety and performance, while the 3D stochastic model version uses more aggressive insulin dosing. The main difference relies in the greater delivered % GF calorific content, for similar clinical workload.
The 3D stochastic model implementation within the STAR framework can thus potentially lead to beneficial outcome in critically ill patients, as increased nutrition rate delivery is
associated with improved clinical outcomes. A pilot clinical trial could thus assess and confirm these results.
ACKNOWLEDGEMENTS
The authors acknowledge the support of the EUFP7 and RSNZ Marie Curie IRSES program, the Health Research Council (HRC) of New Zealand, the MedTech CoRE and TEC, NZ National Science Challenge 7, Science for Technology and Innovation, the European Erasmus + Student Mobility program, and the FRIA – Fund for Research Training in Industry and Agriculture.
REFERENCES
Bagshaw, S. M., Bellomo, R., Jacka, M. J., Egi, M., Hart, G. K., and George, C. (2009). The impact of early hypoglycemia and blood glucose variability on outcome in critical illness. Crit Care, 13.
Benyo, B., Illyes, A., Nemedi, N. S., Le Compte, A. J., Havas, A., Kovacs, L., Fisk, L., Shaw, G. M., and Chase, J. G. (2012). Pilot study of the SPRINT glycemic control protocol in a Hungarian medical intensive care unit. J
Diabetes Sci Technol, 6, 1464-1477.
Brunkhorst, F. M., Engel, C., Bloos, F., Meier-Hellmann, A., Ragaller, M., and Weiler, N. (2008). Intensive insulin therapy and pentastarch resuscitation in severe sepsis. N
Engl J Med, 358.
Capes, S. E., Hunt, D., Malmberg, K., and Gerstein, H. C. (2000). Stress hyperglycaemia and increased risk of death after myocardial infarction in patients with and without diabetes: a systematic overview. Lancet, 355, 773-778.
Chase, J. G., Compte, A. J., Suhaimi, F., Shaw, G. M., Lynn, A., and Lin, J. (2011). Tight glycemic control in critical care – the leading role of insulin sensitivity and patient variability: a review and model-based analysis. Comput
Methods Programs Biomed, 102.
Chase, J. G., Preiser, J. C., Dickson, J. L., Pironet, A., Chiew, Y. S., Pretty, C. G., Shaw, G. M., Benyo, B., Moeller, K., Safaei, S., Tawhai, M., Hunter, P., and Desaive, T. (2018). Next-generation, personalised, model-based critical care medicine: a state-of-the art review of in silico virtual patient models, methods, and cohorts, and how to validation them. Biomed Eng Online, 17, 24.
Chase, J. G., Pretty, C. G., Pfeifer, L., Shaw, G. M., Preiser, J. C., and Compte, A. J. (2010a). Organ failure and tight glycemic control in the SPRINT study. Crit Care, 14. Chase, J. G., Shaw, G., Compte, A., Lonergan, T., Willacy, M.,
and Wong, X. W. (2008). Implementation and evaluation of the SPRINT protocol for tight glycaemic control in critically ill patients: a clinical practice change. Crit
Care, 12.
Chase, J. G., Suhaimi, F., Penning, S., Preiser, J. C., Compte, A. J., and Lin, J. (2010b). Validation of a model-based virtual trials method for tight glycemic control in intensive care. Biomed Eng Online, 9.
Dickson, J. L., Stewart, K. W., Pretty, C. G., Flechet, M., Desaive, T., Penning, S., Lambermont, B. C., Benyo, B., Shaw, G. M., and Chase, G. (2017). Generalisability of a
0 5 10 15 0 0.5 1 BG [mmol/L] C um . fr e q . Resampled BG CDF 0 1 2 3 4 5 6 7 8 9 10 0 0.5 1 Insulin [U/hr] C um . fr e q . Insulin rate CDF 0 50 100 150 0 0.5 1 Dextrose [% goal] C um . fr e q . % Goal Feed
Simulation results - 3D Stoch Model Simulation results - 2D Stoch Model
Simulation results - 3D Stoch Model Simulation results - 2D Stoch Model
Simulation results - 3D Stoch Model Simulation results - 2D Stoch Model
Virtual Trials Method for Glycaemic Control in Intensive Care. IEEE Transactions on Biomedical Engineering,
PP, 1-1.
Docherty, P. D., Chase, J. G., and David, T. (2012). Characterisation of the iterative integral parameter identification method. Med Biol Eng Comput, 50, 127-134.
Egi, M., Bellomo, R., Stachowski, E., French, C. J., and Hart, G. (2006). Variability of blood glucose concentration and short-term mortality in critically ill patients.
Anesthesiology, 105, 244-252.
Egi, M., Bellomo, R., Stachowski, E., French, C. J., Hart, G. K., and Taori, G. (2010). Hypoglycemia and outcome in critically ill patients. Mayo Clin Proc, 85.
Evans, A., Le Compte, A., Tan, C. S., Ward, L., Steel, J., Pretty, C. G., Penning, S., Suhaimi, F., Shaw, G. M., Desaive, T., and Chase, J. G. (2012). Stochastic targeted (STAR) glycemic control: design, safety, and performance. J Diabetes Sci Technol, 6, 102-115. Finfer, S., Chittock, D. R., Su, S. Y., Blair, D., Foster, D., and
Dhingra, V. (2009). Intensive versus conventional glucose control in critically ill patients. N Engl J Med,
360.
Finfer, S., Liu, B., Chittock, D. R., Norton, R., Myburgh, J. A., McArthur, C., Mitchell, I., Foster, D., Dhingra, V., Henderson, W. R., Ronco, J. J., Bellomo, R., Cook, D., McDonald, E., Dodek, P., Hebert, P. C., Heyland, D. K., and Robinson, B. G. (2012). Hypoglycemia and risk of death in critically ill patients. N Engl J Med, 367, 1108-1118.
Fisk, L. M., Le Compte, A. J., Shaw, G. M., Penning, S., Desaive, T., and Chase, J. G. (2012). STAR development and protocol comparison. IEEE Trans Biomed Eng, 59, 3357-3364.
Hann, C. E., Chase, J. G., Lin, J., Lotz, T., Doran, C. V., and Shaw, G. M. (2005). Integral-based parameter identification for long-term dynamic verification of a glucose-insulin system model. Comput Methods
Programs Biomed, 77, 259-270.
Heyland, D. K., Cahill, N., and Day, A. G. (2011). Optimal amount of calories for critically ill patients: depends on how you slice the cake! Crit Care Med, 39, 2619-2626. Krinsley, J. S. (2004). Effect of an intensive glucose
management protocol on the mortality of critically ill adult patients. Mayo Clin Proc, 79.
Krinsley, J. S. (2005). Glucose control reduces ICU stay and mortality. Perform Improv Advis, 9, 4-6, 1.
Krinsley, J. S. (2008). Glycemic variability: a strong independent predictor of mortality in critically ill patients. Crit Care Med, 36.
Lin, J., Lee, D., Chase, J. G., Shaw, G. M., Le Compte, A., Lotz, T., Wong, J., Lonergan, T., and Hann, C. E. (2008). Stochastic modelling of insulin sensitivity and adaptive glycemic control for critical care. Comput Methods
Programs Biomed, 89, 141-152.
Lin, J., Razak, N. N., Pretty, C. G., Compte, A., Docherty, P., and Parente, J. D. (2011). A physiological Intensive Control Insulin-Nutrition-Glucose (ICING) model validated in critically ill patients. Comput Methods
Programs Biomed, 102.
McCowen, K. C., Malhotra, A., and Bistrian, B. R. (2001). Stress-induced hyperglycemia. Crit Care Clin, 17, 107-124.
Preiser, J. C., Devos, P., Ruiz-Santana, S., Melot, C., Annane, D., and Groeneveld, J. (2009). A prospective randomised multi-centre controlled trial on tight glucose control by intensive insulin therapy in adult intensive care units: the Glucontrol study. Intensive Care Med, 35.
Pretty, C. G., Signal, M., Fisk, L., Penning, S., Compte, A., and Shaw, G. M. (2014). Impact of sensor and measurement timing errors on model-based insulin sensitivity. Comput Methods Programs Biomed, 114. Reed, C. C., Stewart, R. M., Sherman, M., Myers, J. G.,
Corneille, M. G., and Larson, N. (2007). Intensive insulin protocol improves glucose control and is associated with a reduction in intensive care unit mortality. J Am Coll
Surg, 204.
Stewart, K. W., Chase, J. G., Pretty, C. G., and Shaw, G. M. (2018). Nutrition delivery of a model-based ICU glycaemic control system. Ann Intensive Care, 8, 4. Stewart, K. W., Pretty, C. G., Tomlinson, H., Thomas, F. L.,
Homlok, J., and Noemi, S. N. (2016). Safety, efficacy and clinical generalization of the STAR protocol: a retrospective analysis. Ann Intensive Care, 6.
Uyttendaele, V., Dickson, J., Shaw, G., Desaive, T., and Chase, G. (2018a). Improved 3D Stochastic Modelling of Insulin Sensitivity Variability for Improved Glycaemic Control. IFAC-PapersOnLine. [In press]
Uyttendaele, V., Dickson, J., Stewart, K., Desaive, T., Benyo, B., Szabo-Nemedi, N., Illyes, A., Shaw, G., and Chase, G. (2018b). A 3D insulin sensitivity prediction model enables more patient-specific prediction and model-based glycaemic control. Biomed Signal Process
Control. [In press]
Uyttendaele, V., Dickson, J. L., Shaw, G. M., Desaive, T., and Chase, J. G. (2017). Untangling glycaemia and mortality in critical care. Crit Care, 21, 152.
Van den Berghe, G., Wouters, P., Weekers, F., Verwaest, C., Bruyninckx, F., Schetz, M., Vlasselaers, D., Ferdinande, P., Lauwers, P., and Bouillon, R. (2001). Intensive insulin therapy in critically ill patients. N Engl J Med,
345, 1359-1367.
Van den Berghe, G., Wouters, P. J., Bouillon, R., Weekers, F., Verwaest, C., Schetz, M., Vlasselaers, D., Ferdinande, P., and Lauwers, P. (2003). Outcome benefit of intensive insulin therapy in the critically ill: Insulin dose versus glycemic control. Crit Care Med, 31, 359-366.