Analysis of a Voltage Instability Incident
in
the Greek Power System
C.
D.
Vournas G. A. ManosJ.
KabourisT. Van Cutsem
National 'Technical University .ithens 104 43. Greece
Public Power Corporation
P O.Box 26137 Dyrrachioy L Kitissoy St. Sart-Tilman B28. Athens 104 43. Greece
c-mail: I oumasc~power.ece.ntua.gr e-mail: kabourisf~m~l.dei.gr e-mail: [email protected] University of Liege. Institut Montetiore
B-4000, Litge, Belgium
.Abstract: The paper reports on 3 1996 incident in the Greek power system that had all the characteristics of voltage instability and the subsequent analyses and countermeasures. Voltage stability analysis IS performed by both NTUA and ULg software tools that give identical simulation results. AAer the upgrades performed by PPC a considerable increase in the maximum power that can be fed to the Athens area is achieved. Finally, secure operation limits of the upgraded system are calculated.
Keywords ?'oltage stability. long-term simulation, quasi-steady- state approiimation. secure operation limits. maximum power transfer.
I. INTRODUCTION
Voltage stability is a growing concem for many power systems around the globe. Following this general trend. during the summer of 1996 the Interconnected Greek Power System owned and operated by the Public Power Corporation (PPC) experienced a low-voltage incident that highlighted the need for detailed voltage stability studies. A first study of the incident was conducted at the National Technical University of Athens (NTUA) [I] and it demonstrated that the load demand had exceeded the maximum power that could be transferred to Athens and the southern part of the system. The simulation results were validated using tools developed at the University of Liege (ULg) [2].
As a result of this and other similar studies conducted by PPC several measures were taken to increase the maximum power transfer to the Athens region. Also, a second project was launched 231 as
a
result of which PPC obtained a voltage stability analysis program developed by NTUA [4].In the following section we give a short description of the Greek power system and the 1996 incident. In Section 111 we present the voltage stability tools developed at NTUA and ULg, which were applied for the analysis of the Greek system. Section 1V gives an analysis of the 1996 incident and Section V the countermeasures taken by PPC to reinforce the system. Finally, in Section VI voltage security analysis of the upgraded system is performed using the concept of secure operation limits [5].
1I.DESCRIPTION OF THE EVENT A. The Greek Power System
Public Power Corporation (PPC) is a national vertically !!itegrated electric utility serving the generation, transmission 2nd distribution needs of
Greece.
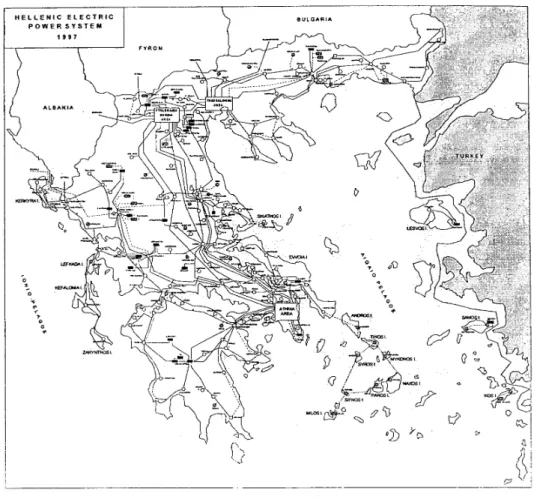
The interconnected grid of PPC covers the Greek mainland arid the electrically connected main islands of the Ionian Sea as well as few adjacent islands in the Aegean Sea; autonomous power grids cover the electric needs of the other islands. Fig. I illustrates a single line diagram of the Greek power system. "lie
main
production center of PPC is in the north of Greece in the vicinity of the lignite rich area of Ptolemaida. Thermal power plants in this area generate about 70% of the total electricity in the Greek mainland. Significant hydro production exists in the north and the northwest of the country. There is also important lignite production in the scluthem peninsula of Peloponnese; natural gas and oil-fired gtaeration exist also near Athens. Due to the natural geography, all international interconnections, with the neighboring systems of Albania (with 150 kV and 400 kV hies), Bulgaria (one 400 kV line) and former Yugoslavia (1 50k'J and 400
kV
lines), are also in the North.The salient feature of the Greek power system is that the main production center
is
located at the northwest of the country while themain
consumption is in the metropolitan area of Athens. The above system characteristics lead to significant electric power transmission in the north-south direction, fiom the main generation center to the major Ioad sink. Several critical operating conditions are associated with this geographical unbalance of generation and load.Transmission needs are served by 400 kV and 150 kV transmission lines. The 400 kV transmission network plays the primary role in the energy transport to Athens. There is no 400
kV
transmission south of Athens. The 150kV
network covers the secondary transmission needs as well as radial distribution needs in the Athens area. The distribution system of PPC is operating radially at 22 kV, 15 kV and very limited 6.6 kV voltage levels.The load of the system peaks during the summer when severe voltage stability problems may occur in case of reduced generation availability in the Southem part of the system. During this period, the loads are strongly inductive due to the big percentage of motors (air-conditioning in residential loads and irrigation needs in the central part of the country).
B. The July 1996 event
On the 8' of July, 1996 four generating units feeding the 150 kV network in the southern part of the system with a total capacity of 580 MW were out of operation.
The problem started at 09:45 and lasted until 13:OO. During this period the voltages of the 150 kV network in the Athens region fell to approximately 120 kV (0.8 pu), while the voltages of thG 400 k Y network wtrt ntar 0.83 pu; the voltage
Itwels at the Northem part of the system remained at normal levels throughout.
The voltage drop rates observed during the incident were 0.75 kVI5 min from 9:OO to 9:45 and then increased to 1.8 kVI5min from 9:45 to 10:30. The voltage drop was quite large for relatively small load increase: for 20 MW load increase the voltage drop was 2% (3 kV in the 150 kV system). This
observation was an indication of voltage instability.
I I
I
2000 40W 6000 8000 10000 12ooo
0.8 1
t (I)
I : WPSTAB, 2: ASTRE, 3: measurement Fig. 2.Voltage o r a 1SOkV bus i n the Athens region
0-7803-5935-6/00/$10.00 ( c ) 2000 IEEE
Fig 2 presents the voltage profile at a 150 kV substation in the Athens region. Line 3 shows the nieasured voltages during the incident as retrieved from the EMS files. Lines 1 and 2 in the same figure are the simulation results described in the next section.
The voltage drop stopped at 12:30 when load of about 100
MW was disconnected (in Athens and Thessaloniki areas) due to the triggering of an overload protection scheme of the interconnection line with former Yugoslavia. Even after the load shedding the voltages remained at low levels until the peak hour passed.
The phenomenon described abovs did not lead to total or partial blackout, but considerable concern was raised as to the possible consequences of other similar events.
111. COMPUTATIONAL TOOLS A . QSS siniulation
1484
Two computer programs have been used to study the 1996 incident and assess the voltage security of the upgraded system. They both rely upon the Quasi Steady State (QSS) approach [6,7] based on the time-scale decomposition of
power system dynamics and a simplified representation of the short-term dynamics, when focusing on long-term phenomena. Thus, during long-term simulation:
The differential equations, describing the dynamic behavior of a power system (e.g. generators. induction motors, AVRs etc.) in the short-term time scale are substituted by their equilibrium equations.
The dynamic phenomena in the long-term time scale ( LTCs, overexcitation limiters, thermostatic loads, etc.) are represented by differential, or difference equations. The nehvork is represented by algebraic equations. The OSS simulation consists of successive solution of the equilibrium equations of short-term dynamics together with the network constraints. Power system devices and components contributing to voltage instability problems are modeled in detail, In particular, magnetic saturation of synchronous generators is represented, as well as governor action. generation excitation limits. AVR droop of proportional controllers. AGC, etc.
The QSS technique offers a good compromise between the advantages of time-simulation and the efficiency of static methods, needed to analyze a large number of contingencies.
B VPSTAB description
WPSTAB is a power system long-term simulation package that has been developed at NTUA [2]. An Equilibrium Point Computation Program (EPCP) is implemented in each time step to solve the set of short-term equiIibrium and network equations. This program is a generalization of a conventional power flow program and makes full use of the sparsity formulation of the latter.
WPSTAB uses detailed induction motor equilibrium conditions. Moreover it has the ability to analyze a short-term instability and switch to an approximate simulation of induction motors during stalling. It can also use reduced-order models of generators to approximate the system behavior even after the loss of short-term equilibrium, where the QSS approximation breaks down.
This program has been proven reliable for application in
bulk power system studies. Its results compared very favorably with those of a full simulation program (ETMSP)
[ 9 ] . WPSTAB is presently used by PPC for contingency evaluation and the classification of countermeasures against voltage instability and collapse.
C. ASTRE description
The ASTRE package developed at ULg covers several aspects of voltage stability and security analysis. As already mentioned. its heart is a fast time domain simulation based on the QSS method. This simulation is complemented by sensitivity and eigenvector analyses, which provide information on the instability mode and the best remedial actions [2,7]. This diagnosis capability can be used in both preventive mode (e.g. for generation rescheduling) and curative mode (e.g. for optimal load shedding).
Voltage security analysis is implemented through three modules. The first one is the QSS simulation engine, used for contingency evaluation and instability diagnosis. The second one is a load flow program aimed at stressing the system in its
p-e-contingency situation (taking into account secondary vdtage control. if any). These two modules are called by a third one, in charge. of the security limit search (including contingency filtering). This limit search is further described in Section VI. where it is applied to the upgraded Greek system.
ASTRE has been used for some time by Electricite de France, Hydro-Quebec (Canada) and Electrabel (Belgium). The QSS method was carefully validated against full time domain simulation by the former two companies (e.g. [7,8]). It is used in various contexts:
planning studies, where a large number of long-term stability scenarios have to be considered, and for the design of load shedding schemes
operational planning studies. for the determination of security limits [5,7]
efforts are also devoted to bringing it in the real-time environment.
Extensions to short-term voltage stability analysis are also
0
under investigation.
IV. VOLTAGE STABILITY ANALYSIS OF 1996 EVENT Long-term simulations were carried out to investigate the voltage instability event of 8" July of 1996 from 9.00am to 11.3Oam. The simulations were performed by both WPSTAB and ASTRE programs (see section 111).
The simulated scenario was based on two actual snapshots (at 9.00 and 10.00) of the EMS state estimator, which were retrieved from the EMS data base. Based on these snapshots the rate of load increase at each MV bus was derived. The switching of capacitor banks from 9.00 to 10.00 was also taken into account. as well as the dispatchers' action from 9.00 to 11.30. The latter consisted mainly in decreasing the active generation at critical power plants (in the Southem part of the system) in an attempt to increase their reactive limits.
In Fig. 2 the measured time response of a critical bus voltage is compared to the ones simulated by WPSTAB (line 1) and ASTRE (line 2). The two programs. as seen in Fig. 2,
give practically identical results. It is clear also that QSS
simulation was able to reproduce the dominant features of the phenomenon.
.
The mismatch between the simulations and the measurement is mostly due to the initial difference between measured voltage and state estimator estimate. In the sequel \WSTAB simulation results are used to explain the nature and tlie basic mechanisms driving this event.In Fig. 3 the voltage of the same critical HV bus is plotted versus the total active load of the Athens region. From this PV curve we can draw the following conclusions:
The maximum power that c& be transferred to the Athens region does not exceed 2020 MW.
During the event load admittances (as seen from the 1.50
kV side of distribution transformers) increased beyond the value corresponding to this maximum power limit (critical point). This is a definite indication of voltage instability, as it is well known that after the critical point the LTC dynamics become unstable [7].
As detected by the simulation all LTCs in the affected area reached their limits before the end of the load ramp. This stopped the voltage decline process that could otherwise escalate to a voltage collapse.
l - 1 1 I P U ) 0 9 4 I 092 ! 0 9 I 0 88 i 088 t 084 t 0 8 2 L ' . . 1820 1840 1860 1880 1900 1920 1940 1960 1980 2MM 2020
Total Ache Load of Athens repon (MW)
Pig 3 P-V curve o f a 150kV in the Athens region (incident d 1996)
0 Before the end of the simulation all generators in the South
part (and many more in the other parts) of the system had reached their excitation limits.
Simulation was also used to evaluate the effect of decreasing active generation close to the affected area in order
to increase reactive generator output. It was shown that this led to increased reactive power losses at the main corridor between north and south and consequently to further voltage drop. Thus the nature of the problem was determined to be one of corridor flow and not one of local reactive deficit.
V. COUNTERMEASURES AND SYSTEM UPGRADES
After the 1996 incident a number of measures both in the short and long term have been taken by PPC to avoid encountering similar phenomena in the future. The defense plan against such phenomena in the short term comprised:
increasing of the reference voltages (setpoints) of generators so as to reach 4 15 kV in the North and 420 kV
in the West part of the system.
Changing of the tap positions in EHV/HV substations in favor of the 400 kV network at the North-central system. This allows power to be transmitted in the North-South direction at a higher voltage reducing reactive losses and increasing reactive production of 400 kV lines.
Changing of the tap positions in EHV/HV substations in favor of the 150
kV
network at the metropolitan area of Athens. This increases the voltage level at the secondary transmission and subtransmission of the 150 kV system. The actions undertaken for the mid and long term included transmission network reinforcements. installation of new generating units in the Athens region as well as installation of capacitors in the South part of the system. The measures taken so far are:0 A new 400 kV double-circuit line connecting Athens to
the central part of the system was introduced. The construction of this line was completed in 1997, but it was put in operation only in 1999 due to public protest. An abandoned power plant in Piraeus feeding the 150 kV network has been converted to bum natural gas and was put back in operation. The nominal capacity of this plant is now 400 MW. The plant was out of operation since
198 1 for environmental reasons.
0
0 A new combined cycle unit of nominal capacity 560 MW.
burning natural gas, has been installed at Lavrion, near Athens feeding the 400 kV network.
New shunt capacitor banks of about 200 MVAr nominal reactive power have been installed in the South part of the system (Athens region and Peloponnese) on the MV side
of the HVMV substations.
Moreover. some further system reinforcements are foreseen Upgrade of the connection between Peloponnese and the West of the system by putting two new 150 kV submarine cables of nominal capacity 2 x 175 MVA.
Upgrade of some lines in the 150 kV network of Northern Peloponnese.
Restructuring of the 150 kV nenvork in the West part of the system.
0
far the years 2000-200 1. These reinforcements include:
0
0
VI. VOLTAGE SECURITY ASSESMENT OF THE UPGRADED SYSTEM
In this section the present state (1999) of the system is evaluated using the forecasted loads of the year 2000 summer peak. Only the existing upgrades discussed above are being considered in the system model. The system consists of 926 buses, 635 transmission lines, 506 transformers and autotransformers, 66 generators and 1 interconnection.
Two separate evaluation studies are performed. First a
contingency evaluation of the unavailability of the 4 units missing during the 1996 event, and then the calculation of the secure operation limits for all N- 1 contingencies, starting from the base case with all generators available
A. Repetition of 1996 scenario
For this scenario the 4 units that were out of service during the 1996 incident are removed and a uniform load increase is imposed on the system. This contingency is simulated using
HTSTAB and the total Athens region load is plotted versus the voltage of the same bus that was used in Fig. 3.
1 0 4 1 02 1 0 98 096 094 0 92 0 9 V ( P U ) 088 1 23M) 2320 2340 2360 2380 2400 2420 2440 2460 2480 25M) Total Active Load of A t h w area (hrlw)
Fig. 4 P-V curve of the same ISOkV bus in the Athens region (upgraded system)
The results are shown in Fig. 4, where it is seen that the aiaximum power consumption in the Athens area can increase
u p to 2475 MW. whereas in 1996 the maximum consumption was limited to less than 2020 MW.
It is also observed in Fig. 1 that the critical point, where the maximum of power transfer occurs, is crossed at relatively normal voltage levels. It should be noted that this-makes the occurrence of voltage instability much more difficult to detect by simply monitoring voltages.
B Secure operation limits
Simply stated, Secure Operation Limits
(SOLs)
indicate how far the system can be stressed prior to any contingency, such that it will remain stable after the contingencies.The
SOL
is an easy to interpret voltage security index. It refers to pre-contingency parameters that operators can either observe or control. ALSO, there is a clear separation between: ( I ) the pre-contingency configuration, u here operators and/or(ii) the post-contingency configuration, where only automatic controllers react to the system stress. And
controls are considered.
The ASTRE software has been used to evaluate the
SOLs
of the upgraded Greek system with respect to all N-1contingencies. The stress imposed is a load increase in the Athens and Peloponnese areas, counter-balanced by a generation in the northern part of the system. starting from the base case. For simplicity, each load is assumed to participate in proportion to its base case power. To avoid false stabilization the LTC limits are removed during
SOL
computation. The system is stressed using a (pre-contingency) load flow. The maximum stress of interest was set to 700 MW (the corresponding total base case load for the two areas is1770 MW).
A set of 789
N-1
contingencies is considered, each corresponding to a single branch tripping. This includes the tripping of generator step-up transformers, which disconnects both the generator and its auxiliaries that are fed from the same bus.Contingencies are filtered on the basis of the convergence of a post-contingency Load flow, run on the system operating at maximum stress (700 MW). Contingencies, for which the load flow (with constant power loads, thus anticipating the effect of LTCs) converges, are considered harmless and are discarded. The load flow calculations are shortened by: (i) not taking into account controls that are deemed to
improve voltage stability;
lii) early divergence detecting through the increase of the sum of squared mismatches to avoid unnecessary iterations.
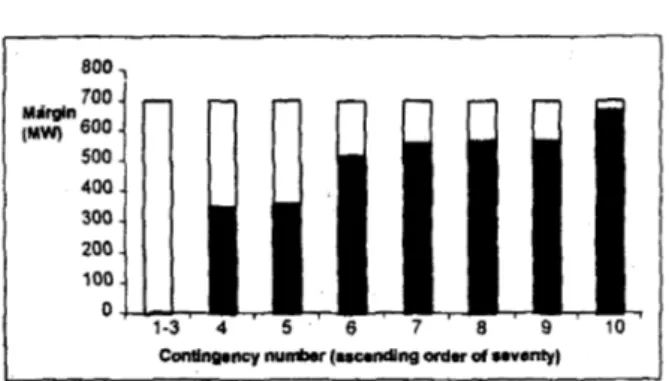
Table lSecure Operation Limits for the upgraded system No. Contingency description Margin
(MW) 1-3 Loss of a cable feeding Corfu (local effect) 5
4 Loss of E H V W transformer 350
5 Loss of line in N. Peloponnese (local effect) 360
6 Loss of generator MEG4 515
7 Loss of line in N. Peloponnese (local effect) 560 8 Loss ofline feeding Peloponnese from the 570
9 IAJSS of generator hlEG3 570
IO Loss of new comblned cycle plant In Lavrlon 670 West 800,
1
700 ( M w ) 6oo 500 400 300 200 100 0 MaifginI
Continprncy numbsr (ascending W n of seventy)I
Fig. 5.Secure Operation Limits (SOL) under contingencies
On the other hand. it is essential in this load flow calculation to account for the generator active power rescheduling and reactive power limits. The latter are automatically updated using the overexcitation limiter data available for
QSS
simulation. After this filtering step, 84 contingencies are declared potentially dangerous. Running a preliminary QSS simulation with ASTRE identifies only 10 contingencies as being really unstable at this maximum stress level. The remaining 72 are false alarms, caused by the conservative character of the load flow calculation. The filtering ratio is expected to be improved in the future.The secure operation limits of the 10 remaining contingencies are listed in Table I and are also shown graphically in Fig. 5 . The light background corresponds to the maximum stress considered.
Contingencies no. 1-3 refer to a local instability mode associated with the loss of one or the other of two 66 kV ciibles feeding the island of Corfu in the Northwest of the system.
PPC
has already planned the installation .:I new 150k V
cables as part of the upgrade of the West partof
the system. Contingency no. 4 is the first significant contingency corresponding to the loss of a 400/150kV
autotransformer in Athens area that is feeding the 150 kV lines to Peloponnese. Contingencies no. 5 and 7 induce a local instability in the northern part of Peloponnese, by creating a large roundabout way of feeding a couple of buses in this area. Contingency no. 6 is the loss of the largest unit in Peloponnese and is the second most significant limiting contingency. Contingency no. 8amounts
to the loss of the generation coming to Peloponnese fiom the West area. Contingency no. 9 is the loss of the second largest unit of Peloponnese. Contingency no. 10 is the loss of the new combined cycle plant in Lavrion. near Athens.The SOLs are computed in two steps. In a first step, a ":simultaneous binary search" [7] provides the lowest limit (3 contingencies) with the desired accuracy ( 5 MW in our case) and lower bounds for the less constraining contingencies. At this stage, the user can already figure out the distribution of
tlie various security limits. In a second step, all limits below
wme threshold (in this case the same 700 MW as in the first step) are refined to meet the specified accuracy.
The security limit computation can be complemented by an instability diagnosis. For a given level of stress and a given contingency, the unstable QSS time evolution of the system is analyzed through sensitivity and eigenvector analysis calculations, The corresponding results have confirmed the
above interpretation of the limiting contingencies. NTJ.0) are as follows:
The computing (elapsed) times on a 450-MHz PC (running
0
0
38 seconds for the prefiltering load flow I 10 seconds for the simultaneous binary search 96 seconds for the subsequent limit retlnement. The approach is thus computationally very efficient and allows to envisage real-time application in a near future.
VI1 CONCLUSIONS
Analysis showed that the 1996 incident was indeed due to voltage instability in the Athens region and the southern part of the system (Peloponnese). The subsequent system upgrades (new generation, new 400 kV line and capacitor banks) were proven to be very efficient in reinforcing the Athens region, so as to achieve larger loading margins even for the generation unavailability that led to the 1996 event.
The calculation of SOLS demonstrated that. the security margins are acceptable for all single contingencies (with the exception of those having only local effects). However, the nature of the limiting contingencies signifies that the region of Peloponnese. is rapidly becoming the most stressed part of the system. To this end, the upgrades already planned by PPC for next year, and particularly the reinforcement of the link between Peloponnese and western Greece. seem to be extremely timely. Also. a thorough stability analysis of the Peloponnese area is recommended.
The results of the SOL analysis indicate that the most significant contingencies for voltage stability are the tripping of a 400/150 kV autotransformer in the Athens area and the loss of the largest generator in Peloponnese. The inclusion of an on-line VSA function in the national EMS is currenrly being considered by PPC.
ACKNOWLEDGEMENT
The authors wish to acknowledge the contributions of Dr. T. Koronides of PPC. who provided the EMS historic data files for the 1996 incident. Ass. Prof. A. Kladas who helped
with the comparison of the initial 1996 load flows and Ms. M. Efstathiou. PPC engineer and NTUA graduate student, who helped in preparing the set of data for the upgraded system. Thanks are also due to Dr. A. Maissis, Director of
PPC
System Studies Dept., for his help and encouragement.REFERENCES
[ I ] C.Voumas (scieniific coordinator). "Investigation of low-voltage problems in the transmission network of PPC". project final report, Department of ECE. NTUA. Dec. 1997 (in Greek).
0-7803-5935-6/00/$10.00 (c) 2000 IEEE 1488
T Van Cutsem, Y. Jacquemart. J -N Marquet. P Pruvot. "A
comprehensive analysis of mid-term voltage stability". IEEE Transactions on Power Systems. Vol. IO. 1995. pp. I 173-1 I82
C. Voumas (scientific coordinator). "Development of software for
voltaxe stability analysis
-
Application to the Greek interconnected system". phase A final report, project 95S\TJ96 funded by the General Secretariat for Research and Technology. Athens. April 1999.C. D Voumas, G. A. Manos. "Long-term Simulation in the Vicinitv of Short-term Instabilities. l3* Power System Computational Conference. Trondherm Norway. June 1999. pp. 1146-1 154. T. Van Cutsem, "A comprehensive voltage security assessment". paper presented at the panel session on "Techniques for voltage stability limit search", IEEE 1998 Winter Power Meeting, Tampa (to be published by IEEE)
P. Kokotovic. H. b. Khalil. I. O'Reilly. "Singular Perturbotion .\lethods in Control. .4no/ysis ond Design". :\cademic Press. 1986. T Van Cutsem, C. Voumas. "I'obage Srobrlity of EIectrrc Power
Swrerns", Kluwer Academic Press. 1998.
T Van Cutsem. R. Mailhot. "Validation of a Fast voltage stability analysis method on the Hydro-Quebec s?stem". IEEE Transactions on Power Systems. Vol. 12, 1997. pp. 282-292
C. D. Voumas, G. A. Manos. P. W Sauer. M. A. Pai. "Effect of Overexcitation limiters on power system long-term modelling", to appear in IEEE Trans. on Energy Conversion.
BIOGRAPHIES
Costas D. Vournas received the Diploma of Electrical and Mechanical Engineering from NTUA in 1970. the MSc in Electrical Engineering from thi: University of Saskatchewan in 1976 and the Doctor of Engineering again from NTUA in 1986. He is currently Professor in the Electrical Energy Systems Lab of the Dept of Electrical and Computer Engineering of NTUA His research interests include voltage stability analysis. as well as power system control.
George A. Manos received the Diploma of Electrical and Computer Engineering from NTUA in 1993 and the Doctor of Engineering from the same University in 1998. He has participated in various pKIJeCtS involving vcdtage stability and frequency analysis of the Greek system and is currently norking part time for PPC.
John Knbouris received the Diploma of Electrical Engineering in 1985 arhd the Doctor of Engineering degree in 1992 from NTUA. In 1991 he joined PPC. where he IS currently with the System Studies Department. His research interests include power system analysis and renewable energy scurces.
Thierry Van Cutsem graduated in Electrical and Mechanical Engineering from the University of Liege (Belgium) in 1979. where he obtained the Ph.0. degree in 1983 and is now lecturer. Since 1980. he has been with the FNRS (Belgian National Fund for Scientific Research). of which he is now a Research Director. His interests are in power system dynamics. control and stability, numerical simulation and security analysis.