Université de Montréal
ANALYSIS OF THE ESOPHAGOGASTRIC JUNCTION USING
THE 3D HIGH RESOLUTION MANOMETRY
By Frédéric NICODÈME
Department of Physiology
Faculty of Medicine
Thesis prepared at NORTHWESTERN UNIVERSTY
and presented at UNIVERSITÉ DE MONTRÉAL
(Faculté des études supérieures et postdoctorales)
for the degree of
Philosophiæ Doctor in Physiology
ANALYSIS OF THE ESOPHAGOGASTRIC JUNCTION USING
THE 3D HIGH RESOLUTION MANOMETRY
JURY MEMBERS
President
Dre Marie-Josée HÉBERT
Centre Hospitalier de l’Université de Montréal, QC
Directors
Dr André DURANCEAU
Centre Hospitalier de l’Université de Montréal, QC
Dr Peter J. KAHRILAS
Northwestern University, Chicago, IL
Dr John E. PANDOLFINO
Northwestern University, Chicago, IL
External Reviewer
Dr Nicholas E. DIAMANT
Queen’s University, Kingston, ON
Reviewer
Dr Mickael BOUIN
Centre Hospitalier de l’Université de Montréal, QC
Dean’s representative Dr Pierre POITRAS
To my wife Johanne, to Alexandre, To my parents and grand-parents, To my brother, sister and their families, To my friends, To Thomas.
RÉSUMÉ (English)
Background & Aims: Conventional water-perfused manometry and high resolution
manometry permitted the development of a variety of manometric methodologies and metrics to understand the motility of the esophagus and to quantify esophagogastric junction (EGJ) characteristics. However, the anatomy in the area of the EGJ is complex and
intraluminal manometry recordings detect pressure signals referable both to intrinsic esophageal structures and to adjacent extrinsic structures impinging on the esophagus. Both have distinct sphincteric mechanisms within the EGJ. The dominant pressure signals detected near the EGJ are attributable to the lower esophageal sphincter (LES) and the crural diaphragm (CD). However, neither of these technologies were able to distinguish between the different components of the EGJ.
When analyzing EGJ characteristics as a reflection of its competence against reflux, the more widely used manometric parameters are the EGJ length and the respiratory
inversion point (RIP), defined as the location at which inspiratory pressure deflections change from positive (abdomen) to negative (chest). However, the significance of these metrics has not gained wide acceptance in the gastroenterology community as evident in a recent American Gastroenterology Association Institute (AGAI) Position Statement (1) concluding that ‘The current role of manometry in gastroesophageal reflux disease (GERD) is to exclude motor disorders as a cause of the continued symptoms’.
During deglutition, the objective quantitative measurement of EGJ relaxation, the integrative relaxation pressure (IRP), permits one to distinguish between normal and abnormal EGJ relaxation. However, comparison between spatial pressure variation plots and relaxation pressures derived from circumferentially averaged pressures suggest a persistent high pressure at the hiatal center during a period that flow is known to be occurring whereas this was not seen using nadir radial pressure data.
Recently, a 3D-high resolution manometry (3D-HRM) assembly (Given Imaging, Duluth, GA) has been developed with the potential to simplify the assessment of EGJ
pressure morphology and physiology. The 3D segment of the array permits high resolution recording both axially and radially while maintaining a stationary sensor position.
Consequently, 3D-HRM should allow for the measurement of important EGJ parameters such as length and RIP. Data extracted from the 3D-HRM recording may also allow differentiating pressure signals within the EGJ attributable to the intrinsic sphincter and to the surrounding elements. Moreover, 3D-HRM preserves the individual pressure values of each radially dispersed sensor within the array, permitting one to overcome the apparent persistent high pressure during the deglutitive relaxation.
Thus, the aims of this work were 1) to describe the EGJ pressure morphology at rest, comparing measures made with real time 3D-HRM to simulations of a conventional pull-through protocol and to define the pressure signatures attributable to the diaphragmatic and LES pressure components within the 3D-HRM recording; 2) to assess deglutitive EGJ
on finding the minimal radial pressure at each axial level (3D-eSleeve) should provide a representation of the luminal pressure gradient across the EGJ that is more relevant to predicting periods of trans-sphincteric flow using barium transit on fluoroscopy as the comparator. We also sought to adapt the IRP metric to the HRM array using the 3D-eSleeve principle (3D-IRP) and compare normative values obtained with this new paradigm to standard IRP calculations.
Methods: Patients were studied with a 3D-HRM assembly. The 3D-HRM assembly
incorporated a 9 cm 3D-HRM segment into an otherwise standard HRM assembly; the 3D segment was comprised of 12 rings of 8 radially dispersed independent pressure sensors, spaced 7.5mm apart.
At rest, 9 volunteers were studied and recordings were done during a station pull-through of the 3D-HRM segment withdrawing it across the EGJ at 5 mm increments with each position held for 30s (sufficient to capture several respiratory cycles). Conventional
measures of ‘LES length’ were made using 4 radially dispersed sensors within the 3D-HRM array, defining the margins of the sphincter by a 2 mmHg pressure increase relative to gastric or esophageal pressure. In the 3D-HRM, the proximal and distal limits of the EGJ were defined as the axial locations first detecting a 360° circumferential pressure increase of 2 mmHg relative to the stomach. RIP was determined, A) in the tracing mode: using the pull-through of 4 single sensors spaced 7.5 mm apart [RIP is the average value of 4 radially dispersed sensors] and B) in a stationary position using the software pressure inversion point
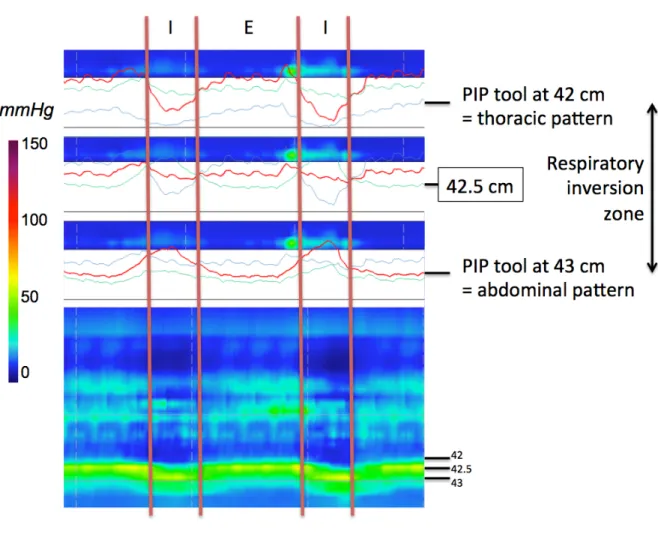
(PIP) tool. In the esophageal pressure topography (EPT) mode, the tracing changed progressively from a thoracic pattern to an abdominal pattern, and the RIP was localized within the inversion zone with the PIP tool tracing.
For the study of the EGJ deglutitive relaxation, 25 volunteers underwent 3 consecutive 10-swallows protocols of 5 ml of water in the supine position with both the standard (once) and 3D-HRM (twice) devices in random sequence. During the 3D-HRM studies, the EGJ was measured once with the 3D-sleeve segment and once with a proximal (non-3D sleeve
portion) of the device incorporating standard HRM sensors. For each subject, the IRP was calculated in four ways: 1) conventional method with the standard HRM device, 2)
conventional method with a standard HRM segment of the 3D-HRM device, 3) conventional method using the 3D-HRM sleeve segment, and 4) a novel 3D-HRM eSleeve paradigm (3D-IRP) localizing the radial pressure minimum at each locus along the eSleeve. Fourteen additional subjects then underwent synchronized simultaneous videofluoroscopy and 3D-HRM (including two 5-ml barium swallows). Pressure data were exported to MATLAB™ and four pressures were measured simultaneously: 1) esophageal body pressure 2cm above EGJ, 2) intragastric pressure, 3) radially average eSleeve pressure and 4) 3D-eSleeve pressure. Data were plotted to determine the flow permissive time (FPT) characterized as periods during which a pressure gradient through the EGJ is present (esophageal pressure > EGJ relaxation pressure (radial average or 3D-eSleeve paradigm) > gastric pressure). FPT was calculated during a 10s time window after upper sphincter relaxation. The presence or
calculated the corresponding sensitivity and specificity for both radial average and 3D-eSleeve analyses of FPT with bolus transit evident on fluoroscopy being the reference.
Results: 3D-HRM recordings suggested that sphincter length assessed by a
pull-through method greatly exaggerated the estimate of LES length by failing to discriminate among circumferential contractile pressure and asymmetric extrinsic pressure signals attributable to diaphragmatic and vascular structures. Real-time 3D EGJ recordings found that the dominant constituents of EGJ pressure at rest were attributable to the diaphragm.
The 3D-IRP was significantly less than all other calculations of IRP with the upper limit of normal being 12 mmHg vs. 17 mmHg for the standard IRP. The sensitivity (0.78) and the specificity (0.88) of the 3D-eSleeve were also better than the standard eSleeve (0.55 and 0.85, respectively) for predicting flow permissive time verified fluoroscopically.
Discussion & Conclusion: Our observations suggest that the 3D-HRM permits
real-time recording of EGJ pressure morphology facilitating analysis of the EGJ constituents responsible for its function as a reflux barrier at rest. The axial and radial spatial resolution of the 9 cm 3D-HRM segment may permit further studies to differentiate pressure signals within the EGJ attributable to the LES and to extrinsic structures (diaphragm and vascular artifacts). These attributes of the 3D-HRM device suggest it to be a promising new tool in the study of GERD pathophysiology.
During deglutition, we evaluated the feasibility of improving the measurement of IRP utilizing a novel 3D-HRM assembly and a novel 3D-eSleeve concept based on finding the axial maximum of the radial minimum pressures at each sensor ring along the sleeve
segment. Our findings suggest that this approach is more accurate than standard HRM and other methods that utilize a radially averaged pressure within the EGJ. Although we can only speculate on how much this will improve clinical management, 3D-HRM will certainly improve the accuracy of EGJ relaxation measurements and this will certainly impact research endeavors focused on modeling EGJ function during swallowing and reflux.
KEY WORDS
• Esophagogastric junction • Esophageal manometry
• 3D-High resolution manometry • Deglutition physiology
RÉSUMÉ (Français)
Contexte & Objectifs : La manométrie perfusée conventionnelle et la manométrie
haute résolution (HRM) ont permis le développement d’une variété de paramètres pour mieux comprendre la motilité de l'œsophage et quantifier les caractéristiques de la jonction œsophago-gastrique (JOG). Cependant, l'anatomie de la JOG est complexe et les
enregistrements de manométrie détectent à la fois la pression des structures intrinsèques et des structures extrinsèques à l'œsophage. Ces différents composants ont des rôles distincts au niveau de la JOG. Les pressions dominantes ainsi détectées au niveau de la JOG sont attribuables au sphincter œsophagien inférieur (SOI) et aux piliers du diaphragme (CD), mais aucune des technologies manométriques actuelles n’est capable de distinguer ces différents composants de la JOG.
Lorsqu’on analyse les caractéristiques de la JOG au repos, celle ci se comporte avant tout comme une barrière antireflux. Les paramètres manométriques les plus couramment utilisés dans ce but sont la longueur de la JOG et le point d’inversion respiratoire (RIP), défini comme le lieu où le pic de la courbe de pression inspiratoire change de positif (dans
l’abdomen) à négatif (dans le thorax), lors de la classique manœuvre de « pull-through ». Cependant, l'importance de ces mesures reste marginale comme en témoigne une récente prise de position de l’American Gastroenterology Association Institute (AGAI) (1) qui
concluait que « le rôle actuel de la manométrie dans le reflux gastro-œsophagien (RGO) est d'exclure les troubles moteurs comme cause des symptômes présentés par la patient ».
Lors de la déglutition, la mesure objective de la relaxation de la JOG est la pression de relaxation intégrée (IRP), qui permet de faire la distinction entre une relaxation normale et une relaxation anormale de la JOG. Toutefois, puisque la HRM utilise des pressions
moyennes à chaque niveau de capteurs, certaines études de manométrie laissent suggérer qu’il existe une zone de haute pression persistante au niveau de la JOG même si un transit est mis en évidence en vidéofluoroscopie.
Récemment, la manométrie haute résolution « 3D » (3D-HRM) a été développée (Given Imaging, Duluth, GA) avec le potentiel de simplifier l'évaluation de la morphologie et de la physiologie de la JOG. Le segment « 3D » de ce cathéter de HRM permet
l'enregistrement de la pression à la fois de façon axiale et radiale tout en maintenant une position fixe de la sonde, et évitant ainsi la manœuvre de « pull-through ». Par conséquent, la 3D-HRM devrait permettre la mesure de paramètres importants de la JOG tels que sa
longueur et le RIP. Les données extraites de l'enregistrement fait par 3D-HRM permettraient également de différencier les signaux de pression attribuables au SOI des éléments qui l’entourent. De plus, l’enregistrement des pressions de façon radiaire permettrait
d’enregistrer la pression minimale de chaque niveau de capteurs et devrait corriger cette zone de haute pression parfois persistante lors la déglutition.
Ainsi, les objectifs de ce travail étaient: 1) de décrire la morphologie de la JOG au repos en tant que barrière antireflux, en comparant les mesures effectuées avec la 3D-HRM en temps réel, par rapport à celle simulées lors d’une manœuvre de « pull-through » et de
2) d’évaluer la relaxation de la JOG pendant la déglutition en testant l'hypothèse selon laquelle la 3D-HRM permet le développement d’un nouveau paradigme (appelé « 3D eSleeve ») pour le calcul de l’IRP, fondé sur l’utilisation de la pression radiale minimale à chaque niveau de capteur de pression le long de la JOG. Ce nouveau paradigme sera comparé à une étude de transit en vidéofluoroscopie pour évaluer le gradient de pression à travers la JOG.
Méthodes : Nous avons utilisé un cathéter 3D-HRM, qui incorpore un segment dit
« 3D » de 9 cm au sein d’un cathéter HRM par ailleurs standard. Le segment 3D est composé de 12 niveaux (espacés de 7.5mm) de 8 capteurs de pression disposés radialement, soit un total de 96 capteurs.
Neuf volontaires ont été étudiés au repos, où des enregistrements ont été effectués en temps réel et pendant une manœuvre de « pull-through » du segment 3D (mobilisation successive du cathéter de 5 mm, pour que le segment 3D se déplace le long de la JOG). Les mesures de la longueur du SOI et la détermination du RIP ont été réalisées. La longueur de la JOG a été mesurée lors du « pull-through » en utilisant 4 capteurs du segment 3D dispersés radialement et les marges de la JOG ont été définies par une augmentation de la pression de 2 mmHg par rapport à la pression gastrique ou de l’œsophage. Pour le calcul en temps réel, les limites distale et proximale de la JOG ont été définies par une augmentation de pression circonférentielle de 2 mmHg par rapport à la pression de l'estomac. Le RIP a été déterminée, A) dans le mode de tracé conventionnel avec la méthode du « pull-through » [le RIP est la valeur moyenne de 4 mesures] et B) en position fixe, dans le mode de représentation
topographique de la pression de l’œsophage, en utilisant l’outil logiciel pour déterminer le point d'inversion de la pression (PIP).
Pour l'étude de la relaxation de la JOG lors de la déglutition, 25 volontaires ont été étudiés et ont subi 3 études de manométrie (10 déglutitions de 5ml d’eau) en position couchée avec un cathéter HRM standard et un cathéter 3D-HRM. Avec la 3D-HRM, l’analyse a été effectuée une fois avec le segment 3D et une fois avec une partie non 3D du cathéter (capteurs standard de HRM). Ainsi, pour chaque individu, l'IRP a été calculée de quatre façons: 1) avec la méthode conventionnelle en utilisant le cathéter HRM standard, 2) avec la méthode conventionnelle en utilisant le segment standard du cathéter 3D-HRM, 3) avec la méthode conventionnelle en utilisant le segment « 3D » du cathéter 3D-HRM, et 4) avec le nouveau paradigme (3D eSleeve) qui recueille la pression minimale de chaque niveau de capteurs (segment 3D).
Quatorze autres sujets ont subi une vidéofluoroscopie simultanée à l’étude de manométrie avec le cathéter 3D-HRM. Les données de pression ont été exportés vers
MATLAB ™ et quatre pressions ont été mesurées simultanément : 1) la pression du corps de l’œsophage, 2cm au-dessus de la JOG, 2) la pression intragastrique, 3) la pression radiale moyenne de la JOG (pression du eSleeve) et 4) la pression de la JOG en utilisant la pression minimale de chaque niveau de capteurs (pression du 3D eSleeve). Ces données ont permis de déterminer le temps permissif d'écoulement du bolus (FPT), caractérisé par la période au cours de laquelle un gradient de pression existe à travers la JOG (pression œsophagienne >
en vidéofluoroscopie et le FPT ont été codés avec des valeurs dichotomiques pour chaque période de 0,1 s. Nous avons alors calculé la sensibilité et la spécificité correspondant à la valeur du FPT pour la pression du eSleeve et pour la pression du 3D eSleeve, avec la vidéofluoroscopie pour référence.
Résultats : Les enregistrements avec la 3D-HRM laissent suggérer que la longueur du
sphincter évaluée avec la méthode du « pull-through » était grandement exagéré en incorporant dans la mesure du SOI les signaux de pression extrinsèques à l’œsophage, asymétriques et attribuables aux piliers du diaphragme et aux structures vasculaires. L’enregistrement en temps réel a permis de constater que les principaux constituants de la pression de la JOG au repos étaient attribuables au diaphragme.
L’IRP calculé avec le nouveau paradigme 3D eSleeve était significativement inférieur à tous les autres calculs d'IRP avec une limite supérieure de la normale de 12 mmHg contre 17 mmHg pour l’IRP calculé avec la HRM standard. La sensibilité (0,78) et la spécificité (0,88) du 3D eSleeve étaient meilleurs que le eSleeve standard (0,55 et 0,85 respectivement) pour prédire le FPT par rapport à la vidéofluoroscopie.
Discussion et conclusion : Nos observations suggèrent que la 3D-HRM permet
l'enregistrement en temps réel des attributs de la JOG, facilitant l'analyse des constituants responsables de sa fonction au repos en tant que barrière antireflux. La résolution spatiale axiale et radiale du segment « 3D » pourrait permettre de poursuivre cette étude pour
(diaphragme et artéfacts vasculaires). Ces attributs du cathéter 3D-HRM suggèrent qu'il s'agit d'un nouvel outil prometteur pour l'étude de la physiopathologie du RGO.
Au cours de la déglutition, nous avons évalué la faisabilité d’améliorer la mesure de l’IRP en utilisant ce nouveau cathéter de manométrie 3D avec un nouveau paradigme (3D eSleeve) basé sur l’utilisation de la pression radiale minimale à chaque niveau de capteurs de pression. Nos résultats suggèrent que cette approche est plus précise que celle de la
manométrie haute résolution standard. La 3D-HRM devrait certainement améliorer la précision des mesures de relaxation de la JOG et cela devrait avoir un impact sur la recherche pour modéliser la JOG au cours de la déglutition et dans le RGO.
MOTS CLEF
• Jonction œsophago-gastrique • Manométrie de l’œsophage • Manométrie haute résolution 3D • Physiologie de la déglutition • Reflux gastro œsophagien
INDEX OF CONTENT
INTRODUCTION ... 1
REVIEW OF LITERATURE ON HIGH RESOLUTION MANOMETRY (HRM) ... 5
1) Technical aspects of esophageal high resolution manometry ... 5
a) Pressure sensors ... 5
b) Esophageal pressure topography (EPT) ... 6
c) Manometry protocol ... 9
2) Analysis of esophageal motility in EPT ... 10
a) Esophagogastric junction (EGJ) ... 11
b) Esophageal peristalsis and contractions ... 13
3) Primary role of HRM: evaluation of esophageal motility disorders ... 16
a) Definition of esophageal motility disorders ... 16
b) The Chicago Classification of esophageal motility disorders ... 20
c) Comparison of HRM with esophageal conventional manometry ... 22
4) Diagnostic role of esophageal HRM beyond the motility disorders ... 23
a) Gastro-esophageal reflux disease (GERD) ... 23
b) Other specific medical conditions ... 25
c) Specific surgical conditions ... 26
INTRODUCING THE 3D HRM FOR THE ASSESSMENT OF EGJ CHARACTERISTICS .. 28
AIMS OF THE STUDY ... 32
!
METHODS ... 35
1)Subjects ... 35
a) For the description of the EGJ pressure morphology at rest ... 35
b) For the assessment of the EGJ relaxation during the deglutition ... 35
2)Manometry assemblies ... 36
a) The standard HRM catheter ... 36
b) The 3D-HRM assembly ... 36
3)Manometry protocols and data analysis ... 38
a) For the description of EGJ pressure morphology at rest ... 38
b) For the assessment of the EGJ relaxation during the deglutition ... 42
1. Phase I protocol: comparison of the IRP and 3D-IRP ... 42
2. Phase II protocol: assessment of accuracy for determining bolus transit ... 43
· eSleeve and IRP analysis paradigms ... 44
· Comparing flow permissive time to bolus transit ... 46
RESULTS ... 49
1)Subjects ... 49
2)3D-HRM EGJ pressure morphology at rest ... 50
· High-pressure zone length ... 56
· Respiratory inversion ... 58
3)Assessment of EGJ relaxation during the deglutition ... 59
· Comparison of IRP and 3D-IRP ... 59
· Minimal radial sensor density for 3D-IRP measurement ... 60
· Using the 3D-IRP to calculate FPT ... 61
DISCUSSION RELATIVE TO THE PUBLISHED ARTICLES ... 63
CONTINUATION OF THE DISCUSSION ... 69
1)Clarifications relative to the pressure signal of EGJ components ... 69
a) Example of Achalasia ... 69
b) Wavelet transform filtering ... 70
2)Potential roles for the 3D-HRM in clinical practice ... 74
a) Roles in the evaluation of the EGJ, in GERD ... 74
b) Potential role for 3D-HRM in the assessment of the UES ... 86
CONCLUSIONS ... 89
ANNEXES ... 91
1)ACCURACY OF THE 3D-HRM ASSEMBLY ... 91
3)ABBREVIATIONS (ALPHABETIC ORDER) ... 95
REFERENCES ... 96
LIST OF FIGURES
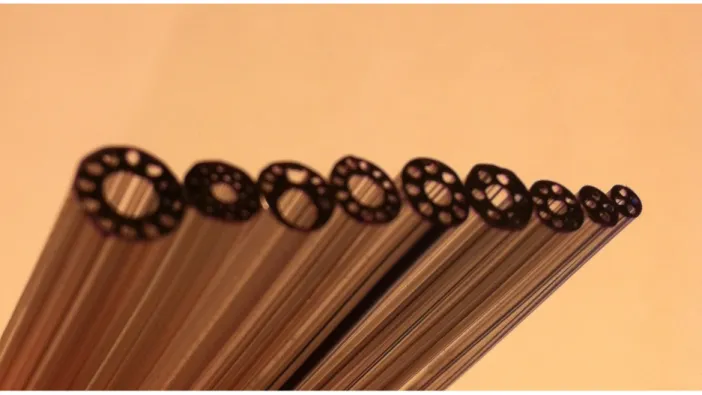
Figure 1. Page 2. Illustration of different extrusions used for conventional water-perfused manometry catheters.
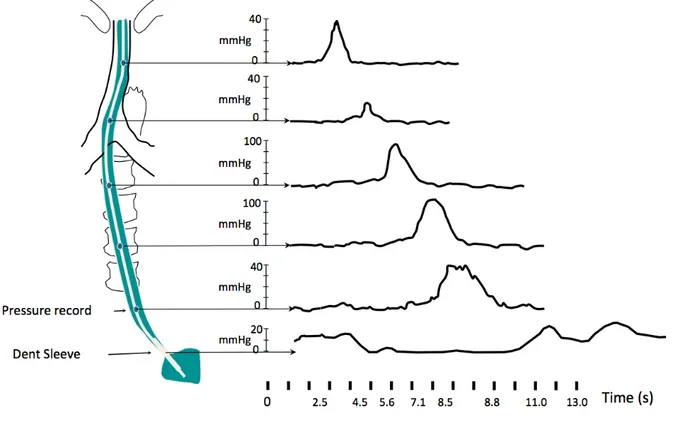
Figure 2. Page 3. Example of a manometric study with a conventional
water-perfused manometry.
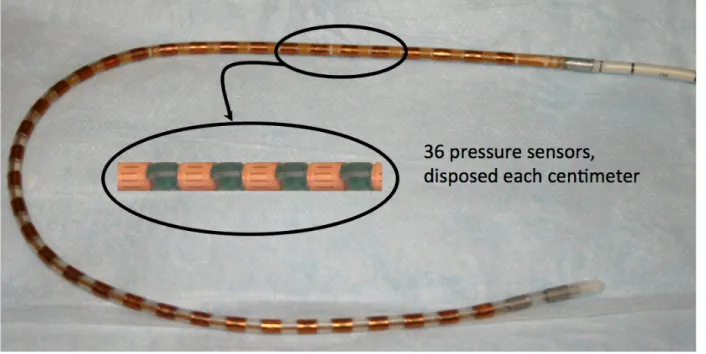
Figure 3. Page 6. Picture of the standard HRM catheter, by Given Imaging.
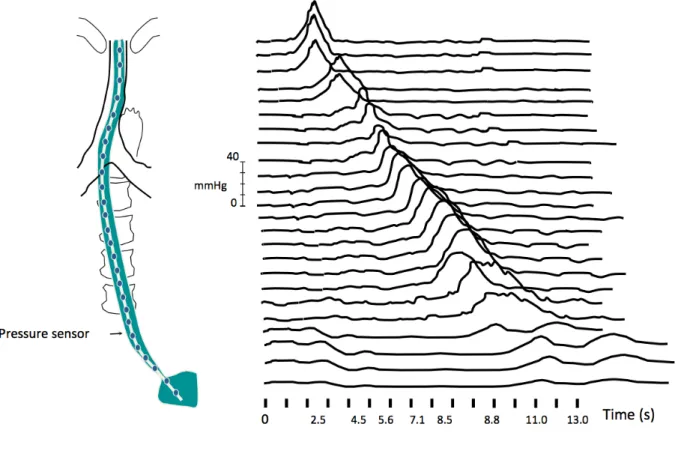
Figure 4. Page 7. Manometric study with a HRM catheter without EPT.
Figure 5. Page 8. Description of the esophageal pressure topography.
Figure 6. Page 11. HRM parameters.
Figure 7. Page 31. EPT of a swallow from an asymptomatic patient with a standard HRM assembly.
Figure 8. Page 37. Characteristics of the 3D-HRM assembly and resulting 3D-HRM views.
Figure 9. Page 41. Characteristics of the RIP, using the 3D-HRM assembly.
Figure 10. Page 43. Positions of the HRM assemblies used for the calculation of IRP.
Figure 11. Page 45. Snapshot of pressure recordings in the 3D segment of the
3D-HRM assembly within the EGJ.
Figure 12. Page 47. Example of calculation of the flow permissive time (FPT) with the 3D-HRM assembly.
Figure 13. Page 51. Representative examples of 3D-HRM still images.
Figure 14. Page 52. Sagittal view of a CT-scan of the esophagus.
Figure 15. Page 53. Schematic explanation of the inverted V plot.
Figure 16. Page 55. 3D-HRM of the EGJ at rest (Panel A), in the post-deglutitive period (Panel B), and in case of hiatal hernia (Panel C).
Figure 17. Page 58. Representative 3D-HRM image illustrating the 3D-HRM
localization of the respiratory inversion zone using the ‘PIP tool’ compared to measures made using station pull-through simulations.
Figure 18. Page 60. Correlation between 3D-IRP average values.
Figure 19. Page 70. Case of achalasia analyzed using the 3D-HRM assembly.
Figure 21. Page 77. Position of the 3D-HRM segment during the station pull-through protocol, utilized for the calculation of V-V.
Figure 22. Page 78. 3D-HRM still images of the EGJ.
Figure 23. Page 80. Schematic representation of the methodology used for the calculation of EGJ V-V.
Figure A1. Page 92. Pressure accuracy of the 96 sensors of the 3D-HRM array in the testing chamber pressurized in 10 mmHg increments, after thermal compensation.
LIST OF TABLES
Table 1. Page 13. Normal values for IRPs using different HRM systems.
Table 2. Page 57. Localization and length of the HPZ defined by station pull-through and 3D-HRM at expiration.
Table 3. Page 59. Normal values for IRP and 3D-IRP (mmHg) using the standard HRM and 3D-HRM assemblies in 25 normal subjects, calculated using the β-Manoview software.
Table 4. Page 61. MATLAB™ simulation of the 3D-IRP varying the radial resolution of the 3D assembly by selectively utilizing progressively fewer of the radial pressure sensors.
Table 5. Page 82. Example of pressures recorded at inspiration and end-expiration, with corresponding EGJ V-V (mmHg2.mm) calculated using the 3D-HRM real-time method.
Table 6. Page 83. Values of EGJ V-V (mmHg2 x mm) at inspiration and expiration
ACKNOWLEDGMENTS
André Duranceau, for his everyday support and trust, Peter J. Kahrilas and John E. Pandolfino, for their availability, their time and their teaching, Zhiyue Lin, for his advices during my stay in Chicago, Kristina, Lubomyr, Gabriella, Chang, Tim, Meghan, Jordan and Chrissy, for their precious
INTRODUCTION
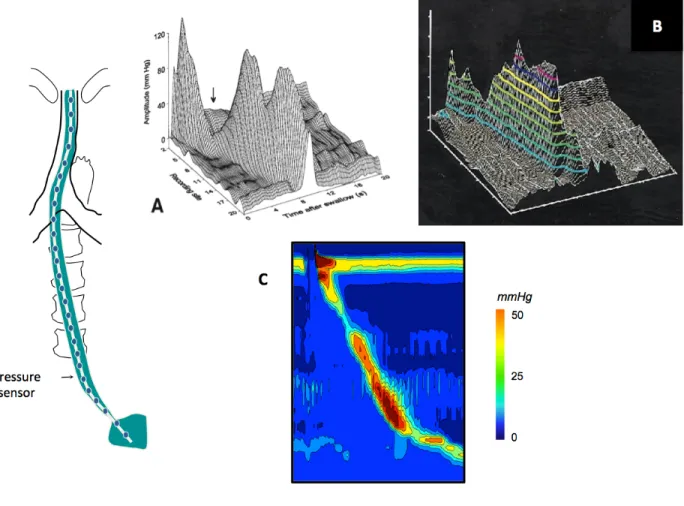
Esophageal manometry has been used in humans since the early 1950s (2-4). The first measurements of esophageal pressure were provided by balloon-tipped catheters containing a small amount of air, which were introduced into the lower esophagus.
Subsequently, the water-perfused system (conventional manometry) was developed with catheters composed of a bundle of thin polyvinyl tubes with side holes, positioned at 3-5 cm intervals, providing point pressure measurements (Figure 1). Esophageal contractions that occlude the lumen interfere with the continuous low rate (but high pressure) flow through the channels and therefore raise the pressure in the corresponding channel. This pressure information is continuously monitored and transmitted to a recorder (Figure 2).
The limitations of the water-perfused systems are that the differences between vertical catheter tip position and pressure transducer can significantly influence the measured
pressure and air contained in the fluid column can dampen the recording (5). Furthermore, much information is lost or missing given the widely spaced side-holes and because pressure is only recorded in one radial orientation of the catheter circumference. The station pull-through technique was introduced by Code and colleagues in 1956 to improve on this (6). Thus, the catheter was pulled gradually across the esophagogastric junction (EGJ) to evaluate its entire length and the maximum generated pressure. This maneuver, however, is
time-sphincter relaxation or movement (7). This problem was ameliorated by Dent, who introduced a perfused sleeve sensor in 1976 that detects the highest pressure along its length and allows continuous measurement of the maximum EGJ pressure (8). The sleeve length is generally 6 cm in adults, although EGJ movement may exceed that length during reflux events or esophageal shortening during spasm. Conventional water-perfused manometry entails a catheter with 4 to 8 sensors including a sleeve sensor (9).
Figure 1. Illustration of different extrusions used for conventional water-perfused manometry catheters.
Figure 2. Example of a manometric study with a conventional water-perfused manometry. Schematic representation of the manometry catheter positioned in the esophagus, with 5 pressure records along the esophagus and the Dent sleeve positioned within the EGJ. The resulting tracing mode recording is illustrated (Figure courtesy of Dr Pandolfino,
Northwestern University, Chicago).
Although there have been numerous technical advances in conventional manometry, multiple maneuvers and need for catheter movement for EGJ measurements prolong test time and increase the level of expertise needed to conduct the test accurately. Even in those with expertise, inter-observer agreement in the interpretation of manometric findings is poor (10). The association between manometric findings and symptom severity or disease course is also poor (11). Water-perfused systems are cumbersome and catheters are stiff
and uncomfortable. Moreover, the large distance between sensors produces an information gap and may not detect important findings.
Initially described by Clouse and Staiano (12,13), high-resolution manometry (HRM) with esophageal pressure topography (EPT) circumvents many of the limitations of
conventional manometry by utilizing enhanced spatial pressure resolution and data
visualization. The evolution of the technical aspect of manometry allows the development of novel metrics to quantify the distinct aspects of the esophageal function and permit the determination of classifications to better understand the pathophysiology and to propose to the patients the best available therapeutics.
REVIEW OF LITERATURE ON HIGH RESOLUTION MANOMETRY (HRM)
1) Technical aspects of esophageal high resolution manometry
a) Pressure sensors
The concept of high resolution manometry (HRM) is to provide a sufficient number of pressure sensors within the esophagus to monitor intraluminal pressure as a continuum along the entire length of the esophagus. HRM probes are comprised of 18 to 36 pressure sensors depending on the company that commercialize these devices (Given Imaging, MMS, or Sandhill). Pressure sensors are water-perfused or solid-state pressure sensors: 1) Water-perfused pressures sensors were initially used for HRM. 2) Solid-state sensors consist of strain gauge transducers (MMS, Sandhill) or TactArray™ devices, a proprietary transducer technology (Given Imaging). For strain gauge transducers, pressure is measured
unidirectionally whereas it is measured circumferentially (360° around with averaged pressure) for TactArray™ devices.
The Given Imaging HRM catheter consists of 36 pressure sensors spaced 1 cm apart (Figure 3) whereas the MMS consists of 36 unidirectional strain gauge pressure sensors spaced at 1 cm interval and the Sandhill probe consists of 32 pressure sensors: from the distal to the proximal extremity 15 sensors spaced at 1 cm apart, 8 sensors spaced at 1.5 cm
Figure 3. Picture of the standard HRM catheter, by Given Imaging.
Illustration of the Given Imaging standard HRM catheter, showing the 36 pressure sensors rings disposed each centimeter along the catheter. Each ring contains one TactArray™ device that averages the pressure at each centimeter.
In all cases, the probe is connected to a recording unit and a computer (via a pneumohydraulic pump in case of water-perfused pressure sensors).
b) Esophageal pressure topography (EPT)
The difference between conventional manometry and HRM is the quantity of
information available for analysis. With conventional manometry, intraluminal pressures are analyzed from a set of two-dimensional tracings (Figures 2 & 4). Clouse et al. (12)
they developed a three-dimensional plotting method connecting data in space as well as time and defined a topographic pressure plot, fundamental to high resolution interpretation and analysis (Figure 5).
Figure 4. Manometric study with a HRM catheter without EPT.
This figure illustrates the fact that HRM is the evolution of conventional manometry: using the tracing mode, the pressure recorded is similar to the pressure recorded using the
conventional manometry. However, the resulting tracings are difficult to understand and interpret, due to the mixing curves (Figure courtesy of Dr Pandolfino, Northwestern University, Chicago).
Figure 5. Description of the esophageal pressure topography.
Illustration of the development of esophageal pressure topography (12): in panel A, the raw data as recorded by the pressure sensors, with cubic spline interpolation between the records. Information is presented in 3 axes: time, distance from the nares and pressure. Panel B shows the topographic isobaric lines with different colors depending of the pressure value. Panel C presents the actual EPT mode.
c) Manometry protocol
The manometry catheter is inserted transnasally and positioned to record from the hypopharynx to the stomach with at least 3 intragastric sensors. The catheter is fixed in place by taping it to the nose. A typical manometry protocol includes a 30-s baseline recording without swallowing and ten 5-ml water swallows in supine position. Normal values have been established with this protocol in 75 controls for Given Imaging system (14-17) and in 20 controls for the solid state sensors MMS system (18).
Some authors have proposed to perform HRM in an upright (or sitting) position reasoning that it is more physiologic than the supine position. Hence, normal values are also available for the upright position (19). Moving upright to supine resulted in a shorter transition zone, and a slower and more vigorous esophageal contraction. Comparing the diagnosis of esophageal motility disorders in 100 consecutive patients Roman et al. showed that the diagnosis was concordant in the supine and upright positions in 72 patients (20). Xiao et al. showed that changing position elicited a significant change in diagnosis in about 10% of studies (21). Later on, it will be important to remember that the Chicago
classification for esophageal motility disorders is intended for use with studies done in the supine position.
Different physiological challenges including different bolus viscosity and high volume (10 ml and 20 ml water swallows) have been proposed to increase diagnostic yield, especially in patients with dysphagia. Basseri et al. showed that an apple sauce challenge increased
the identification of classifiable motor disorders in a series of 41 patients with dysphagia (22). Similarly, the percentage of ineffective motility was increased with bread swallows compared to water swallows in one study (23). On the other hand, Daum et al. noticed an increased percentage of effective contractions with bread swallows in patients with non-erosive reflux disease (24). Only patients with erosive reflux disease failed to respond to physiologic challenge of solid bolus. Sweis et al. established normal values for solid swallows (bread) and noticed a lower proportion of peristaltic swallows with solid than liquid in controls (19). Multiple water swallows might also be used as physiologic challenge (24). The patient is provided with 200 ml of water to drink within 30 s using multiple swallows. Recently, Xiao et al. (21) showed that provocative bolus challenges with viscous liquid and marshmallows increased the detection of EGJ outflow obstruction (see below: definition of esophageal motility disorders).
In summary, performing manometric evaluations in both supine and upright positions with provocative swallows may increase the yield of standard HRM technique.
2) Analysis of esophageal motility in EPT
Specific HRM metrics have been developed to analyze EPT plots. Each of these parameters has been developed to assess a specific function of the esophagus at rest, during the deglutitive process or after swallowing. Parameters described in this section are
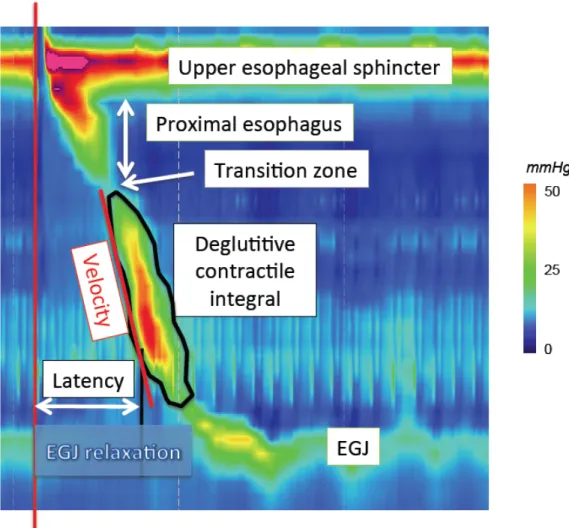
Figure 6. HRM parameters.
EPT of a swallow with basic HRM parameters, permitting to classify the esophageal motility.
a) Esophagogastric junction (EGJ)
EGJ is the portion of the esophagus that is the most studied in the literature (15,17,25-38).
EGJ morphology evaluated in EPT is composed of the lower esophageal sphincter (LES) and crural diaphragm (CD), which are usually superimposed. However in the case of
hiatal hernia, two high pressure zones (HPZs) can be distinguished corresponding
respectively to LES and CD. Bredenoord at al. noticed an intermittent separation of the LES and CD in GERD patients using EPT (28). Further Pandolfino et al. proposed to classify EGJ in 3 types (32). Type I is defined as an absence of separation between LES and CD; type II as a minimal LES-CD separation (< 2cm); and type III as a LES-CD separation > 2 cm. The inter observer agreement to classify EGJ morphology was moderate in the only study in which it was tested (20).
Several EPT metrics have been proposed to assess EGJ relaxation: the single-sensor nadir pressure, the integrated relaxation resistance, the 3-s nadir eSleeve pressure, the 1-s integrated relaxation pressure (IRP) and the 4-s IRP (15). These metrics are calculated using an eSleeve measurement after the demarcation of the proximal and the distal border of the EGJ. The 4-s IRP had the best sensitivity and specificity to diagnose achalasia, and was selected to assess EGJ relaxation. Moreover, the term ‘IRP’ now implies ‘4-s IRP’ in the HRM literature. 4-s IRP is the lowest mean EGJ pressure for 4 contiguous or non-contiguous seconds in the 10-s period following upper esophageal sphincter (UES) relaxation
(deglutitive window) (15). A mean IRP (10 swallows) greater than 15 mmHg is considered as abnormal using the Given Imaging system (95th percentile).
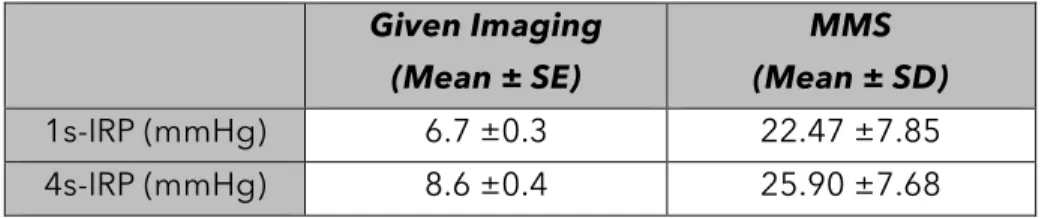
Normal values for EGJ resting pressure have been established for the Given Imaging system in 75 controls (15,39) and for the MMS solid state sensors in 20 controls (18) (Table 1).
Normal values are specific for sensors types and arrays with marked differences between devices.
Table 1. Normal values for IRPs using different HRM systems.
Given Imaging (Mean ± SE) MMS (Mean ± SD) 1s-IRP (mmHg) 6.7 ±0.3 22.47 ±7.85 4s-IRP (mmHg) 8.6 ±0.4 25.90 ±7.68
b) Esophageal peristalsis and contractions 1 Contraction architecture
EPT allows a topographic characterization of esophageal contractions. Clouse first distinguished 3 to 4 segments in the contraction wave with 2 to 3 troughs respectively (13,40). Two troughs were identified, a proximal one and a distal one. A third trough between the proximal and the distal one is sometimes present in controls and in patients. This middle trough is less prominent than the others. Some motility disorders may affect predominantly one of the segments: for instance Clouse noticed that nutcracker esophagus primarily affects the distal segment (40). Gyawali emphasized that high amplitude segment location might differentiate mechanical obstruction from functional obstruction in patients with elevated post deglutitive residual pressure across the LES (41). Thus, pressures shifted to the second segment with mechanical obstruction and to the third segment in the
functional obstruction. Moreover, among patients with non-cardiac chest pain, a shift in contractile vigor to the third segment was observed in acid sensitive subjects (42).
The proximal trough is also known as the transition zone (TZ) as it might correspond to the transition between the striated muscle of the proximal esophagus and the smooth muscle of the distal esophagus (43-46). Complete bolus transit requires coordination between the proximal and the distal contraction. Even if the transition zone is physiological, a greater spatial separation as well as a delay between proximal and distal esophageal contraction might be more frequent in patients with dysphagia and/or GERD than in controls (44,46,47).
Finally integrity of the contraction may predict the occurrence of complete/incomplete bolus transit. Using impedance combined HRM, Bulsiewicz et al. determined that the
smallest defect predictive of incomplete bolus transit measured 2.1 cm at a 20-mmHg
isobaric contour and 3.2 cm at a 30-mmHg isobaric contour (48). Consequently, it has been proposed to assess the integrity of contraction at a 20-mmHg isobaric contour (49). A failed contraction is defined as minimal (< 3cm) integrity of the 20-mmHg isobaric contour distal to the transition zone. A weak contraction with a large break is defined as the presence of a break > 5 cm in length in the 20-mmHg isobaric contour. It was constantly associated with incomplete bolus transit in a series of 16 controls (49). A weak contraction with small break is defined as the presence of 2-5 cm break in the 20-mmHg isobaric contour and was variably associated with incomplete bolus transit in the same series of controls. The contraction is considered intact when the 20-mmHg isobaric contour is without large or small breaks.
The contraction architecture is also characterized by a contractile deceleration point (CDP) (50). This inflection point is identified as the point along the 30-mmHg isobaric contour at which propagation velocity slows demarcating the tubular esophagus from the phrenic ampulla. It has been recently shown that the segment of concurrent contraction during normal peristalsis progressively increased as peristalsis progressed, peaked at the CDP, and then progressively decreased (51). The clinical relevance of abnormal extent or timing of concurrent contraction still remains to determine.
Double peaks contractions were observed by Clouse in symptomatic patients (52). Sampath et al. demonstrated that these multipeaked contractions might be the consequence of a respiratory artifact (53). Respiration related movement of the contracted segment in relation to the stationary sensors could create the multipeaked pattern. However in case of high amplitude contractions these multipeaked contractions are not always synchronized with respiration (54). This suggests that multipeaked contractions might be a distinct entity with physiological and clinical significance.
Finally, esophageal shortening which is easily observed in EPT might be used to assess esophageal longitudinal muscle contraction as suggested by Mittal (55,56).
2 Metrics to assess esophageal contraction
distal contractile integral (DCI): this is the product of the integral of amplitude times the duration times the length of the contraction (expressed as mmHg-s-cm) between the
proximal and the distal trough (16). Only pressures above 20 mmHg are taken into account in DCI calculation to exclude intra-bolus pressure (IBP). Using the Given Imaging system, a value greater than 5,000 mmHg-s-cm is considered as abnormal and a value greater than 8,000 mmHg-s-cm is never encountered in healthy volunteers.
The velocity of the contraction is assessed using the contractile front velocity (CFV) (50). This is the slope of the tangent approximating the 30-mmHg isobaric contour between the transition zone and the CDP. A value greater than 9 cm/s is considered as abnormal.
The last metric is the distal latency (DL) (57); this corresponds to the duration of deglutitive inhibition that precedes esophageal contraction. The DL is the time interval between UES relaxation and the CDP. A DL shorter than 4.5 s is considered as abnormal and defines a premature contraction (58).
3) Primary role of HRM: evaluation of esophageal motility disorders a) Definition of esophageal motility disorders
Esophageal motility disorders have been described and classified, using the previously described EPT parameters.
• Achalasia
Achalasia is characterized by impaired EGJ relaxation and an absence of normal esophageal peristalsis. An impaired EGJ relaxation is defined as a mean IRP ≥ 15 mmHg in EPT. Pandolfino et al. proposed to subdivide achalasia into 3 clinically relevant subtypes according to the pattern of esophageal contraction and pressurization (59). Type I achalasia (classic achalasia) is characterized by absence of esophageal contractions and absence of esophageal pressurization; type II (achalasia with pressurization) by absence of esophageal contractions and ≥ 20% swallows with panesophageal pressurization; and type III (spastic achalasia) by ≥ 20% spastic contractions with or without pan-esophageal pressurization. Type II achalasia is associated with the best response to either pneumatic dilation or Heller myotomy, type III with the worst response and type I with an intermediate response. These findings have been confirmed in 3 other majors studies (60-62).
The interobserver and intraobserver agreement for differentiating achalasia from non-achalasia patients using these criteria was very good to excellent (63). More variability was seen in agreement when classifying achalasia subtypes: the Cohen’s κ for inter-rater reliability for type I varied from low moderate to very good (κ=0.44-0.84), ranged for type II from good to very good (κ=0.68-0.93) and was very good for type III (κ=0.86-1.0).
HRM might also be helpful for a better understanding of achalasia physiopathology. When occurring in type II achalasia panesophageal pressurization seems to be the
consequence of a distinct motor pattern characterized by contraction of both sphincters and the intervening esophageal longitudinal muscle, but without lumen-obliterating contraction of the circular muscle in the inter-sphincteric span (55,64). In type III achalasia the
esophageal muscularis propria appears thickened (55).
• EGJ Outflow obstruction
EGJ outflow obstruction is defined as impaired EGJ relaxation associated with some instances of preserved peristalsis (65). It was encountered not only in patients with previous fundoplication but also in patients without any previous surgery or mechanical EGJ
obstruction (41,65). The distinction between EGJ outflow obstruction and an achalasia variant can be difficult (65,66) in cases of associated hypertensive peristalsis (54). The location of the high amplitude segment in the distal or in the middle segment might be predictive of the etiology (mechanical or idiopathic) of EGJ obstruction (66).
• Diffuse esophageal spasm
Diffuse esophageal spasm (DES) was redefined in EPT (58). Simultaneous contractions appeared a heterogeneous entity. Using distal latency to define premature contraction
allows a more specific definition of DES compared to contractile front velocity (CFV). Thus, premature contractions were encountered in patients with DES or spastic achalasia.
Pandolfino et al. proposed to define DES as the presence of at least 20% premature contractions (58).
• Hypercontractile and hypertensive esophagus
Hypertensive or nutcracker esophagus is defined as a mean DCI greater than 5,000 mmHg-s-cm in a context of a normal CFV (14). Hoshino et al. demonstrated that the threshold value of 8,000 mmHg-s-cm was more clinically significant than 5,000 mmHg-s-cm and was more frequently associated with chest pain and dysphagia (67). It was then proposed to define hypercontractile esophagus as the presence of at least one contraction with a DCI greater than 8,000 mmHg-s-cm (54). As these high DCI contractions were frequently multipeaked, it was suggested to nickname this disorder “jackhammer esophagus”.
• Weak, frequent failed and absent peristalsis
Weak peristalsis was defined as the presence of more than 20% of contractions with large breaks or more than 30% of contractions with small breaks (49). It was more frequently
observed in patients with unexplained dysphagia than in controls whereas this motility disorder remains borderline normal.
Frequent failed peristalsis was defined as more than 30% of contractions with absent peristalsis and absent peristalsis as 100% of absent contractions.
b) The Chicago Classification of esophageal motility disorders
After having determined EPT metrics and quantified the normative data, the first priority was to classify the esophageal motility disorders (achalasia, esophageal spasm…) into a widely accepted classification. The Chicago Classification is the resulting classification of esophageal motility disorders in EPT, and excludes the evaluation of EGJ as an antireflux barrier. This classification is intended for patients without previous gastrointestinal surgery and currently does not include the evaluation of pharynx, UES, or proximal esophageal segment (68,69). The first iteration was published in 2008 (14). Through the work of the Chicago group and the international HRM Working Group this classification evolved and a second iteration was published in 2009 (39). Finally, after the meeting of the international HRM working group in Ascona, Switzerland, in April 2011, a new iteration of the classification has been proposed taking into account the most recent publications and was summarized by Bredenoord et al. in 2012 (68).
EPT metrics are applied to score individual swallows and a decision algorithm permits the classification of the motility disorders. The analysis of esophageal motility disorders is focused firstly on normal or impaired EGJ relaxation and then on swallow score. Impaired EGJ relaxation, defined as an IRP greater than the upper limit of normal, is encountered in achalasia and EGJ outflow obstruction. Other esophageal motility disorders are subdivided into motility disorders that are never observed in normal individuals (absent peristalsis, DES, hypercontractile esophagus) and peristaltic abnormalities, which are defined by exceeding statistical limits of normal (rapid contraction, hypertensive peristalsis, weak peristalsis, frequent failed peristalsis).
Recently, Lin, et al have developed a classification and regression tree (CART) model (70) to interpret the EPT metrics in an automated mode. His findings were that IRP cutoffs suggested by the CART model ranged from 10 to 17 mmHg. In consequence, IRP should not been viewed as a dichotomous value and thresholds can be modified to compensate for the associated esophageal body contractility (71). In a series of 100 consecutive patients the inter observer agreement was good to diagnose motility disorders with the classification of 2009 (20).
c) Comparison of HRM with esophageal conventional manometry
Few data are available concerning the comparison between HRM and conventional manometry for esophageal motility disorders: both examinations were realized in the same patient in only one study (25), focused on EGJ evaluation. Fifty-five patients underwent HRM 30 minutes after conventional manometry. There was no significant difference in
measurement of LES resting pressure between the 2 techniques. However, the authors emphasized the tendency to overestimate overall and abdominal LES length with HRM.
Sadowski et al. compared 20 patients who underwent conventional manometry to 21 patients who underwent HRM (72). The main finding was that total procedure time was reduced with HRM compared to conventional manometry (30.7 min vs. 41.8 min, p<0.05). No significant difference was observed in the discomfort scores reported by the patients or in study quality.
Tracing and EPT analysis methods were compared in different studies using water-perfused HRM. Clouse found that the diagnostic agreement was 88.2% between the 2 methods in a population of 220 patients (52); conventional analysis could not identify 6 achalasia patients and 8 patients with incomplete LES relaxation. In a series of 95 barium swallows with concurrent esophageal videofluoroscopy and manometry, Fox showed that EPT was more accurate than conventional tracings to predict abnormal bolus transit (73). Some types of motor dysfunction including localized disturbances of peristalsis and abnormal
movement of LES during esophageal spasm were detected only by EPT analysis and not by conventional analysis or radiography. However in another study, the agreement to detect ineffective motility was very good between the 2 methods (κ coefficient from 0.79 to 0.90, depending on the bolus viscosity and the body position) (23).
4) Diagnostic role of esophageal HRM beyond the motility disorders
According to an AGA technical review the only established role for manometry in GERD was the exclusion of ‘motor disorders as a cause of the continued symptoms’ (1) and in other specific medical conditions (esophageal or not). However we should qualify this statement in view of recent developments in EPT interpretation recently developed to assess these specific conditions.
a) Gastro-esophageal reflux disease (GERD)
HRM might be helpful to better understand GERD physiopathology. It provides a better assessment of EGJ anatomy and physiology. Bredenoord et al. showed that LES-CD separation was associated with reflux occurrence (28). Cardiovascular compression,
Transient lower esophageal sphincter relaxations (tLESRs) play an important role in GERD genesis in patients with or without hiatal hernia. Different studies emphasized that HRM might be more accurate than conventional manometry to detect tLESRs (75-77). HRM and perfused manometry with a Dent sleeve probe were recorded simultaneously in 2 of these studies (76,77). Criteria including nadir pressure, relaxation duration, percentage of relaxation and 4s-IRP pressure have been proposed to diagnose tLESRs in EPT (76).
According to an ROC curve analyses, relaxation duration appeared to be the most discriminant parameter. Other criteria such as diaphragmatic inhibition, esophageal shortening (78) and UES relaxation (79,80) were frequently encountered in tLESRs and are easy to identify with HRM. Furthermore the interobserver agreement to detect tLESRs was almost perfect with HRM (κ=0.83) whereas it was only fair with conventional manometry (κ=0.38) (76). Terminating motor events were also studied in tLESRs using EPT: secondary peristalsis was the most common (81). Bredenoord et al. did not observe differences between tLESRs associated with reflux and those without (82). However a greater trans-sphincteric pressure gradient was noted in tLESRs associated with acid reflux than in those without reflux (83) and was greater in GERD patients than in controls (84). In patients with achalasia, tLESRs were characterized with diaphragmatic inhibition and esophageal
shortening (85).
Ineffective esophageal motility (IEM), defined as a swallow response associated with poor bolus transit in the conventional line tracing (CLT) manometry, is believed to play an
IEM in EPT is a mixture of failed swallows and weak swallows with breaks in the middle/distal troughs. A DCI value <450mmHg-s-cm can be used to predict ineffective swallow
previously defined in CLT. IEM can be defined by >5 swallows with weak/failed peristalsis or with a DCI <450mmHg-s-cm.
Finally, the study by Hoshino (88) proposed a novel EPT metric (LES pressure integral) to quantify the strength of the EGJ as a reflux barrier at rest, utilizing the DCI tool. We recently worked on a modified version of the LES pressure integral that normalizes for respiratory rate and is referenced to intragastric pressure would better characterize the barrier function of the EGJ. This novel metric may be useful in distinguishing patients with functional heartburn from those with refractory GERD (Article in press, NMO 2014).
b) Other specific medical conditions
All patterns of disordered esophageal motility were observed in patients with
eosinophilic esophagitis (EoE) (89-91). Moreover, pan-esophageal pressurization might be more frequent in patients with EoE than in controls (90,91). Scleroderma has also been characterized in EPT with esophageal dysmotility observed in 2/3 of patients (92).
HRM has also been used to study motility in different pulmonary conditions;
candidates than in controls in EPT (93). Decrease of esophageal pressure and increase of end inspiratory UES and EGJ pressures were observed during obstructive sleep apnea (94).
Other studies focused on the effect of anesthesia on upper and lower esophageal sphincters function (95-99). Propofol increased LES pressure whereas remifentanil decreased LES pressure. Both drugs decreased UES pressure.
c) Specific surgical conditions
HRM studies have been done in different groups of patients with fundoplication or bariatric surgery.
• Fundoplication
First of all, esophageal manometry is recommended in all patients before
fundoplication. Indeed, some patients with achalasia have a clinical presentation of GERD, as it has been emphasized by the Amsterdam group using HRM (100).
In HRM studies done before and after fundoplication (83,101,102), the postsurgical condition was characterized by a disappearance of a double peaked HPZ at the EGJ level (101) as expected but, moreover, incomplete LES relaxation was noticed after fundoplication as well as increased IBP (102).
HRM has been proposed to evaluate patients with recurrent GERD after
fundoplication. Ineffective motility, hypertensive LES, impaired LES relaxation (103) and dual HPZ (104) have been identified as potential explanations for symptoms. Finally, partial and complete fundoplication had been compared; axial EGJ pressure profile was less
affected in patients with partial fundoplication than in those with complete fundoplication (105).
• Laparoscopic adjustable gastric band (LAGB)
HRM might be also of interest in patients with LAGB. Esophageal peristalsis was characterized with frequently repetitive contractions (106) and an increase in distal
esophageal peristaltic pressure after band inflation (107). Different patterns of contractions were observed in LAGB patients associated with dysphagia: absent peristalsis, pseudo-achalasia, EGJ outflow obstruction, hypotensive peristalsis, and normal peristalsis (108,109). Different pressurization pattern were also observed: pan-esophageal pressurization, hiatal hernia pressurization or gastric pouch pressurization (108,110-112). These patterns were observed after regular water swallows (108) or semi-solid stress barium protocol (2
consecutive spoonful of barium-soaked porridge followed immediately by drinking of up to 80 ml of liquid barium via a straw) (110-112).
INTRODUCING THE 3D HRM FOR THE ASSESSMENT OF EGJ
CHARACTERISTICS
Review of the literature showed that conventional manometry and HRM permitted the development of a variety of manometric methodologies and metrics to understand the motility of the esophagus and to quantify EGJ characteristics. However, the anatomy in the area of the EGJ is complex and intraluminal manometry recordings detect pressure signals referable both to intrinsic esophageal structures and to adjacent extrinsic structures
impinging on the esophagus. Each have distinct sphincteric mechanisms within the EGJ (113). The dominant pressure signals detected near the EGJ are attributable to the LES, the CD, the lower thoracic aorta and the heart. Both previously described technologies were unable to distinguish between theses components of EGJ pressure.
When analyzing EGJ characteristics as a reflection of its competence against reflux (114), a station pull-through protocol was used as the standard to determine the length of the EGJ HPZ and to localize the RIP, defined as the location at which inspiratory pressure
deflections changed from positive (abdomen) to negative (chest) (115). Surgeons have utilized the position of the RIP in relation to the HPZ to determine the intra-abdominal component of the EGJ as a predictor of fundoplication efficacy (116). However, the significance of HPZ length and intra-abdominal length have not gained wide acceptance in the gastroenterology community as evident in a recent AGAI Position Statement concluding
that ‘The current role of manometry in gastroesophageal reflux disease (GERD) is to exclude motor disorders as a cause of the continued symptoms’ (1). In essence, it was concluded that the quantitative assessment of EGJ pressure morphology achieved with conventional manometry lacked sufficient validation to be useful in clinical management.
On the other side, during deglutition, the objective quantitative measurement of EGJ relaxation, the IRP, permits to distinguish between normal and abnormal EGJ relaxation (117). As presented in the review, the IRP utilizes an electronic sleeve (eSleeve) paradigm to calculate the average pressure during the four seconds of most complete EGJ relaxation in the post-deglutitive period. This measurement was validated as a more accurate measure of EGJ relaxation than prior methods and currently has been adopted as a key measurement in the new HRM classification schemes for esophageal motor disorders (118). Although the IRP is conceptually sound as a metric of EGJ relaxation, it is a very technology-sensitive measurement and normative values of the metric must be linked to the assembly with which they were derived. In work published thus far, standard HRM (360 HRM, Given Imaging, Los Angeles) has been utilized.
Recently, the 3D-high resolution manometry (3D-HRM) assembly (Given Imaging, Duluth, GA) has been developed with the potential to greatly simplify the assessment of EGJ pressure morphology (119) and physiology. The 3D segment of the array permits high resolution recording both axially and radially while maintaining a stationary sensor position.
Consequently, 3D-HRM should allow for the measurement of EGJ parameters, as length, that were only possible with pull-through maneuvers in the past and these measurements can be made in real time permitting analysis of the respiratory and vascular effects. Moreover, data extracted from the 3D-HRM recording may allow differentiating pressure signals within the EGJ attributable to the intrinsic sphincter and to the surrounding elements. 3D-HRM preserves the individual pressure values of each radially dispersed sensor within the array.
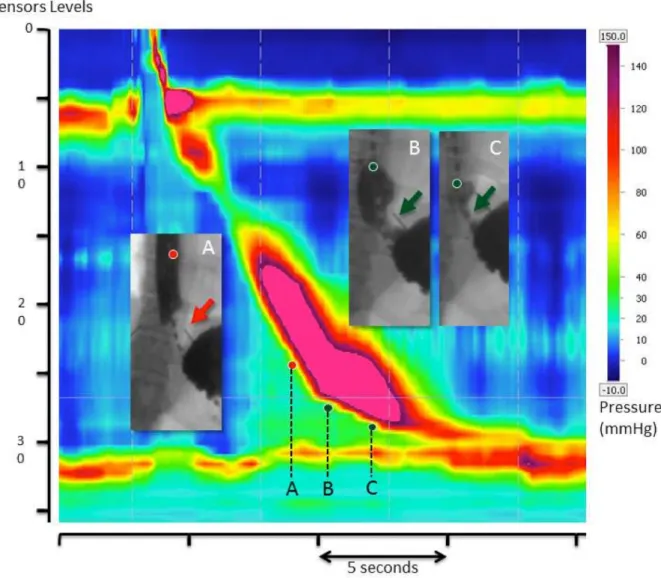
The first published observations using the 3D-HRM assembly (119,120) suggest that the nadir pressure value at each axial level provide a higher fidelity recording of intraluminal pressure gradients and sphincter relaxation than do circumferentially averaged pressures on account of their being less influence of radial pressure asymmetries imparted by extrinsic structures. Illustrative of this, comparison between spatial pressure variation plots and relaxation pressures derived from circumferentially averaged pressures suggest a persistent high pressure at the hiatal center during a period that flow is known to be occurring (Figure 7) whereas this was not seen using the nadir radial pressure data. The above observations suggest that the 3D-HRM array using an analysis paradigm premised on finding the minimal radial pressure at each axial level (3D-eSleeve) should provide a representation of the luminal pressure gradient across the EGJ that is more relevant to predicting periods of
Figure 7. EPT of a swallow from an asymptomatic patient with a standard HRM assembly. Dots represent the same location in HRM and videofluoroscopy at times A, B and C. The synchronous videofluoroscopy shows that bolus is not present (red arrow) at time A, but shows that bolus is present (green arrow) at times B and C even though the pressure gradient suggests that this would be impossible.
AIMS OF THE STUDY
We focused our studies on the analysis of the EGJ using 3D-HRM, in which the 3D segment of the array permitted high resolution recording both axially and radially within the EGJ. We studied the EGJ as an anti-reflux barrier at rest and during deglutition for the assessment of the coordinated relaxation of its different components:
- To describe the EGJ pressure morphology at rest, we compared measures of EGJ
pressure morphology made with real time 3D-HRM to measures made simulating a conventional pull-through protocol and to define the pressure signatures of the
diaphragmatic and LES pressure components within the 3D-HRM recording. This work is published: Nicodème F, Lin Z, Pandolfino JE, Kahrilas PJ. Esophagogastric Junction pressure morphology: comparison between a station pull-through and real-time 3D-HRM
representation. Neurogastroenterol Motil. 25(9), e591–8 (2013).
- To assess the EGJ relaxation during deglutition, we tested the hypothesis that the
3D-HRM array using an analysis paradigm premised on finding the minimal radial pressure at each axial level (3D-eSleeve) should provide a representation of the luminal pressure
gradient across the EGJ that is more relevant to predicting periods of trans-sphincteric flow using barium transit on fluoroscopy as the comparator. We also sought to adapt the IRP metric to the 3D-HRM array using the 3D-eSleeve principle (3D-IRP) and compare normative values obtained with this new paradigm to standard IRP calculations. This work is
published: Nicodème F, Pandolfino JE, Lin Z, Xiao Y, Escobar G, Kahrilas PJ. Adding a radial dimension to the assessment of esophagogastric junction relaxation: validation studies of the 3D-eSleeve. AJP: Gastrointestinal and Liver Physiology. 303(3), G275–80 (2012).
METHODS
1) Subjects
a) For the description of the EGJ pressure morphology at rest
Nine volunteers were recruited for this study. None of them had a history of prior gastrointestinal surgery, significant medical disease, or current use of medications for upper gastrointestinal symptoms. All subjects underwent a brief interview and examination and gave written informed consent. Dysphagia was assessed using the Impaction Dysphagia Questionnaire (IDQ, maximal score: 50; 95th percentile cutoff in controls: 2). Reflux
symptoms were measured using the GerdQ (scale 0-18; positive for GERD if score ≥7) (121). The study protocol was approved by the Northwestern University Institutional Review Board.
b) For the assessment of the EGJ relaxation during the deglutition
Thirty-nine subjects were recruited during the two phases of the study. None of the subjects had a history of prior gastrointestinal surgery, significant medical disease or were currently utilizing medications for upper gastrointestinal symptoms. All subjects underwent a brief interview and examination and gave written informed consent. Dysphagia was assessed using the IDQ (maximal score: 50; 95th percentile cutoff in controls: 2). Reflux
symptoms were measured using the GerdQ (scale 0-18; positive for GERD if score ≥7) (121). The study protocol was approved by the Northwestern University Institutional Review Board.
2) Manometry assemblies
a) The standard HRM catheter
The standard HRM catheter was a 4.2 mm outer diameter solid-state manometric assembly with 36 circumferential sensors spaced 1 cm apart (Given Imaging, Duluth, GA). Each level sensor averaged the pressure signals from the 12 radially dispersed sensors into a single circumferential pressure value. The data acquisition frequency was 25 Hz. All pressure measurements were referenced to atmospheric pressure.
b) The 3D-HRM assembly
The 3D-HRM assembly was a 128-channel solid-state device incorporating a 9.0 cm 3D-HRM segment into an otherwise standard HRM array (Figure 8A). The 4.2 mm outer diameter assembly had the 3D-HRM segment positioned between 28 proximal and 4 distal standard sensing elements that were spaced 1 cm apart (119). Each standard sensor averaged the pressure signals from the 12 radially dispersed sensors into a single
circumferential pressure value. The 3D segment was comprised of 12 rings of 8 radially dispersed independent pressure sensors with the rings spaced 7.5 mm apart. The
individual 3D sensing elements were 2.5 mm long and separated from the adjacent element by 5 mm. Consequently, the 9 cm 3D segment provided 96 independent pressure
recordings with a radial resolution of 45° and an axial resolution of 7.5 mm (Figure 8B & 8C). The data acquisition frequency was 100 Hz.
Figure 8. Characteristics of the 3D-HRM assembly and resulting 3D-HRM views.
Panel A is a representation of the 3D-HRM catheter composed of the assembly of 32 standard HRM sensors and 12 levels of 8 radially dispersed sensors. The resulting image is a cylinder (Panel B) that can be unfolded for the 3D-HRM panoramic view (Panel C). Gray dots