Computational Jobs in Data Grids
Volodimir Begy1,3, Joeri Hermans2, Martin Barisits1, Mario Lassnig1, and
Erich Schikuta3
1 CERN, Geneva, Switzerland
2 University of Li`ege, Li`ege, Belgium 3
University of Vienna, Vienna, Austria
Abstract. The data access patterns of applications running in comput-ing grids are changcomput-ing due to the recent proliferation of high speed local and wide area networks. The data-intensive jobs are no longer strictly required to run at the computing sites, where the respective input data are located. Instead, jobs may access the data employing arbitrary com-binations of data-placement, stage-in and remote data access. These data access profiles exhibit partially non-overlapping throughput bottlenecks. This fact can be exploited in order to minimize the time jobs spend waiting for input data. In this work we present a novel grid computing simulator, which puts a heavy emphasis on the various data access pro-files. The fundamental assumptions underlying our simulator are justified by empirical experiments performed in the Worldwide LHC Computing Grid (WLCG) at CERN. We demonstrate how to calibrate the simulator parameters in accordance with the true system using posterior inference with likelihood-free Markov Chain Monte Carlo. Thereafter, we validate the simulator’s output with respect to an authentic production workload from WLCG, demonstrating its remarkable accuracy.
Keywords: Grid Computing · Data Access Patterns · Network Model-ing · Discrete Event Simulation · Bayesian Deep LearnModel-ing · Likelihood-free Inference.
1
Introduction
A large number of applications from different scientific fields relies on extensive computing resources. These resources are provided by data centers, which are in turn aggregated to form computing grids [10]. Employing a wide range of heterogenous hardware, the participating computing sites work together to reach a common goal in a coordinated manner. Grids store vast amounts of scientific data, and numerous users run computational jobs to analyze these data in a highly distributed and parallel fashion. For example, within the World-Wide LHC Computing Grid (WLCG) more than 150 computing sites are employed by the ATLAS experiment at CERN. WLCG stores more than 360 petabytes of ATLAS data, which is used for distributed analysis by more than 5000 users.
The grid resources are typically divided into three major classes: storage elements, worker nodes and network. Certain job types, e.g. Monte Carlo pro-duction in the domain of High Energy Physics are data-intensive. These jobs are executed on data grids, which posses higher storage capacities and network throughput. The strict division of labour among classes of machines has led to the fact that the current best practice for data access in the grid is data-placement [24]. Given a job scheduled to run at a specific data center, its execu-tion may commence only after the compleexecu-tion of the following workflow. First, the input data needs to be placed from the remote storage element to the lo-cal one. Secondly, the data has to be staged-in from the lolo-cal storage element into the worker node’s scratch disk. Data-placement is handled by distributed data management (DDM) systems. For instance, the DDM system employed by the ATLAS experiment at CERN is Rucio [12]. An alternative approach is to stream the input data from storage elements employing remote data access. With the contemporary proliferation of high speed local and wide area networks remote data access is no longer prohibitively expensive. In recent years numerous researchers have been examining its properties in WLCG [9].
In a grid computing setting it is challenging to design reproducible stud-ies due to the highly dynamic nature of the system. Furthermore, performance studies with high workloads interfere with the applications running in produc-tion. A powerful tool to address these issues is a simulator, which is statistically tested with respect to authentic logs from production workloads. In this work we propose a novel grid computing simulator named GDAPS (Grid Data Access Profiles Simulator). GDAPS is a discrete event simulator based on the estab-lished SimPy framework. It supports modeling of the 3 common data access profiles in computing grids: data-placement, stage-in and remote data access. Its source code is publicly available athttps://github.com/VolodimirBegy/GDAPS. The rest of the paper is organized as follows. In Section2we present related work in the field of simulation of data-intensive systems. Thereafter, we demon-strate the results of empirical experiments, which we have executed in the World-wide LHC Computing Grid. These results justify the fundamental assumptions underlying the construction of GDAPS. Section4describes the architecture and the data transfer mechanism of the simulator. Next, we evaluate the accuracy of GDAPS by simulating an authentic production workload. Prior to the simula-tion the tool has to be calibrated in accordance with the true system. We tune the simulator parameters responsible for the parameterization of the system’s latent processes. For this purpose we rely on approximate Bayesian inference. In particular, we perform posterior inference with likelihood-free Markov Chain Monte Carlo.
2
Related Work
A large body of work in the literature addresses the construction of grid and cloud computing simulators for respective performance studies. However, none of these simulators provide the means to realistically model the behavior of
different data access profiles over LAN and WAN. Most simulators model the network in overly naive and static ways and do not differentiate between data transfer protocols. Furthermore, many authors either do not validate the accu-racy of their simulators against authentic traces or report poor results of such evaluations. Last but not least, many contributions are outdated with respect to the recent advances in grid computing infrastructures. The purpose of the sim-ulator proposed in this work is to fill these gaps. In the following paragraphs we describe the most notable grid and cloud computing simulators. We also present performance studies implemented on top of these or custom simulators.
In [4] Buyya et al. present GridSim. The tool models different grid compo-nents in a highly abstract fashion, rendering it not suitable for specialized studies with a focus on networking. In [23] Sulistio et al. extend GridSim with data grid functionality. Concretely, the authors enable data querying, data replication and remote data access. The authors in [3] propose Optorsim in order to enable re-search on dynamic data replication. GangSim [8] allows to implement scheduling and resource allocation policies. It also supports hierarchies of users. However, the authors report large discrepancies between collected metrics in correspond-ing simulated and real world experiments. Alea 2 [17] provides a queue/plan based mechanism for evaluation of different scheduling algorithms. The authors present simulations based on real traces, but do not report on their accuracy. GroudSim [19] is a framework for modeling of scientific workflows, which are executed on combined grid and cloud infrastructures. The toolkit improves the runtime performance of process-based analogues by employing discrete-event simulation. ComBos [1] simulates all components of BOINC, a middleware em-ployed for volunteer and desktop grid computing. A thorough treatment of the network infrastructures is left for the future work. Dobre et al. [7] present the Monarc (MOdels of Networked Analysis at Regional Centers) simulation frame-work, which was developed at CERN for High Energy Physics use-cases. The authors only briefly discuss remote data access, and the demonstrated experi-ments are based on numerous assumptions which are not tested. CloudSim [5] extends GridSim to provide cloud-related functionality. In particular, it enables modeling of virtual machines and analysis of provisioning algorithms with re-spect to Quality of Service parameters and Service Level Agreements. Network-CloudSim [11] introduces different classes of switches (edge, aggregate and root) in order to model the data centers’ local area networks with a higher degree of precision. EdgeNetworkCloudSim [21] further introduces users, service chains and service request processing in the context of edge cloud computing.
The work in [22] presents multilevel hybrid scheduling algorithms based on a dynamic time quantum. These scheduling techniques are evaluated on a dedi-cated simulator. Ishii et al. [15] evaluate the optimization of data access patterns in computing grids on top of a simulator. The authors consider only data replica-tion to local sites. Furthermore, the network dynamics are not addressed in this paper. Camarasu-Pop et al. [6] analyze the effect of application makespan and checkpointing period on Monte Carlo jobs in the European Grid Infrastructure. The authors conduct production experiments in order to evaluate the proposed
analytical model and the simulator. Such extensive study allows to establish ro-bust and realistic results. In our work we ensure the quality of the simulator in an analogous manner. The contribution in [18] describes a 2-phase scheduling approach implemented with Optorsim. In the first step a cluster is selected for job execution based on data access cost. Secondly, a suitable worker from the cluster is chosen based on the task size and the node load. The work in [16] presents HGASA, a hybrid heuristic for optimization of data access patterns in computing grids based on a combination of genetic algorithms and simulated annealing. The optimization is evaluated using GridSim.
3
Empirical Analysis
In this section we analyze certain aspects of the ATLAS data grid, which are relevant for the construction of a realistic simulator. The ATLAS data grid is part of the Worldwide LHC Computing Grid. WLCG employs commodity hardware. Thus, the findings from this section are universally generalizable.
Previous work [2] has shown that the throughput of remote data access can be modeled by the following linear regression:
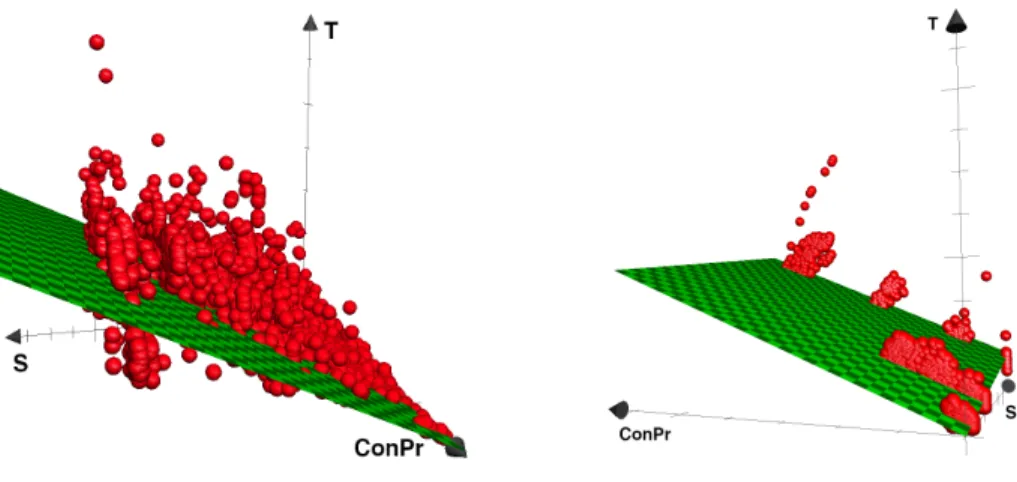
T = 0 + a ∗ S + b ∗ ConT h + c ∗ ConP r. (1) In the above equation T is the transfer time of a file, S is the file size, ConTh is the aggregated link traffic of concurrent threads within a given job and ConPr is the aggregated link traffic of concurrent processes within the investigated computational campaign. The regression coefficients a, b and c characterize the transfer throughput. While a job may start multiple threads to stream different files remotely, when employing data-placement, each file is transferred by an individual process. Thus, we formulate the hypothesis that the throughput of data-placement can be modeled by the following linear regression:
T = 0 + a ∗ S + b ∗ ConP r. (2)
To test this hypothesis, we select two random storage elements from WLCG, namely FZK-LCG2 DATADISK and SLACXRD DATADISK. We then query the Rucio Hadoop cluster for logged metrics on more than 27,000 gsiftp file transfers between these two storage elements in the time window 02/05/2018 -17/05/2018. Through transformations we obtain the values of the variables T, S and ConPr for each file transfer. Finally, we perform the linear regression, which results in the following fit:
T = 0.24045 ∗ S + 0.00044 ∗ ConP r. (3) The fit has an F-statistic of 1.234e+05 on 2 degrees of freedom and 27021 residual degrees of freedom and exhibits a p-value of <2.2e-16. Thus, our hypothesis is confirmed. This proves that the finding about the relationship among the variables generalizes well not only on data from our experiments, but also on
independently collected data. The regression fit is displayed together with the observations in Fig.1.
Next, we experimentally demonstrate that the linear regression from Eq.2 also models the throughput of stage-in transfers. In this experiment we repeat-edly launch 1-12 concurrent jobs on a worker node at the CERN data center (Switzerland) in the time window 08/08/2018 - 10/08/2018. Each job launches a single process in order to stage-in files of different sizes (300MB - 3GB) us-ing the xrdcp protocol. After data collection and transformation the resultus-ing dataset has more than 2,000 observations and exhibits the following fit:
T = 0.036 ∗ S + 0.012 ∗ ConP r. (4)
The fit has an F-statistic of 8392 on 2 degrees of freedom and 2067 residual degrees of freedom and a p-value of <2.2e-16. It is displayed is Fig.2along with the observations.
Fig. 1. Data-placement regression fit Fig. 2. Stage-in regression fit
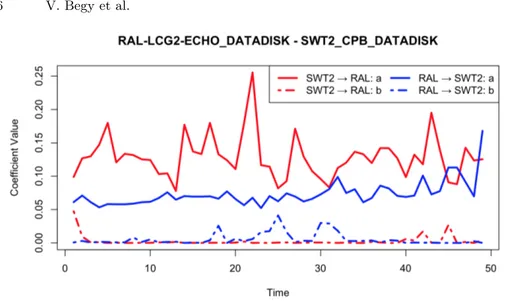
In GDAPS the communication between two hosts occurs through a virtual link. At the current implementation stage we exclusively consider data input. The management of jobs’ output data is neglected. Thus, a bi-directional link is only possible between two storage elements. In order to decide, whether a link between two storage elements needs to be modeled in an uni- or bi-directional manner, we have performed the following analysis. Two random ATLAS storage elements RAL-LCG2-ECHO DATADISK and SWT2 CPB DATADISK are se-lected. Then the Rucio Hadoop cluster is queried for logged metrics on all gsiftp transfers between these two storage elements in the time window 05/12/2018 23:00 - 08/12/2018 00:59. The resulting dataset it partitioned hourly. The linear regression from Eq.2 is applied to each partition. The time series of regression coefficients a and b across all partitions are depicted in Fig.3.
Fig. 3. Time series of regression coefficients a and b with hourly time resolution
Clearly, the coefficients do not exhibit a bi-directional throughput. We assume that this behavior is caused by the fact that the traffic may take different paths over WAN when the source of data in a given host pair is switched. Thus, GDAPS models virtual links in a uni-directional manner.
4
Simulator Architecture
In this work we are focusing on data access patterns in computing grids. Thus, we primarily model and simulate components of data grids related to networking. The simulator is built based on assumptions, which are validated by empirical experiments and observations in the Worldwide LHC Computing Grid at CERN, as demonstrated in Section3.
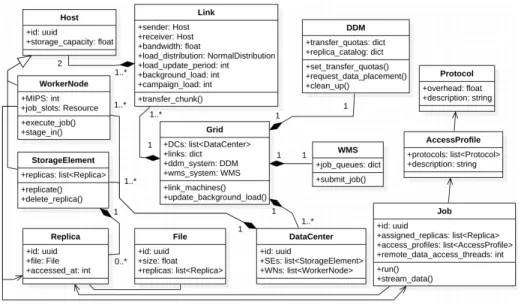
The architecture of GDAPS is presented in Fig.4 by a class diagram. The central components of the simulator and their tasks are as follows. Storage ele-ments persist replicas of files for the long term. Worker nodes execute compu-tational jobs. Their performance is determined by the million instructions per second attribute. Worker nodes may also stage-in data from local storage ele-ments into their scratch disks. Distributed Data Management System (DDM) is responsible for the monitoring of storage elements, enforcement of quotas on data-placement transfers and clean-up of outdated replicas. Workload Manage-ment System (WMS) monitors worker nodes and submits jobs in accordance with the specified resource provisioning policies. A virtual link has a pair of communicating hosts. Its fixed physical bandwidth is fairly allocated among all processes and threads. The latent loads of a link are parameterized by a normal distribution and an update period. Data centers are linked collections of storage elements and worker nodes. They are further aggregated to form the grid. Repli-cas are realizations of files. They are persisted in storage elements and may be
streamed remotely by jobs, staged-in by worker nodes or copied by the DDM. An access profile is characterized by the employed data transfer protocols and the classes of the communicating hosts. A computational job has a list of assigned replicas, which is synchronized with a list of respective access profiles. Within a single job numerous threads may concurrently stream input replicas.
Fig. 4. Class diagram of GDAPS
A virtual connection between two hosts can be modeled with various degrees of abstraction. Many factors affect the data throughput of such connections, among others: amount of concurrent data flows passing through a congested router; configuration of routers (buffer settings, packet scheduling policies, . . . ); characteristics of data transfer protocols (stateful or stateless, congestion con-trol, . . . ); a single protocol may have differing implementations across various operating systems; bandwidths, latencies and highly dynamic loads of all links across the communication path; performance of hosts’ network interface cards. In practice, it is not possible to model communication links of a data grid with this extreme degree of precision. The mentioned low-level metrics are typically not centrally accessible. Thus, following the end-to-end arguments in system design [20] we base our modeling on metrics obtainable through experiments ex-ecuted in the application layer. A link in GDAPS transfers data in small chunks. Each chunk is transferred during a single simulation tick, which abstracts a sec-ond. A link allocates its physical bandwidth equally to all concurrent processes. The processes originate either from a simulated bag of jobs, or an unknown background load. The background load is parameterized by a normal distribu-tion and an update period. It is able to encapsulate all latent processes affecting
the link throughput. Once per the update period a new value for the background load attribute is sampled from the respective distribution. A computational pro-cess fairly divides the allocated bandwidth among its threads. Finally, a small fraction of the chunk is neglected due to the coordination overhead of the data transfer protocol. This mechanism is summarized by the following code snippet: c h u n k = ( l i n k . b a n d w i d t h / ( l i n k . b a c k g r o u n d _ l o a d + l i n k .
c a m p a i g n _ l o a d ) ) / job . n _ t h r e a d s c h u n k -= c h u n k * p r o t o c o l . o v e r h e a d
5
Accuracy of the Simulator
To demonstrate the accuracy of the proposed tool we simulate a production work-load. The structure of the authentic workload is as follows. Various amounts of concurrent jobs (1-12) are assigned to a single worker node at the CERN data center (Switzerland). Once per 15 minutes in the period of 28.04.2018 00:00 -28.04.2018 06:15 the jobs initiate remote accesses to the storage element GRIF-LPNHE SCRATCHDISK at the GRIF-GRIF-LPNHE data center (France). The data transfer is realized by the WebDAV protocol. At each step the jobs launch various amounts of concurrent threads (up to 4). The threads stream files of different sizes (300MB - 3GB). This allows us to sample a wide range of data for the variables T, S, ConTh and ConPr. Each launched file access is treated as an observation in the final dataset. After such sampling and transformations we de-rive 106 authentic observations. We then simulate the same workload in GDAPS, logging 106 simulated observations. Thereafter, we apply the linear regression from Eq.1to both the datasets. The true dataset is summarized by the following fit:
T = 0.02385 ∗ S + 0.04886 ∗ ConT h + 0.00117 ∗ ConP r. (5) The true fit has an F-statistic of 1.956e+04 on 3 degrees of freedom and 103 residual degrees of freedom and a p-value of <2.2e-16. The regression coefficients of this fit characterize the data throughput of the production workload. We assess the accuracy of the simulated coefficients based on the following error metric:
E(coefsim) = abs(coeftrue− coefsim)/coeftrue. (6)
However, the following issue needs to be addressed before stochastic simulations can be executed. The simulator parameters have to be calibrated with respect to the true system. In our study this concerns the parameters of the data transfer mechanism. While we could estimate the link bandwidth to be 10,000 Mbps, quantifying the protocol overhead or determining the parameters (µ and σ) of the background load distribution are non-trivial tasks. These 3 parameters form the simulator setting θ, which needs to be inferred:
θ = overhead µ σ . (7)
The inference procedure will rely on true observations xtrue, which are the
re-gression coefficients of the authentic fit:
xtrue= atrue btrue ctrue = 0.02385 0.04886 0.00117 . (8)
The Bayes’ rule allows one to calculate the posterior distribution p(θ | x) ana-lytically. However, in our study neither the likelihood p(x | θ), nor the marginal p(x) are tractable. A further difficulty lies in the fact that our generative model, which produces simulated observations xsimis a non-differentiable simulator. To
estimate the posterior in this setting we employ likelihood-free Markov Chain Monte Carlo with approximate likelihood ratios [13,14]. In this method, a param-eterized classifier is trained to distinguish samples from the marginal p(x) and the likelihood p(x | θ). The classifier’s output is then used to construct likelihood ratios r(x, θt, θ0) across different parameter settings, which represent the states
of the Markov Chain. The likelihood ratios are in turn employed by MCMC to either accept a proposed state θ0or once again sample the current state θt. Once
the sampling is completed, the histograms over the chain’s states approximate the posterior density p(θ | x).
We realize the parameterized classifier by a deep neural network with 4 hid-den layers, 128 hidhid-den units and SELU nonlinearities. For each simulator param-eter we have assumed a uniform prior distribution with the following bounds:
– WebDAV overhead: (0, 0.1)
– µ, the mean of the background load distribution: (0, 100)
– σ, the standard deviation of the background load distribution: (0, 100) Given these priors we have pre-simulated more than 12.7 million of (θ, xsim
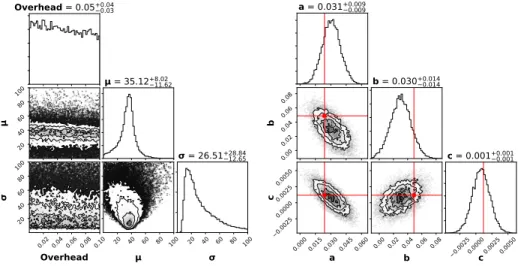
)-tuples, which form the training set. The dataset is projected onto the inter-val (0,1) to stabilize the training. The net is trained for 263 epochs using the ADAM optimization algorithm with a learning rate of 0.0001. Once the classi-fier is trained, we start the posterior MCMC sampling in the middle of the prior bounds. Firstly, we sample 100,000 burn-in states in order to reach a stable region in the parameter space. Thereafter, we collect 1,000,000 actual MCMC samples. The histograms of the resulting Markov Chain approximate the multivariate posterior density. These histograms are presented along with their covariances by a cornerplot in Fig. 5. The 0.5 quantile is reported above each histogram. While the density of the overhead parameter is almost uniform, clear modes are identified for µ and σ. Given this approximate posterior, we pick the optimal simulator setting θ∗ which maximizes the density along each axis:
θ∗= overhead∗ µ∗ σ∗ = 0.02 36.9 14.4 . (9)
Employing the optimal parameter setting θ∗ we execute 16,000 stochastic sim-ulations of the production workload. At the end of each simulation we regress
the produced dataset the same way as the authentic dataset. The simulated co-efficients are accumulated to form samples. The histograms of these samples are shown along with their covariances in Fig.6. The 0.5 quantile is indicated above each histogram. The values of the true coefficients are superimposed in red.
Overhead = 0.05+0.040.03 20 40 60 80 100 = 35.12 +8.0211.62 0.02 0.04 0.06 0.08 0.10 Overhead 20 40 60 80 100 20 40 60 80 100 20 40 60 80 100 = 26.51+28.8412.65
Fig. 5. Approximate posterior density over the simulator setting θ
a = 0.031+0.0090.009 0.00 0.02 0.04 0.06 0.08 b b = 0.030+0.0140.014 0.000 0.015 0.030 0.045 0.060 a 0.0025 0.0000 0.0025 0.0050 c 0.00 0.02 0.04 0.06 0.08 b 0.00250.0000 0.0025 0.0050c c = 0.001+0.0010.001
Fig. 6. Coefficients simulated under the optimal parameter setting θ∗
Since the distributions of the simulated coefficients recover the true coefficients, we conclude that the likelihood-free MCMC has succeeded in calibrating the simulator parameters. Based on our experience, the naive picking of random parameter settings is unable to perform this task. Thus, it is evident that GDAPS executes highly realistic simulations. A number of concrete tuples of simulated coefficients are presented in Table1along with the respective errors. The errors are calculated using the metric from Eq. 6.
Table 1. Example simulated coefficients
asim E(asim) bsim E(bsim) csim E(csim) P E
0.02352 1.4% 0.049 0.3% 0.00114 3.3% 5% 0.02427 1.7% 0.05038 3.1% 0.00118 0.4% 5.2% 0.02408 0.9% 0.05006 2.5% 0.00121 3.1% 6.5% 0.02477 3.8% 0.04810 1.6% 0.001206 2.8% 8.2% 0.02458 3% 0.04668 4.5% 0.00116 0.7% 8.2% 0.02467 3.4% 0.04693 4% 0.001185 1% 8.4% 0.02538 6.4% 0.04854 0.7% 0.00115 2% 9.1% 0.02298 3.6% 0.05121 4.8% 0.00118 0.8% 9.2%
6
Conclusions and Future Work
In this paper we have presented a novel grid computing simulator. GDAPS allows one to model and simulate data access profiles of computing jobs in data-intensive systems. The fundamental assumptions underlying the construction of our simulator are justified by empirical experiments performed in the Worldwide LHC Computing Grid.
To study the accuracy of the simulations produced by our tool we have executed an authentic production workload from WLCG. Prior to the simula-tions we have successfully calibrated the simulator parameters with respect to the true system. The calibration relied on approximate Bayesian inference with likelihood-free Markov Chain Monte Carlo. It allowed us to obtain the approxi-mate posterior density over a set of simulator parameters, which affect the data transfer mechanism. Given the optimal parameter setting θ∗, the distributions of the simulated regression coefficients were able to recover the true coefficients. The future work will confront the thorough modeling of the ATLAS data grid in GDAPS. Thereafter, we will perform evolutionary optimization of data access patterns in bags of jobs with the objective to minimize the joint data transfer time. This constitutes a constrained optimization problem. The fitness of proposed solutions will be evaluated on top of GDAPS, since we can rely on its accuracy. Lastly, we will extend the simulator with further functionality, such as management of jobs’ output data, support for more resource provisioning algorithms and virtual organizations.
References
1. Alonso-Monsalve, S., Garc´ıa-Carballeira, F., Calder´on, A.: Combos: A complete simulator of volunteer computing and desktop grids. Simulation Modelling Practice and Theory 77, 197 – 211 (2017)
2. Begy, V., Barisits, M.S., Lassnig, M.: Forecasting Model for Network Throughput of Remote Data Access in Computing Grids. Tech. Rep. ATL-SOFT-PROC-2018-001, CERN, Geneva (Jun 2018),https://cds.cern.ch/record/2621616
3. Bell, W.H., Cameron, D.G., Millar, A.P., Capozza, L., Stockinger, K., Zini, F.: Optorsim: A grid simulator for studying dynamic data replication strategies. The International Journal of High Performance Computing Applications 17(4), 403– 416 (2003)
4. Buyya, R., Murshed, M.: Gridsim: a toolkit for the modeling and simulation of distributed resource management and scheduling for grid computing. Concurrency and Computation: Practice and Experience 14(13-15), 1175–1220 (2002)
5. Calheiros, R.N., Ranjan, R., Beloglazov, A., De Rose, C.A.F., Buyya, R.: Cloudsim: a toolkit for modeling and simulation of cloud computing environments and evalua-tion of resource provisioning algorithms. Software: Practice and Experience 41(1), 23–50 (2011)
6. Camarasu-Pop, S., Glatard, T., Benoit-Cattin, H.: Combining analytical modeling, realistic simulation and real experimentation for the optimization of monte-carlo applications on the european grid infrastructure. Future Generation Computer Systems 57, 13 – 23 (2016)
7. Dobre, C., Stratan, C.: MONARC Simulation Framework. arXiv e-prints arXiv:1106.5158 (Jun 2011)
8. Dumitrescu, C.L., Foster, I.: Gangsim: a simulator for grid scheduling studies. In: CCGrid 2005. IEEE International Symposium on Cluster Computing and the Grid, 2005. vol. 2, pp. 1151–1158 Vol. 2 (May 2005)
9. Elmsheuser, J., Walker, R., Serfon, C., Garonne, V., Blunier, S., Lavorini, V., Nilsson, P.: New data access with HTTP/WebDAV in the ATLAS experiment. Journal of Physics: Conference Series 664(4), 042014 (dec 2015)
10. Foster, I., Kesselman, C.: The Grid 2: Blueprint for a New Computing Infrastruc-ture. The Elsevier Series in Grid Computing, Elsevier Science (2003)
11. Garg, S.K., Buyya, R.: Networkcloudsim: Modelling parallel applications in cloud simulations. In: 2011 Fourth IEEE International Conference on Utility and Cloud Computing. pp. 105–113 (Dec 2011)
12. Garonne, V., Vigne, R., Stewart, G., Barisits, M., Beermann, T., Lassnig, M., Serfon, C., Goossens, L., and, A.N.: Rucio – the next generation of large scale distributed system for ATLAS data management. Journal of Physics: Conference Series 513(4), 042021 (jun 2014)
13. Hermans, J., Begy, V.: Hypothesis. https://github.com/montefiore-ai/hypothesis (2019)
14. Hermans, J., Begy, V., Louppe, G.: Likelihood-free MCMC with Approximate Likelihood Ratios. arXiv e-prints arXiv:1903.04057 (Mar 2019)
15. Ishii, R., de Mello, R.: An adaptive and historical approach to optimize data access in grid computing environments. INFOCOMP 10(2), 26–43 (2011)
16. Kingsy Grace, R., Manimegalai, R.: Hgasa: An efficient hybrid technique for op-timizing data access in dynamic data grid. In: Bjørner, N., Prasad, S., Parida, L. (eds.) Distributed Computing and Internet Technology. pp. 132–136. Springer International Publishing, Cham (2016)
17. Klus´aˇcek, D., Rudov´a, H.: Alea 2: Job scheduling simulator. In: Proceedings of the 3rd International ICST Conference on Simulation Tools and Techniques. pp. 61:1– 61:10. SIMUTools ’10, ICST (Institute for Computer Sciences, Social-Informatics and Telecommunications Engineering), ICST, Brussels, Belgium, Belgium (2010) 18. Moghadam, M.H., Babamir, S.M.: A new data-intensive task scheduling in
optor-sim, an open source grid simulator. In: 2016 2nd International Conference on Open Source Software Computing (OSSCOM). pp. 1–6 (Dec 2016)
19. Ostermann, S., Plankensteiner, K., Prodan, R., Fahringer, T.: Groudsim: An event-based simulation framework for computational grids and clouds. In: Guarracino, M.R., Vivien, F., Tr¨aff, J.L., Cannatoro, M., Danelutto, M., Hast, A., Perla, F., Kn¨upfer, A., Di Martino, B., Alexander, M. (eds.) Euro-Par 2010 Parallel Pro-cessing Workshops. pp. 305–313. Springer Berlin Heidelberg, Berlin, Heidelberg (2011)
20. Saltzer, J.H., Reed, D.P., Clark, D.D.: End-to-end arguments in system design. ACM Trans. Comput. Syst. 2(4), 277–288 (Nov 1984)
21. Seufert, M., Kwam, B.K., Wamser, F., Tran-Gia, P.: Edgenetworkcloudsim: Place-ment of service chains in edge clouds using networkcloudsim. In: 2017 IEEE Con-ference on Network Softwarization (NetSoft). pp. 1–6 (July 2017)
22. Shah, S.N.M., Mahmood, A.K.B., Oxley, A.: Dynamic multilevel hybrid scheduling algorithms for grid computing. Procedia Computer Science 4, 402 – 411 (2011), proceedings of the International Conference on Computational Science, ICCS 2011 23. Sulistio, A., Cibej, U., Venugopal, S., Robic, B., Buyya, R.: A toolkit for modelling and simulating data grids: an extension to gridsim. Concurrency and Computation: Practice and Experience 20(13), 1591–1609 (2008)
24. Yuan, D., Yang, Y., Liu, X., Chen, J.: A data placement strategy in scientific cloud workflows. Future Generation Computer Systems 26(8), 1200 – 1214 (2010)