Standardized settling cell to characterize liquid-liquid dispersion
9
0
0
Texte intégral
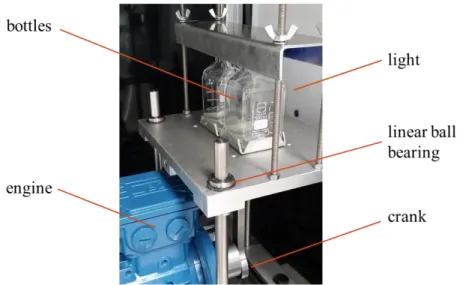
(2) ISEC 2017 - The 21st International Solvent Extraction Conferenc e. is connected to a thermostatic bath. The temperature is set to 20°C. The cell is illuminated from behind with a LED panel. The vessel is filled from the top with the two-phase system using a funnel. The volumetric phase ratio is easily read from a scale placed at one side of the vessel. After the cell has been filled, the stirrers are turned on for 30 s at 800 RPM for generating the dispersion. Once the dispersion is created, the separation can be studied in the same vessel. Alternatively the dispersion can be transferred into a second vessel, placed below the first one, via opening a valve. Internals can be placed in this vessel in order to evaluate their effect on the settling behavior. The experiment is finished when half of the interface is covered by a monolayer of drops, which is the so-called settling time. This definition has been introduced by Henschke to ensure reproducible results, since alternatively waiting until the last drop has coalesced would lead to large scatter due to the stochastic nature of individual coalescence events. This evaluation method is called visual method in the following. To determine this settling time, a top view of the interface is necessary. At the same time a video recording from the front allows quantitative evaluation of sedimentation and coalescence curve.. Figure 1. The stirred Henschke settling cell 2.2 Shaking settling cell The second settling cell was developed at the University of Berlin and is described by Villwock [3]. It has also been used at TU Kaiserslautern. An identical equipment was built in Liège to perform this study, presented in figure 2. Two bottles of 100 ml each are filled with the two-phase system with the identical phase ratio in order to control the repeatability of the experiments. For a practical reason, the flasks are filled with 75 ml of the system which corresponds to the volume to reach the bottle neck. If the bottles were filled above that, the reduction of the bottle diameter in the region of the neck would need to be taken into account in the evaluation of the separation. The two bottles are firmly mounted on a shaking table, which is connected to an electrical motor drive with a rod, which induces a vertical motion of the bottles. The bottles are illuminated from behind with a LED panel. To create the dispersion, the bottles are shaken for 5 s at 650 RPM.. - 242 -.
(3) ISEC 2017 - The 21st International Solvent Extraction Conferenc e. Pictures are then taken in front view of the bottles during the settling experiment at specific times. For the quantitative evaluation of these photos, for each picture of the experiment, an area of interest is selected by the user. For the numerical evaluation, the averaged grey levels of both phases are compared to those of the last picture within this area of interest, resulting in a measure of the difference in grey-scale, which decreases over time. A threshold is set by the user for both phases, which defines when sufficiently clear phases are obtained and the settling time is thus reached. An efficient routine facilitating this quantitative evaluation was written in MATLAB, which requires that the video is uploaded, converted, and then treated with the program. This evaluation method is called the numerical method in the following.. Figure 2. Shaking settling cell 2.3 Chemicals The chemicals used during experiments are paraffin oil, water, and salt. The paraffin oil is provided by Fauth + Co.KG and has the reference FC2006 (batch number: 64200048). The water used was deionized water directly produced with a deionization cartridge. The salt used was sodium chloride, supplied by VWR (batch number: 12K220010). The presence of electrolytes in liquid-liquid dispersions influences their separation as shown by Soika [4] and Schwerin [5]. Thus, sodium chloride was added for the experiments for stabilizing separation performance at a concentration of 50 mmol/L in the aqueous phase. Both equilibrium phases were analyzed to determine their density and viscosity with the equipment DSA 5000M combined with Lovis 2000ME of Anton Paar, Graz, Austria. The results are shown in table 1. Table 1. Density and viscosity of the saturated phases 20°C. 25°C. density (kg/m³). 822.913. 819.597. viscosity (mPas). 10.06. 8.48. density (kg/m³). 1000.237. 999.041. viscosity (mPas). 1.030. 0.924. - 243 -.
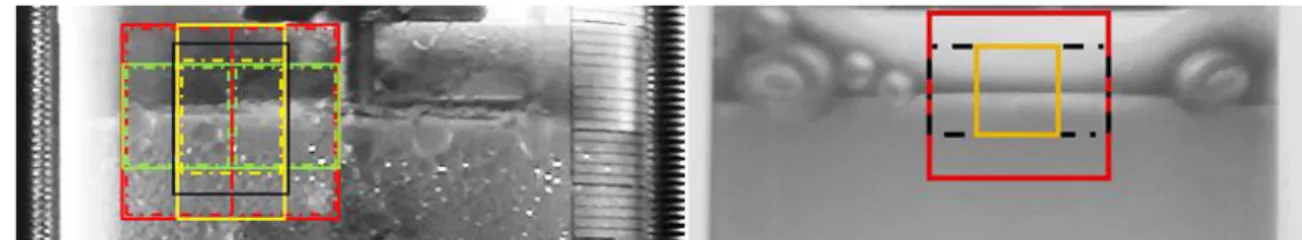
(4) ISEC 2017 - The 21st International Solvent Extraction Conferenc e. 2.4 Methods Based on the description of both equipment and the evaluation methods, differences can be pointed out which need to be investigated in order to characterize their effect on the results of settling experiment. 2.4.1 Settling time evaluation Two different criteria are used to evaluate the settling time, namely the numerical and the visual method described above. The former requires a front view of the settling cell and the latter a top view of the interface. The numerical criterion used to evaluate settling time depends on three parameters: the area of interest, the grey level thresholds for the upper phase as well as that for the lower phase. The sensitivity with respect to these parameters needs to be investigated, the corresponding settling time will then be compared to the one evaluated with the visual criterion for both cells. Different areas of interest (AOI) are tested as represented schematically for both cells in figure 3. The AOIs for the Henschke cell are located between two stirrers to exclude their influence on the evaluation. Nine AOIs are tested. Concerning the shaking cell, AOIs are more restricted due to the presence of the meniscus, so that only three are tested. The thresholds tested will vary between 8 and 12% for the upper phase and 2 and 5% for the lower phase.. Figure 3. Representation of the different areas of interest (AOI) for both equipments 2.4.2 Air exchange with the environment The air exchange with the environment is an important parameter influencing the behavior of the separation. It has been observed in previous studies that prolonged air contact can influence the settling behavior significantly, where it has been speculated that this may be due to evaporation of lightboiling fractions of paraffin oil or to dissolution of carbon dioxide leading to a shift in ionic composition in the aqueous phase. The Henschke cell is an open system, while the bottles used with the shaking apparatus must be well closed. In order to investigate the effect of the air exchange on the separation, the bottles of the shaking cell are opened during several hours between two settling experiments. 2.4.3 Dispersion generation Different speeds and mixing durations are tested. A sensitivity study on these parameters is conducted. The shaking speed varies from 400 to 650 min-1 and the shaking time from 5 to 90 s. The stirring speed varies between 500 and 1000 min-1 with a mixing time from 5 s to 1 min. The purpose of this variation is to define the experimental parameters ensuring that the system is well mixed but no stable emulsion formed.. - 244 -.
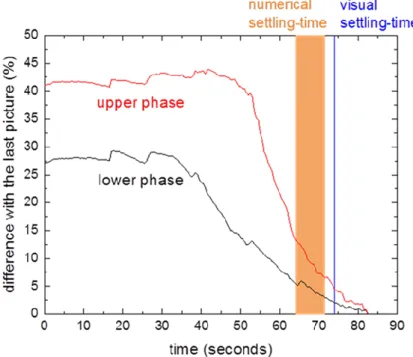
(5) ISEC 2017 - The 21st International Solvent Extraction Conferenc e. 2.4.4 Studied volume The Henschke-cell volume is more than 10 times bigger than the volume used in the shakingcell bottles. Bottles of 1 L will thus be tested with the shaking-cell apparatus. The mixing protocol of the Henschke cell will be applied to different beakers of different diameters. Another difference is the air fraction in the cell which influences the studied volume. The Henschke cell can be filled up to 100%, i.e. without any air in the stirred volume. This is not possible for the shaking cell for two reasons. First, the neck-shaped bottle doesn’t allow a filling more than 75 ml as explained in section 2.2. Secondly, air must be present to allow efficient dispersion of the two-phase system. The presence of air on the other hand induces the formation of gas bubbles in the dispersion. Different fraction of air volume are tested for both equipments in order to evaluate the effect. A difference of air volume implies a different dispersion height between the experiments. It means that the time needed for the drops too complete sedimentation is shorter, which implies a shorter settling time. 3. Results and Discussion 3.1 Settling time evaluation For an identical experiment with the Henschke cell, the numerical evaluation method applied to photos taken during the experiment is compared to the visual criterion. The results of this comparison are shown in table 2. In order to characterize the statistical error for the settling time evaluated, each settling experiment is conducted three times. The choice of the AOI and of the thresholds does not affect significantly the settling time. In addition, the visual criterion gives similar results compare to the numerical method. Table 2. Influence of the parameters of the numerical methods in comparison with the visual criterion for the Henschke cell settling time different areas of interest (AOI). 63 to 74 s. different threshold. 64 to 71 s. visual criterion. 70 to 77 s. Figure 4 presents the evolution of the difference of the averaged grey scale for the upper and lower phase with respect to the final value over time of one settling experiment performed with the Henschke cell. The evolution of the curves shows a slow but relatively steady decrease of the integrated grey-scale difference over time, where it is obvious that a change of the threshold defining the end of settling will automatically lead to a change of several seconds for the resulting settling time, as indicated in table 2. Both evaluation methods thus lead to settling times in a narrow range as long as the thresholds are fixed to reasonable values, which is less than 12% for the upper phase and less than 5% for the lower phase. The same analysis is performed with the shaking cell, where the method for dispersion generation is different as described above. The results are shown in table 3. The visual criterion is applied to both bottles which gives the same settling time.. - 245 -.
(6) ISEC 2017 - The 21st International Solvent Extraction Conferenc e. Figure 4. Evolution of the difference of the averaged grey scale for the upper and lower phase Table 3. Influence of the parameters of the numerical methods in comparison with the visual criterion for the shaking cell settling time different areas of interest (AOI). 196-200 sec. different threshold. 196-207 sec. visual criteria. 120 sec. It turns out that the choice of the AOI is less important for the shaking cell as compared to the Henschke cell. But even for the Henschke cell, the variation is relatively small. Overall, a change of the threshold values leads to variations in the same range for both equipment. However, the visual criterion results in a significantly differing settling time for the shaking cells because of wall effects of the small bottles. When the interface at the center of the bottles is already cleared of drops, leading to the visual criterion being reached, there are still drops at the wall of the bottles, which strongly influence the numerical evaluation of the settling time. Looking only at the front view of the bottles thus results in misleading data. The visual criterion also has the advantage that it allows to directly measure the settling time “in situ” unlike the numerical evaluation, for which the video needs first to be uploaded and treated with the corresponding MATLAB software. It has to be noted that the visual criterion was applied for all following experiments performed in this study. 3.2 Air exchange with the environment The air exchange between the system and the environment has a strong influence on the settling behavior as shown in table 4, which compares the settling time between a first closed bottle and second bottle which is opened during 2 hours between two shaking experiments.. - 246 -.
(7) ISEC 2017 - The 21st International Solvent Extraction Conferenc e. Table 4. Influence of the air exchange performed on the shaking cell by opening one bottle between two settling experiments settling time closed bottle. 170 sec. bottle open during 2 hours. 320 sec. Concerning the Henschke cell, the deviation observed for the settling time doesn’t exceed 3% after a delay of 2 hours. The comparison with the shaking cell results presented in table 4 illustrates the stability of the Henschke cell against the air exchange as opposed to the behavior of the shaking cell. 3.3 Dispersion generation Different mixing times and mixing speeds have been tested with the two settling apparatus. The corresponding settling-time results are presented in figure 5. For slow and short stirring or shaking, below 5 seconds of mixing, the dispersion is not properly generated and experimental settling times are too short. As both parameters are increased, a plateau is reached, within which the settling times remain relatively stable. The plateau of the Henschke-cell data is illustrated by the blue area in the graph. Within this relatively large parameter region the settling time is stable with respect to the mixing parameters. The situation is different for the shaking cell. The red triangle shows the data where the settling time does not vary, the region is significantly more restricted than the Henschke cell. Beyond the triangle, the operational conditions lead to dispersions, which take extremely long to separate or where the settling time cannot be determined because of an excess of very fine drops generated, which impedes visual and numerical evaluation. This infeasible region is indicated by the red area at the top of the graph. The plateau corresponding to the Henschke cell demonstrates that the mixing parameters do not influence the dispersion characteristic in this region, e.g. drop size distribution, while the two-phase system is well mixed.. Figure 5. Evolution of the settling time with the the mixing time and the mixing speed. - 247 -.
(8) ISEC 2017 - The 21st International Solvent Extraction Conferenc e. 3.4 Studied volume Different dispersion volumes are tested in order to evaluate the effect of air fraction in the dispersion container on the settling behavior. The results are shown in table 5. As a different filling height implies a different settling time, the experiments with low filling height are predicted with the experimental data of the experiment with high filling height in order to compare the results. The sedimentation and coalescence models are fitted to the experimental sedimentation and coalescence curves of the experiment with high filling height [4]. These parameters are then used to predict the settling behavior for the experiment with low filling height. Table 5. Air fraction influence on the settling time Henschke cell (600 shaking cell (420 min-1, 30 s) min-1, 15 sec) 800 ml. 600 ml. 75 ml. 60 ml. settling time evaluated visually in s. 245. 238. 180. 160. settling time based on fitted models in s. 232. 225. 190. 168. prediction of the settling time based on the experiment high filling height in s. 213. 164. The first conclusion is that the visual criterion is in agreement with the settling time evaluated with the fitted settling curves. The predicted settling time of the low height experiment is consistent with the settling time evaluated with the fitted models for both apparatus. It proves that the air fraction does not significantly influence the settling behavior. 4. Conclusion and perspectives The parameters investigated in this study show significant differences between the two settling cells. First, significant wall effects are observed with the shaking cell, which are responsible for a significant difference between the settling-time evaluation methods. This effect can of course also occur with the Henschke cell. Thus the visual criterion is generally recommended for evaluation of settling time. Secondly, The Henschke cell shows stability against the air exchange and the mixing parameters, e.g. the mixing time and the mixing speed. The last observed parameter, the air fraction in the cell does not seem to influence the settling behavior for both cells. As a general observation, the dispersion studied in the Henschke cell shows a settling behavior more independent of the operational conditions as compared to the shaking cell. As a perspective, the last difference, related to the dispersion volume, will be compared between the two apparatus in order to confirm the first conclusion of this study. The design of the resulting optimized settling cell will be presented during the ISEC 2017 conference.. - 248 -.
(9) ISEC 2017 - The 21st International Solvent Extraction Conferenc e. Acknowledgement The project is supported by the Federal Ministry for Economic Affairs and Energy of Germany, project number: 01168585/1.. 1) 2) 3) 4) 5) 6). References M. Henschke, L.H. Schlieper, A. Pfennig, Chem Eng. J., 85(2-3), 369-378 (2002). L. Schlieper, M. Chatterjee, M. Henschke, A. Pfennig, AIChE J., 50(4), 802-811, (2004). J. Villwock, F. Gebauer, J. Kamp, H.-J. Bart, M. Kraume, Chem. Ing. Tech. 37(7), 1-10 (2014). M. Soika, A. Pfennig, Chem. Ing. Tech., 77(7), 905-911 (2005). A. Schwerin, A. Pfennig, Ind. Eng. Chem. Res., 37, 3180-3188 (1998). N. Kopriwa, A. Pfennig, Solvent Extr Ion Exc, 34, 622-642 (2016).. - 249 -.
(10)
Figure

+3


Documents relatifs
amount of expression variability that is not explained by the mean; an individual will refer to a human person; variation will refer to differences of a given scalar value, for
Within only 800 ns, the Jet Trigger algorithm found local energy maxima in the calorimeter, summed their immediate neighbors, sorted the resulting jets by energy, and
The principle of the Bayesian experiment design is to make sequentially a choice of candidates (phantoms) that allows us to reduce the variance of the WBSAR95
Because the protein hydrolysate samples were in different galenic forms (liquid, powder, concentrate), their peptide contents were deter- mined beforehand to analyze LMW
Downes will describe major aspects of the personal learning environment being developed by his Learning and Performance support Systems research program, which is funded by
We provide an original measure of the foam shear modulus and of the plastic threshold, and show that a simple model of elasto-plastic material allows to predict the scaling
We present a detailed analysis of the convergence properties of the finite cell method which is a fictitious domain approach based on high order finite elements.. It is proved
A couple of algorithmic procedures for the estimation of ridges from the modulus of the (continuous) wavelet transform of one-dimensional signals are described, together with a
