HAL Id: hal-02995698
https://hal.archives-ouvertes.fr/hal-02995698
Submitted on 17 Nov 2020
HAL is a multi-disciplinary open access
archive for the deposit and dissemination of sci-entific research documents, whether they are pub-lished or not. The documents may come from teaching and research institutions in France or abroad, or from public or private research centers.
L’archive ouverte pluridisciplinaire HAL, est destinée au dépôt et à la diffusion de documents scientifiques de niveau recherche, publiés ou non, émanant des établissements d’enseignement et de recherche français ou étrangers, des laboratoires publics ou privés.
Computer models of saliency alone fail to predict
subjective visual attention to landmarks during observed
navigation
Demet Yesiltepe, Ayse Ozbil Torun, Antoine Coutrot, Michael Hornberger,
Hugo Spiers, Ruth Conroy Dalton
To cite this version:
Demet Yesiltepe, Ayse Ozbil Torun, Antoine Coutrot, Michael Hornberger, Hugo Spiers, et al.. Computer models of saliency alone fail to predict subjective visual attention to landmarks dur-ing observed navigation. Spatial Cognition and Computation, Taylor & Francis, 2020, pp.1 - 28. �10.1080/13875868.2020.1830993�. �hal-02995698�
Computer models of saliency alone fail to predict subjective
visual attention to landmarks during observed navigation
Demet Yesiltepea, Ayse Ozbil Toruna, Antoine Coutrotb, Michael Hornbergerc, Hugo Spiersd, and Ruth Conroy Daltone
aDepartment of Architecture, Northumbria University, Newcastle Upon Tyne, UK; bCNRS, Laboratoire des Sciences du Numérique de Nantes, University of Nantes, Nantes, France; cNorwich Medical School, University of East Anglia, Norwich, UK; dDepartment of Experimental Psychology, University College London, London, UK; eDepartment of Architecture, University of Lancaster, Lancaster, UK
ABSTRACT
This study aimed to understand whether or not computer mod-els of saliency could explain landmark saliency. An online survey was conducted and participants were asked to watch videos from a spatial navigation video game (Sea Hero Quest). Participants were asked to pay attention to the environments within which the boat was moving and to rate the perceived saliency of each landmark. In addition, state-of-the-art computer saliency models were used to objectively quantify landmark saliency. No significant relationship was found between objec-tive and subjecobjec-tive saliency measures. This indicates that during passive observation of an environment while being navigated, current automated models of saliency fail to predict subjective reports of visual attention to landmarks.
KEYWORDS
Landmarks; saliency; object recognition; spatial knowledge; virtual environments
1. Introduction
It has been shown that landmarks play an important role in spatial knowledge. Siegel and White (1975) defined route, survey and landmark knowledge and they argued that spatial knowledge starts with learning landmarks and the routes consecutively, and finally it is completed with the survey knowledge. In a recent study, Montello (1998) mentioned that there is no stage at which only pure landmark or route knowledge exists. He stated that as familiarity increases, the quantity and completeness of spatial knowledge also increase. Hence, he focused on the idea that most of the steps within spatial acquisition process occur in parallel, rather than sequentially. In another study, research-ers found that people can acquire route or survey knowledge as soon as they explore an environment (Ishikawa & Montello, 2006). Therefore, landmarks are important components of spatial knowledge. Knowing the exact locations of landmarks help people orient themselves in an environment and under-stand whether the followed path is correct (Michon & Denis, 2001; Philbeck &
CONTACT Demet Yesiltepe [email protected] Department of Architecture, Northumbria University, Newcastle Upon Tyne NE1 8ST, UK
© 2020 Taylor & Francis
O’Leary, 2005). Hence, landmarks are important for effective route learning (Taluka & Wilson, 1994) and decision-making (Golledge, 1999).
The location of landmarks has been discussed by various studies using landmarks at decision points, on route or off route(Cliburn, Winlock, Rilea & Van Donsel, 2007; Klippel & Winter, 2005; Lovelace, Hegarty & Montello,
1999; Miller & Carlson, 2011; Schwering, Li & Anacta, 2013) whereas the visibility of landmarks has been discussed considering “global” and “local” landmarks (Castelli, Latini Corazzini & Geminiani, 2008; Evans, Skorpanich, Bryant & Bresolin, 1984; Kaplan, 1976; Meilinger, Schulte-Pelkum, Frankenstein, Berger & Bülthoff, 2015; Ruddle, Volkova, Mohler & Bülthoff,
2011; Steck & Mallot, 2000). Similarly, saliency of landmarks has also been investigated by various studies (Caduff & Timpf, 2008; Klippel & Winter, 2005; Richter & Winter, 2014; Sorrows & Hirtle, 1999). The current study aims to understand what makes a landmark visually salient for people and whether or not the predictions of saliency models correlate with people’s saliency evaluations.
2. Background
2.1. Landmark saliency
Winter, Tomko, Elias and Sester (2008) stated that salient features are defined as landmarks. This indicates that if an object is more salient than others, it is more likely to be remembered (Cenani, Arentze & Timmermans, 2017) or used by people for navigation, orientation, and learning purposes. One of the most significant saliency categorization was developed by Sorrows and Hirtle (1999): they described three types of landmarks: visual, cognitive and struc-tural landmarks. Visual landmarks can be distinguished based on their physi-cal characteristics such as size, shape or color. Cognitive landmarks are more personal; they have a cultural or historical meaning so that even if an object does not have any visual attractiveness it can still be used by an observer to define a destination or to way-find. A structural landmark is about the location of objects in an environment. Various studies argue that if an object is highly accessible (for instance if an object is located at a decision point (Burnett, Smith & May, 2001; Cenani et al., 2017; Evans, Smith & Pezdek, 1982; Lynch,
1960; Miller & Carlson, 2011)), then the object is more likely to be used as a landmark. For instance, Burnett et al. (2001) defined characteristics of preferred landmarks for navigation and they mentioned that landmarks would be more useful if they are located close to decision points. In another study, researchers used en-route landmarks, off-route landmarks, decision- point landmarks and street facades and they observed that landmarks located at a decision point are more likely to be recognized (Cenani et al., 2017). The saliency definition was improved by Caduff and Timpf (2008) as they
mentioned that Sorrows and Hirtle’s method was unable to characterize land-marks quantitatively. They defined perceptual, cognitive and contextual sal-ience and offered measures to analyze them. Nothegger, Winter and Raubal (2004) added the concept of visibility to this definition and more recently Von Stülpnagel and Frankenstein (2015) referred to configurational salience, which is related to Space Syntax1 visibility graph analysis (VGA).
The effect of different saliency measures on wayfinding was also discussed in previous papers. Several studies discussed the visual characteristics of land-marks (Miller & Carlson, 2011; Quesnot & Roche, 2015; Winter, Raubal & Nothegger, 2005). Miller and Carlson (2011), for example, focused on the perceptual and spatial characteristics of landmarks. They defined perceptually salient objects based on the size and color of the landmarks. To understand structural characteristics of landmarks, they used objects at decision points (with or without a turn). To explore the impact of landmarks, they asked people to learn a route and memorize identities and locations of objects. Researchers concluded their study by arguing that perceptual salience as well as the demands of the task (contextual salience) is critical to landmark selec-tion. In order to measure visual saliency, other researchers developed detailed measures including façade area, shape, color and visibility (Nothegger et al.,
2004; Winter et al., 2005). Winter et al. (2005) asked people to rank multiple façades with regard to prominence. They discovered that as well as other visual cues visibility and color were significant characteristics of landmarks. On the other hand, the impact of structural salience on wayfinding was also consid-ered through various studies. Stankiewicz and Kalia (2007) described struc-tural landmarks, in a corridor environment, as specific hallway configurations and object landmarks as the pictures on the walls in the corridors. They designed three experiments and found that people have a natural bias toward remembering structural landmarks over object landmarks. In another study, researchers wanted to understand the interaction between two types of sal-iency, visual and structural characteristics, since research on the combined effect of different saliency criteria is quite limited (Albrecht & Von Stülpnagel,
2018). The authors hypothesized that visually salient landmarks would get more attention if they were also structurally salient. Researchers discovered that if visually salient landmarks are located in the turning direction, then response accuracy increases in familiar environments. They could not find the same result for unfamiliar environments. Finally, Michon and Denis (2001) argued that visual landmarks are more effective when they are located at reorientation points and that landmarks help people both to construct 1Space Syntax is a technique used to analyze environments quantitatively and to understand the human and space
relations (Hillier & Hanson, 1984). By using Space Syntax line based and visibility based analysis, it is possible to measure the environments objectively and compare different results to understand the most accessible-visible points. By using visibility graph analysis, researchers defined all accessible places with grids and they measured landmark size – number of grids/cells they occupy-, visibility of landmarks – number of grids/cells they are visible from- and integration – the average visual distance to all grids/cells.
a mental image of an unfamiliar environment and to react appropriately when a decision should be made.
2.2. Saliency models
Different models were proposed to measure the saliency of landmarks auto-matically (Elias, 2003; Nothegger et al., 2004; Winter et al., 2008). Elias (2003), for example, concentrated on a building database and used multiple factors to automatically define landmarks, such as the geometry of buildings (with an attribute table that contains information about land use, building label, building use and special building parts), as well as location and visibility of buildings. Winter et al. (2008) evaluated the hierarchy of land-marks by using rankings (cognitive ranking – prominence, uniqueness and salience related) to automatically identify landmarks. These models focused on landmarks and their visual, structural or cognitive characteristics while explaining saliency.
On the other side, general saliency models were also released to measure visual saliency in natural scenes (Harel, Koch & Perona, 2007; Itti, Koch & Niebur, 1998; Judd, Ehinger, Durand & Torralba, 2009; Kümmerer, Wallis & Bethge, 2016; Kümmerer, Wallis, Gatys & Bethge, 2017). Previous research discovered that people tend to look more at salient objects (Itti, 2005; Zetzsche et al., 1998) as these objects draw attention to themselves (Land & Tatler, 2009). Zetzsche et al. (1998), for instance, found out that the eyes fixated on regions with multiple superimposed locations such as line endings or corner points. Moreover, Krukar mentioned that the more people process (or fixate on) an object, the better they remember it (Krukar, 2015). Hence, many automated saliency simulations have built up this relationship between eye-fixations and saliency. One of the earliest computational models was developed by Itti et al. (1998). In this model, researchers developed a visual attention system based on the color, intensity and orientation of objects. Since then, many other approaches have been proposed (Borji & Itti, 2013). Among them Graph Based Visual Saliency (Gbvs, Harel et al., 2007), which is a standardized version of Itti’s model, was shown to be more predictive in explaining human fixations than the Itti et al model. Recently, saliency models based on deep learning have been shown to significantly outperform most previous shallow models. One of the most accurate ones is DeepGaze II (Kümmerer et al., 2016). VGG deep neural network features (VGG-19) were used to train this model (Simonyan & Zisserman, 2014) to predict saliency, and the model was pretrained with SALICON dataset (Jiang, Huang, Duan & Zhao, 2015). The great advantage of deep saliency models is that they do not only model low-level visual features such as orientation, contrast or luminosity, but also take into account higher level features such as whole objects, or even faces, which are known to strongly attract attention.
Many models mentioned above aimed to predict where people look at by considering some visual characteristics of the scenes. Thus, the models are essential for studies on spatial knowledge and route learning (Grzeschik, Conroy Dalton, Innes, Shanker & Wiener, 2019). Earlier studies focused on estimating the contribution of saliency models to eye-movements by using dynamic scenes and found no significant relationships between model- predicted saliency and duration-of-fixations (Itti, 2005). Even though the number of studies on navigation and saliency is high, the number of studies on the effect of salient objects on navigation is still limited. To the best of the authors’ knowledge, there is one more study that aimed to compare naviga-tional behavior with different saliency models (Psarras, Fatah, Zarkali & Hanna, 2019) in addition to the previously mentioned study (Grzeschik et al., 2019). Grzeschik et al. (2019) designed a virtual environment and placed landmarks at intersections. At each intersection there was a unique landmark (that appears once along a route) and a non-unique landmark (that appears at two of the intersections along a route). Saliency of landmarks also varied. Participants’ eye movements were captured and saliency was assessed using an online survey as well as saliency algorithms. Researchers discovered that the results of the survey and algorithms pointed to salient landmarks. Psarras et al. (2019), on the other hand, followed a different approach and recorded pedes-trians’ routes in a real environment. The paths people used were then con-verted to 3D models and virtual cameras were used to capture people’s fields of view. Saliency algorithms were implemented to these fields of view. Researchers stated that visual saliency was correlated with observed naviga-tional behavior. They concluded the study by mentioning that saliency can be used in predicting navigational behavior.
2.3. Problem statement and hypothesis
Even though there are a great number of studies on landmarks, comparative studies on saliency of landmarks and saliency algorithms are still limited. As mentioned above, saliency models are typically trained with eye-tracking data. But is it possible to confirm that they really correlate with what people find salient? This study aims to understand whether or not saliency algorithms are sufficient in explaining people’s saliency evaluations. Saliency models and a survey are used to explore visual saliency and the association between these two approaches is investigated. Literature points to the impact of visual and structural landmarks or the combined effects of different saliency mea-sures on landmark selection. However, this topic is still debateable. Therefore, this study also aims to understand the factors that make landmarks salient.
It is hypothesized that landmarks, which are objectively salient according to the models, are also described as subjectively salient by participants. Therefore, it is expected that the results of the saliency models are highly correlated with
the results of subjective ratings. Similar to the findings of recent literature (Miller & Carlson, 2011; Von Stülpnagel & Frankenstein, 2015; Winter et al.,
2005), it is also hypothesized that saliency of landmarks are strongly related to the visual characteristics of objects such as their size or/and color. In addition, structural salience is expected to have an effect on the results.
3. Method and analysis
An online game, Sea Hero Quest (SHQ), was used in this study (Coutrot et al.,
2018). SHQ was used to predict real-world navigation performance (Coutrot et al., 2018) or to explore the genetic risk status for Alzheimer’s dementia (Coughlan et al., 2019). Hence, the game has an ecological validity, which makes it worthy to be used as a platform in this study. In a previous research, 30 participants were asked to complete specific levels of SHQ and then the same participants were tested on an analogous, real-world task in the Covent Garden neighborhood of London. The findings of this research showed that there was a significant correlation between virtual and the real-world environ-ment navigation performance (Coutrot et al., 2018). This finding is promising, since it shows that the results highlighted in this study can potentially be adapted to real-world environments.
SHQ consists of 75 levels with different spatial layouts. While the first levels are relatively simple and easy to navigate, later levels get progressively more complex and harder to way-find. During the design phase of the game it was hypothesized that landmarks play a role in navigational performances (sub-sequent work by the authors evidence this (Emo, Hölscher, Wiener & Conroy Dalton, 2012; Grzeschik et al., 2019)). Therefore, the original game was designed using controlled landmark conditions in order to facilitate further exploration of the roles of landmarks in navigation. Hence, not only the spatial layouts of levels, but also landmarks were deliberately designed to understand how people find their way through complex environments. The landmarks were defined and created by the game company Glitchers Ltd. with input from the research team. Both global landmarks (those visible from larger distances and multiple viewpoints) and local landmarks (those only visible from close range) as well as salient and less salient landmarks were defined by the researchers. Therefore, the game is valid for use in this study.
Two different levels of SHQ, which have different landmark conditions (as defined by the research team behind the game), were selected. ‘Easy land-marks’ are both visually and structurally salient landmarks. As Sorrows and Hirtle defined (Sorrows & Hirtle, 1999), they differentiate from their sur-roundings with their visual characteristics, such as their color, shape or size, and they are placed at integrated locations (at intersections, for instance). ‘Hard landmarks’ are visually salient or less salient landmarks at segregated places (e.g. dead-ends). The easy and hard landmark categories were defined
by the designers (Ruth Conroy Dalton, Christoph Hölscher, Jan Wiener and Hugo Spiers) and the different landmarks were designed and placed according to these categories through the development process of the game -see the paper by Conroy Dalton for a fuller explanation of the design process (Conroy Dalton, 2016)-.
3.1. Selection of stimuli
In the wayfinding levels of SHQ, players of the game (more than 4 million people) are asked to view a map that shows the environment where they will navigate in and the goal locations that they should reach. When they close the map, the game starts, and they navigate a boat in a river/canal environment. Since the survey asks participants to focus on environments and does not consider their spatial performance, one video was recorded for each level by the first author (DY) (video length was between 60 and 90 seconds) in which all goal locations were found respectively with an optimal path taken.
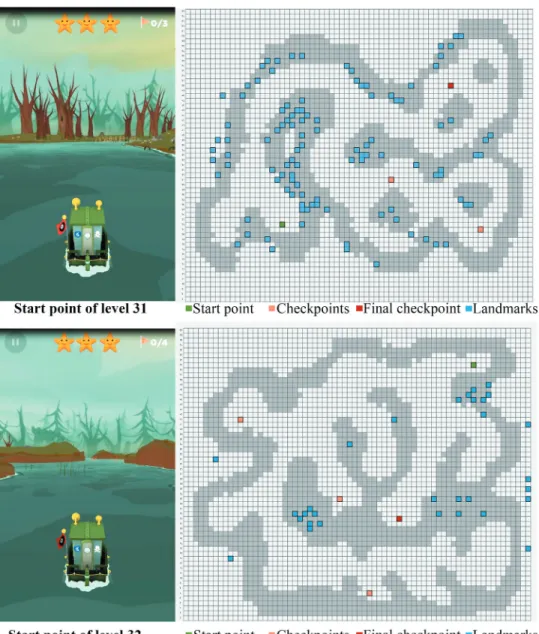
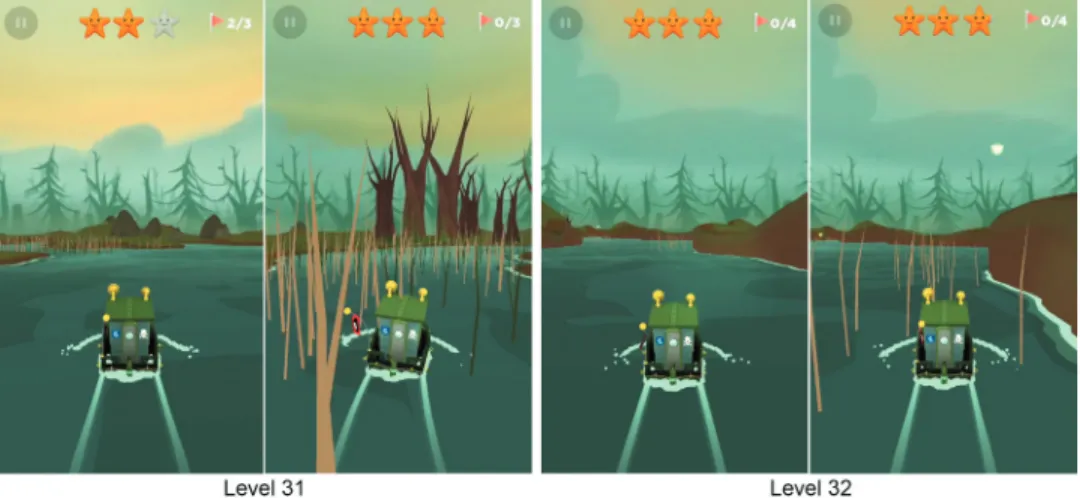
To compare objects’ saliency levels, levels with the same conditions (i.e. weather/map) were chosen and environmental measures were kept as similar as possible. As there were 75 levels in the game, clustering analysis was conducted based on spatial measures. Space Syntax measures included axial and segment-based integration and choice (r: n, 3), axial-based intelligibility, VGA (visual connectivity, visual integration, intelligibility), and connectivity (directional reach based on 10° for 0 and 2 direction changes, metric reach for 10 m and 100 m). Complexity measures included number of decision points and destinations, total segment length, and shortest route. Based on the results of the clustering analysis, similar layouts were selected (for more information about the measures and the clustering see Yesiltepe et al., 2019). Therefore, levels with similar spatial values were grouped together to enable comparable environments to be selected. Additional conditions that might affect partici-pants’ choices, such as the existence of global landmarks (some levels include global landmarks while others do not), map condition (in some levels maps are obscured while in others they are clear), weather condition (in some levels the weather is clear while in others it is foggy), theme (five different themes were used in the game and components of environments vary in different themes), were also kept the same (for more information see Coutrot et al., 2018). Hence, levels 31 and 32 were selected in this study (Figure 1) as they have the same theme, same global landmark condition, weather and map conditions.
3.2. Survey design
Visual saliency was first analyzed with a survey study. Survey results could be closely related with cognitive salience as well; however, cognitive salience was beyond the scope of this study. Participants were asked questions to identify
visual saliency only. Previous literature argued that people’s attention level is lower when they complete a passive wayfinding task (Afrooz, White & Parolin,
2018). However, another research pointed that no differences were observed between active and passive navigators (Wilson, Foreman, Gillett & Stanton,
1997). Based on the findings of the latter research, we also asked people to pay attention to the environment without completing any navigation task. For the survey study, a video was recorded (750x1334-pixel resolution, screen size: 5.44” (138.3 mm) height and 2.64” (67.1 mm) width) for each level in which
Figure 1. Layout of levels 31 and 32 and position of landmarks: screenshots were taken from the start points of level 31 (above) and 32 (below) and the start points, checkpoints, and final checkpoints were shown on the maps.
the boat was navigated through the environments. The video’s sound track was removed as it was assumed that the noise might distract attention. When the task was completed, the video stopped and participants were asked to view the images (image size = 550 x 680 pixel) that were extracted from the video (Figure 2).
All previously designated landmarks in each level were used in this study since any of these could help people navigate themselves within the environ-ment. Visual characteristics of landmarks included color, size, shape, and material. Structural characteristics, on the other hand, included the location or visibility of landmarks (i.e. landmarks seen clearly from a shorter distance versus those that fail to be recognized clearly due to increased distance). Two images for each object were shown to the participants. In the first one, transparency of the background was increased so that the landmarks could be seen clearly, and in the second image, participants viewed the image exactly as it appeared in the video. All images belonging to the same level were positioned in one page (center-aligned), and the order of images was rando-mized. For level 31, 9 landmarks and for level 32, 7 landmarks were shown. In
Figure 2. A landmark image is extracted from the video of level 31. While ranking for the landmarks, participants viewed objects both with a transparent background (on left) and as they were seen in the video (on right).
order to create the online survey, Google Forms was chosen among other online survey pages, as it allowed us to randomize questions, upload videos and images for free.
3.2.1. Procedure
Before the online survey was released, a laboratory survey was held with 25 architecture students at Northumbria University.2 The purpose of this study was to control the online survey and to better understand whether or not participants might be distracted during the online survey. Sample size was limited to 25 students (it represents 10% of the total number of participants).
Participants were invited to the lab-room one by one and were asked to sign in to their e-mail accounts, through which they started the survey. Before starting the survey study, they were provided with project information and informed consent. The consent form and the procedure were approved by Northumbria University Ethics Committee (Submission ID: 7939). Participants were asked to answer questions about their demographics (age and gender). As participants answered the questions and moved to the next page, they were able to view the videos by using the “play” button. Information about the video, which mentioned that participants should view the video in order to answer the questions, was inserted on the top of the video. It read: “In this study, you will be asked to watch two videos that have been recorded in a virtual environment. In these environments, you will see a boat navigating through a canal/river. The boat will travel to a series of destinations. Please watch these videos and pay attention to the landscape through which the boat is moving”. During the video, all checkpoint destinations were found, respec-tively, and when the task was completed, the video stopped. When participants watched the video and moved to the next page, they saw all the landmarks related to the relevant level. The order of the pictures was randomized across participants, and participants were asked to rank the landmarks on a 5-Likert scale, from highly noticeable (5) to unnoticeable3 (1).
As participants completed the questions for the first video (level 31), they followed the same procedure for the second video (level 32) and for the images related to it. The video order was not counter-balanced to match to the game experience. When participants completed the questions for the two levels, they viewed a page, which notified them that the survey was completed, and they submitted their results by using the “submit” button. None of the questions, 2Previous studies showed that educational level has a significant impact on people’s navigation performances (Erkan,
2018). However, in this study, the laboratory study was conducted with architecture students, and results of the t-test showed that there was no significant change between online survey (unknown educational levels) and the laboratory survey (tertiary education). Therefore, it can be assumed that people who attended the online survey study included people with similar educational background (degree level). Alternatively, it might be considered that education level does not have a significant impact on landmark evaluations.
34. Rather than using “saliency” term, authors preferred “noticeability” to make it easier for participants to understand
except the ones about their agreement on data protection and the procedure, were mandatory.
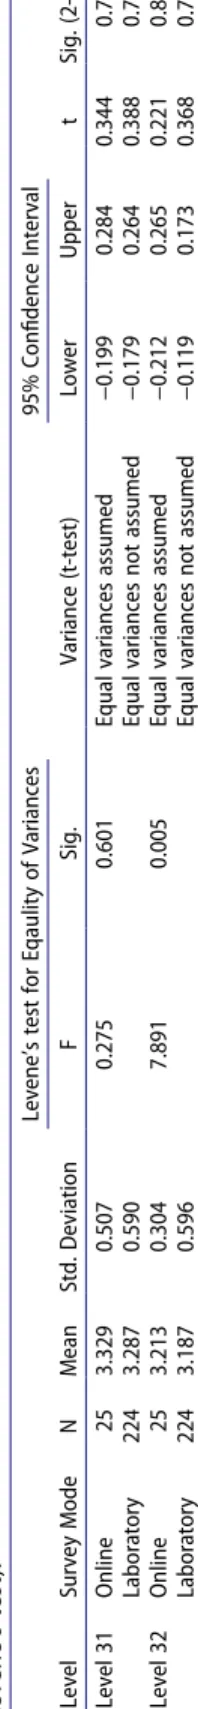
After completing the laboratory survey, participants were recruited online via a range of social media channels for the online survey. The procedures and format of the latter were the same as the former. A t-test was used to investigate the significance of the difference within the groups of both type of surveys. The average score of each participant was calculated for each level for both laboratory and online survey results, and a t-test was implemented to the average values (Table 1). Levene’s test showed a homogeneity of variance for level 31 (F = 0.275, p =.601) and for level 32 it showed that homogeneity of variance cannot be assumed (F = 7.891, p = .005). The p-value was >0.05 in all cases. In other words, no significant changes were present between online and the laboratory surveys for two levels. Therefore, the results of both surveys were used in this study.
3.2.2. Participants
A total of 254 participants, 25 of which completed the lab-based survey, attended the survey. The results of 4 participants, who were older than 50 years old, were excluded based on the findings of an earlier research on the effects of age on attention levels (Lufi & Haimov, 2019). Additionally, one participant who answered only questions of the first level (level 31) was also excluded (N = 249). Eventually 164 female, 83 male and 2 other (preferred not to say) participants aged between 18 and 50 took part in this study.
3.3. Objective saliency analysis
Both Harel et al.’s method (Harel et al., 2007), namely Gbvs, and DeepGaze II (Kümmerer et al., 2016) were used to measure the impact of saliency objec-tively. To compare saliency of objects, regions of interest (ROI)4 was used. In this study, boundaries of landmarks were used to define the regions (with rectangles). However, as the size of objects varied, size of the regions of interest also varied. Hence, the mean values inside the regions were calculated to compare the saliency values.
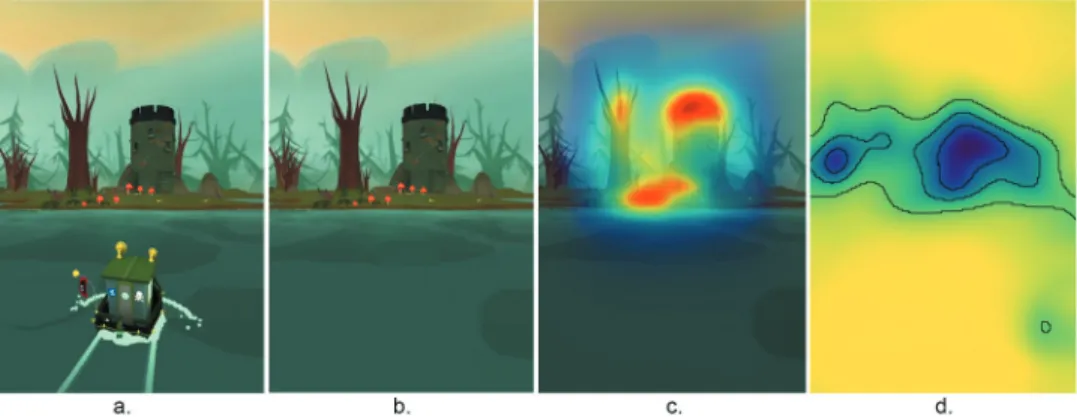
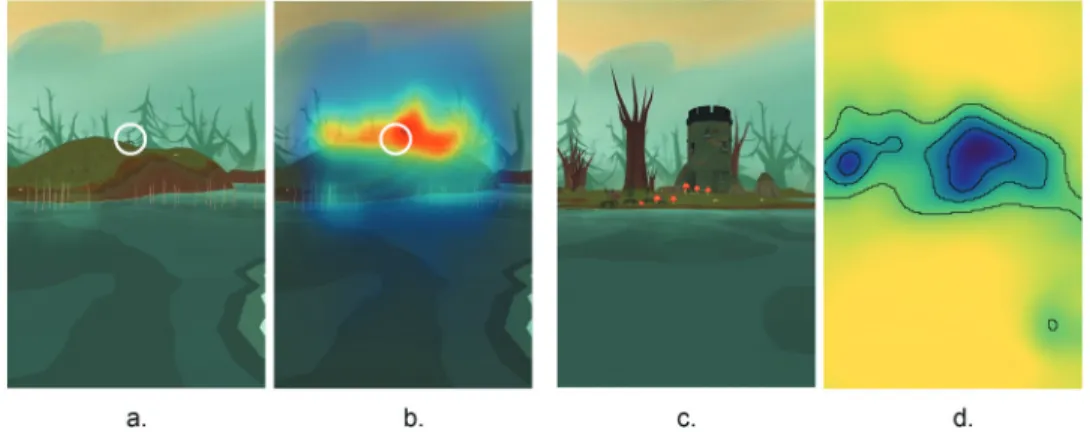
In order to test whether there is a correlation between survey analysis and objective saliency measures, the exact same images used in the survey study were used in models (Figure 3). The objects were aimed to be kept in the same distance for the screenshots and all objects were included in each level similar to the survey study. Figure 4 shows (a) a screenshot with the boat from the game, (b) an image in which the boat is excluded, (c) Gbvs analysis, and (d) 4Region of interest means a selected area within a dataset that is identified for a purpose. So different rectangular
areas were defined for each landmark, which is why the average values were calculated for each ROI. Where the ROI included large amount of background image, multiple, contiguous ROIs were used and the values produced were averaged. In most cases, the area included hardly any background information.
Table 1. Mean ratings and results of the independent samples t-tests for levels 31 and 32 (gray-highlighted values show the significance of the t-test based on Levene’s test). Level Survey Mode N Mean Std. Deviation Levene’s test for Eqaulity of Variances Variance (t-test) 95% Confidence Interval t Sig. (2-tailed) F Sig. Lower Upper Level 31 Online 25 3.329 0.507 0.275 0.601 Equal variances assumed −0.199 0.284 0.344 0.731 Laboratory 224 3.287 0.590 Equal variances not assumed −0.179 0.264 0.388 0.700 Level 32 Online 25 3.213 0.304 7.891 0.005 Equal variances assumed −0.212 0.265 0.221 0.825 Laboratory 224 3.187 0.596 Equal variances not assumed −0.119 0.173 0.368 0.714
DeepGaze II analysis. The boat as well as the top part of the images, where participants’ navigation performance could be seen, was cropped so that these did not impact the saliency scores. For DeepGaze II analysis images were rotated 90 degrees clockwise to provide a landscape image as DeepGaze-II algorithm is trained with landscape images. However, Gbvs analysis was
Figure 3. Screenshots from level 31 show landmarks in context and consist of all landmarks that were used for the survey study. To make landmarks clearer, the transparency of the background is increased in the images.
Figure 4. Objective measurement of saliency for level 31. (a) a screenshot with the boat from the game, (b) an image in which the boat is excluded, (c) Gbvs analysis, and (d) DeepGaze II analysis.
impervious to orientational effects. As DeepGaze II was trained with 1024 × 786 sized images (Kümmerer et al., 2016), images in this study were resized with the same ratio. In Figure 14-c, warm colors around the castle and toadstools indicate areas of high saliency, while in Figure 14-d, dark blue colors around the castle and trees indicate areas of high saliency.
4. Results
4.1. Survey results
The survey suggests a number of distinctions (Tables 2 and 3). The first indicates that the castle was the most outstanding object among all others in both levels. This could be anticipated intuitively, because the castle was differentiated with respect to its size and color. Moreover, in level 31 the castle was located at a decision point, where the boat made a turn. This can partly be the reason why the castle was rated as the most noticeable object. This was followed by trees, grass, and the arch for level 31, whereas it was followed by grass, trees and toadstools for level 32. Arch and trees were also notable objects as they were also different with respect to their height and color.
Surprisingly, grass was ranked top with other objects for both levels. This may be due to the fact that during the video the boat moved through the grass (Figure 5), so grass appeared quite close to the camera viewpoint at times. Thus, even though the object would not be easily noticeable in terms of its low contrast with the background or shape, it was still noticed by participants. The number of participants who found grass highly noticeable decreased from 140 to 124 in level 32 as compared to level 31. This decrease can be explained with the decrease in the amount of grass in level 32.
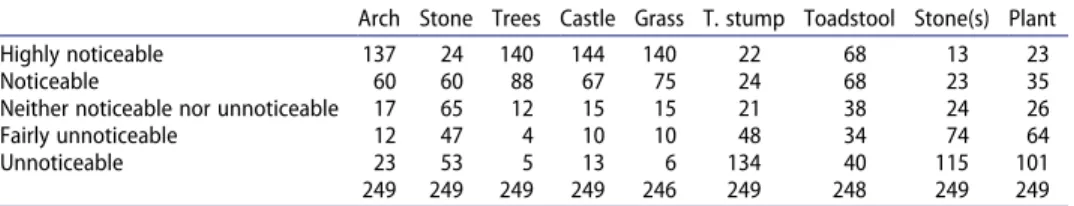
Table 2. Survey results of level 31 showing the number of survey ratings.
Arch Stone Trees Castle Grass T. stump Toadstool Stone(s) Plant Highly noticeable 137 24 140 144 140 22 68 13 23 Noticeable 60 60 88 67 75 24 68 23 35 Neither noticeable nor unnoticeable 17 65 12 15 15 21 38 24 26 Fairly unnoticeable 12 47 4 10 10 48 34 74 64 Unnoticeable 23 53 5 13 6 134 40 115 101 249 249 249 249 246 249 248 249 249
Table 3. Survey results of level 32 showing the number of survey ratings (even though there were no arch and tree stump in level 32, these objects were added to have a comparable image).
Arch Stone Tree Castle Grass T.stump Toadstool Stone(s) Plant Highly noticeable 17 105 139 124 94 8 23
Noticeable 15 105 90 91 105 9 29
Neither noticeable nor unnoticeable 15 29 13 22 18 17 21 Fairly unnoticeable 48 4 4 10 19 37 45
Unnoticeable 153 4 3 1 11 176 130
Toadstools were also considered as notable objects by participants despite their size and shape. This outcome likely relates to the red color of toadstools, which was unique in the environment (which has a very uniform palette of browns, blues and greens) and contrasted with the background. This idea was also supported by participants in the discussions after the lab study. In level 32, the number of people who found the toadstools noticeable or highly noticeable increased from 68 to 105 and from 68 to as compared to level 31. When the videos were played again, it was seen that the boat moved quite close to the toadstools. Hence, participants could have a chance to see this landmark closer, which can account for this increased rating. Plant was unremarkable for parti-cipants, which was again not surprising, as it did not have any strong visual characteristics. Moreover, people did not notice both types of stones as well, even though one type differentiated from the background with respect to its size.
4.2. Objective saliency measurement
The saliency map of the image of each landmark was computed with two saliency models. Maps for DeepGaze II were prepared by using a webpage (https://deepgaze.bethgelab.org/), and Gbvs model was computed in Matlab (Mathworks, Natick, USA). Having run the analysis and examined the results of Gbvs and DeepGaze II both sets of results seemed to intuitively capture some aspects of what constitutes a salient landmark. Once the saliency maps were conducted, the saliency scores could be computed for each object. The regions of interest were used to find an average saliency value for each land-mark and each level. To normalize the results, a z-score was applied to each saliency map. Accordingly, toadstool, castle and small stone were detected as the most salient objects in level 31 while tree, castle and toadstool were
Figure 5. Screenshots are taken from the video of levels 31 and 32 showing how the grass is seen at different times.
detected as the most salient objects in level 32 through Gbvs analysis. Results of DeepGaze II analysis showed that plant, tree stump and castle were the most salient objects in level 31, whereas stone, castle and toadstool were the most salient objects in level 32 (Table 4).
As a second step, the relationship between the survey and the models was explored in detail. The results of both the survey and the models were kept as continuous data. A regression analysis was calculated to predict the survey results based on Gbvs and DeepGaze II. No significant relationship was found (p > .05, R2 = 0.268 and 0.254 for levels 31 and 32, respectively) between the models and the survey results (Table 5).
5. Discussion and conclusion
One of the goals of this study was to assess what features of objects make them more likely to be selected as landmarks. Analysis of the subjective ratings support the view that landmark saliency is predicted by the size of the object and its visual distinctiveness, such as color contrast to its background (Miller & Carlson, 2011; Quesnot & Roche, 2015; Winter et al., 2005). In this experi-ment, participants chose castle, trees, grass and arch as salient objects. All selected objects (except grass) differentiated from their surroundings with respect to their height (i.e. they are relatively taller than their surroundings). In addition, trees and arch are also distinguished from their surroundings with respect to their color (i.e. they have contrasting color with the surrounding objects). Hence, both height and color can be considered as determinants of visual saliency.
Table 4. Results of the objective saliency measures (z-scored).
Landmarks_level 31 Gbvs DG II Landmarks_ level 32 Gbvs DG II
Arch 0.133 0.189 Stone 0.868 0.904 Stone 0.909 1.757 Tree 0.661 0.634 Tree 1.499 0.922 Castle 1.103 1.402 Castle 1.213 1.594 Grass 0.029 0.009 Grass 0.055 0.016 Treestump −0.206 1.438 Toadstool 1.366 0.956 Toadstool 1.084 1.141 Sstone 0.946 0.520 Sstone −1.213 0.326 Plant −0.978 1.661 Plant 1.026 −1.324
Table 5. Results of the regression analysis between model prediction and survey data.
Levels R² Term Estimate Std Error t Ratio Prob>|t| Lower 95% Upper 95% Std Beta 31 0.268 Inter. 3.876 0.729 5.320 0.002 2.093 5.659 0.000 Gbvs 0.260 0.500 0.520 0.622 −0.964 1.484 0.185 DG II −0.819 0.654 −1.250 0.257 −2.418 0.781 −0.447 32 0.254 Inter. 2.660 0.713 3.730 0.020 0.681 4.638 0.000 Gbvs 0.624 0.636 0.980 0.382 −1.141 2.388 0.438 DG II 0.204 0.558 0.370 0.733 −1.344 1.753 0.163
In addition, our data also provide support for the importance of spatial position of landmarks in determining landmark salience in navigation (Michon & Denis, 2001); objects encountered in close proximity to the navigator when traveling were judged highly salient despite their low visual saliency. For instance, grass was visible at different points and multiple times within the environment. Even though it was not particularly differentiated from its surrounding due to its shape and color, grass was still selected as a salient object as it could be easily seen by participants from a relatively close distance. Similarly, changing the location of the toadstools in level 32 had, presumably, an impact on people’s ratings since more people rated them as noticeable or highly noticeable when they were closer to the participants. This points to the idea that not only the visual characteristics of landmarks but also their structural characteristics are important for landmarks to become salient. These findings suggest that objects with a contrasting color or size (compared to their surroundings) are recognized and remembered as salient landmarks; therefore they have higher potential to be used for wayfinding tasks such as route descriptions or orientation. If these landmarks are also located on route and close to the way-finder (so that they are visible from close up), then they would be highly preferred. This study supports the findings of previous research on the combined impact of visual and structural saliency, which suggest that visual landmarks can be more effective when they are also structurally salient (Albrecht & Von Stülpnagel, 2018; Michon & Denis, 2001).
This study also examined the extent to which computational models of saliency (Gbvs and DeepGaze II) would predict the subjective ratings of land-mark saliency when watching the navigation of cue-rich virtual environments. It was found that there was no significant relationship between the saliency model predictions and the subjective ratings. Hence, contrary to our hypothesis, saliency models alone were insufficient to predict subjective ratings.
5.1. Model-based limitations
One of the model-based limitations is due to the relative position of individual objects. For instance, if an object is close to another salient landmark, this could affect the saliency scores of the first object and turn it into a salient landmark as well. However, contrarily, previous studies argued that the existence of a salient landmark may make another one less salient (so it decreases the possibility for other objects to be selected as a point-of-reference (Raubal & Winter, 2002; Sadeghian & Kantardzic, 2008)). Therefore, the saliency regions that are described through the use of models may be misleading, especially when the objects are quite close to each other or when one of them is on the top of another one (Figure 6(c-d)). Similarly, the background of objects was also influential in our analysis as it affected the saliency of objects. For example, the trees located further away in the game, which merged into a group with a smooth color that
blended with the background, were detected as salient objects in some of the images and they had an impact on the results (Please see Figure 6(a-b)). Hence, future models can be more sensitive to objects that are overlapped or they can consider the locational relationships. As such, the relationship between saliency models and people’s evaluations can become significant.
Second, saliency models were tested with only static images rather than moveable, dynamic scenes depending on the nature of the algorithms. Even though the models were sufficient in explaining an image and the saliency of objects in this image, they can be insufficient in explaining people’s choices in dynamic scenes. Hence, new models can be developed where people could upload a video rather than an image to better under-stand and measure saliency of objects. Recently video saliency detection attracted attention of researchers, since image based detection depends on the calculation of low-level features, which change dramatically in video scenes and as videos need more attention to extract of saliency informa-tion between consecutive frames (Bi, Lu, Li, Yang & Guan, 2019). Hence, video saliency detection (Bi et al., 2019; Leifman, Rudoy, Swedish, Bayro- Corrochano & Raskar, 2017; Li, Chen, Li & Yu, 2019) as well as saliency in virtual reality (Sitzmann et al., 2018) was studied by different research-ers . More research is needed to detect salient objects and as a next step, one of the video-based saliency detection models can be used to see if they suffice to explain people’s choices.
Figure 6. An example of the anomalous results from the saliency software (Images from left to right: (a) the image used to measure saliency of the plant that is shown within a white circle; (b) the impact of the background on Gbvs model. Due to the trees on the background, the plant is also detected as a salient object. (c) the image used to measure saliency of toadstools, and (d) the impact of the castle on DeepGaze II model. Objects around the castle, toadstools and stones, are also detected as salient).
5.2. Limitations of the current study
There are numerous context-related limitations to this study. The first limitation is due to the fact that the number of landmarks was limited to 9 and 7 for levels 31 and 32, respectively, which made it hard to find statisti-cally significant relationships. Further research can be undertaken by using a higher number of landmarks to explore the relationship between saliency algorithmic models and the subjective evaluations. In addition, our partici-pants were asked to watch the prerecorded videos, instead of actively navi-gating themselves within the environments. We opted for this method to allow participants the opportunity to solely focus on the environment and observe landmarks more easily. Previous research on active and passive learning found no significant differences between active and passive learning (Gaunet, Vidal, Kemeny & Berthoz, 2001; Wilson et al., 1997). However, changes in the performance depending on a given task were also discussed and researchers claimed that people might have better wayfinding perfor-mance and produce detailed maps when they actively explore an environ-ment (Carassa, Geminiani, Morganti & Varotto, 2002). Future work might benefit from exploring whether results observed here extent to tasks in which the participants actively navigate themselves. Moreover, we are aware that the conditions of the game environment are more limited compared to real environments. However, we used game environments that have been tested and compared with real environments (Coutrot et al., 2018). The results of this comparison showed that there was a significant relationship between the navigational performances within the real-world and those within virtual environments. Hence, it was assumed that the results of this study could be predictive for real-world environments. Finally, while conducting objective saliency analysis, similar procedural steps were followed for different images: landmarks were aimed to be kept within the same distance for the screen-shots, the analyses were run in landscape orientation since DeepGaze-II was trained with landscape images, regions of interest (ROI) was used and the mean values inside the regions were calculated to have comparable results. However, future research can be conducted by using the edges of actual landmarks, rather than using ROI.
Nevertheless, this study contributed to the existing literature in different ways. First, we focused on visual and spatial characteristics of landmarks that make them salient. Second, saliency models were used and the results were compared with the survey results, which is quite limited in the literature. Alternatives that the model developers can consider in developing their models further to obtain better predictions were suggested. Accordingly, more sensitive models that can detect boundaries of each object are suggested so that the saliency score of each region can be calculated for different
landmarks. This will allow high-scored objects not to affect low-scored objects, or vice-versa. In addition, models that can support video-based analysis are also suggested. Our results showed that DeepGaze II and Gbvs models are insufficient to explain people’s choices in static scenes. Hence, new models, in which people could upload a video rather than an image, to better understand and measure saliency of objects need to be developed. This can improve results of the models in explaining people’s saliency evaluations.
Acknowledgments
Authors would like to thank Ramona Grzeschik for her contribution to the saliency models, Saskia Kuliga for her suggestions about the online survey, and Stephen Law and Nick Dalton for their suggestions on DeepGaze II model.
References
Afrooz, A., White, D., & Parolin, B. (2018). Effects of active and passive exploration of the built environment on memory during wayfinding. Applied Geography, 101, 68–74. doi:org/ 10.1016/j.apgeog.2018.10.009
Albrecht, R., & Von Stülpnagel, R. (2018). Memory for salient landmarks: Empirical findings and a cognitive model. In S. Creem-Regehr, J. Schöning, & A. Klippel (Eds.), Spatial Cognition XI (pp. 311–325). Cham, Switzerland: Springer International Publishing. Bi, H., Lu, D., Li, N., Yang, L., & Guan, H. (2019). Multi-Level Model for Video Saliency
Detection. In 2019 IEEE International Conference on Image Processing (ICIP) (pp. 4654–4658). DOI:10.1109/ICIP.2019.8803611
Borji, A., & Itti, L. (2013). State-of-the-art in visual attention modeling. IEEE Transactions on Pattern Analysis and Machine Intelligence, 35(1), 185–207. doi:10.1109/TPAMI.2012.89
Burnett, G., Smith, D., & May, A. (2001). Supporting the navigation task: Characteristics of “good” landmarks. Contemporary Ergonomics, 1, 441–446. Retrieved from http://web. science.mq.edu.au/~coral/Papers/Baus/Ergsoc-2001-paper-np.pdf
Caduff, D., & Timpf, S. (2008). On the assessment of landmark salience for human navigation. Cognitive Processing, 9(4), 249–267. doi:10.1007/s10339-007-0199-2
Carassa, A., Geminiani, G., Morganti, F., & Varotto, D. (2002). Active and passive spatial learning in a complex virtual environment: The effect of efficient exploration. Cognitive Processing, 3–4(2002), 65–81.
Castelli, L., Latini Corazzini, L., & Geminiani, G. C. (2008). Spatial navigation in large-scale virtual environments: Gender differences in survey tasks. Computers in Human Behavior, 24 (4), 1643–1667. doi:10.1016/j.chb.2007.06.005
Cenani, S., Arentze, T. A., & Timmermans, H. J. P. (2017). Cognitive learning approach for travel demand modeling: Estimation results. Transportation Research Procedia, 22, 55–64. doi:org/10.1016/j.trpro.2017.03.007
Cliburn, D., Winlock, T., Rilea, S., & Van Donsel, M. (2007). Dynamic landmark placement as a navigation aid in virtual worlds. In ACM (Ed.), Proceedings of the 2007 ACM symposium on Virtual reality software and technology - VRST ’07 (pp. 211–214). DOI:10.1145/ 1315184.1315225
Conroy Dalton, R. (2016). Want to build better computer games? Call an architect. The Conversation, 6–7. Retrieved from http://theconversation.com/want-to-build-better- computer-games-call-an-architect-58912
Coughlan, G., Coutrot, A., Khondoker, M., Minihane, A.-M., Spiers, H., & Hornberger, M. (2019). Toward personalized cognitive diagnostics of at-genetic-risk Alzheimer’s disease. Proceedings of the National Academy of Sciences, 116(19), 9285–9292. doi:10.1073/ pnas.1901600116
Coutrot, A., Schmidt, S., Coutrot, L., Pittman, J., Hong, L., Wiener, J. M., . . . Spiers, H. J. (2018). Virtual navigation tested on a mobile app is predictive of real-world navigation performance. BioRXiv, 1–10.
Coutrot, A., Silva, R., Manley, E., de Cothi, W., Sami, S., Bohbot, V. D., . . . Spiers, H. J. (2018). Global determinants of navigation ability. Current Biology, 28(17), 2861–2866.e4. doi:10.1016/J.CUB.2018.06.009
Elias, B. (2003). Extracting landmarks with data mining methods. In International Conference on Spatial Information Theory (Vol.2825, pp. 375–389). Springer, Berlin Heidelberg. DOI:10.1007/978-3-540-39923-0_25
Emo, B., Hölscher, C., Wiener, J. M., & Conroy Dalton, R. (2012). Wayfinding and spatial configuration: Evidence from street corners. In Eighth International Space Syntax Symposium (pp. 8098: 1–8089:16). Santiago de Chile.
Erkan, İ. (2018). Examining wayfinding behaviours in architectural spaces using brain imaging with electroencephalography (EEG). Architectural Science Review, 61(6), 410–428. doi:10.1080/00038628.2018.1523129
Evans, G. W., Skorpanich, M. A., Bryant, K. J., & Bresolin, B. (1984). The effects of pathway configuration, landmarks and stress on environmental cognition. Journal of Environmental Psychology, 4(4), 323–335. doi:10.1016/S0272-4944(84)80003-1
Evans, G. W., Smith, C., & Pezdek, K. (1982). Cognitive maps and urban form. Journal of the American Planning Association, 48(2), 232–244. doi:10.1080/01944368208976543
Gaunet, F., Vidal, M., Kemeny, A., & Berthoz, A. (2001). Active, passive and snapshot exploration in a virtual environment: Influence on scene memory, reorientation and path memory. Cognitive Brain Research, 11(3), 409–420. doi:org/10.1016/S0926-6410(01)00013-1
Golledge, R. (1999). Human wayfinding and cognitive maps. In Wayfinding behavior: Cognitive mapping and other spatial processes (pp. 5–45). Baltimore: The Johns Hopkins University Press.
Grzeschik, R., Conroy Dalton, R., Innes, A., Shanker, S., & Wiener, J. M. (2019). The contribution of visual attention and declining verbal memory abilities to age-related route learning deficits. Cognition, 187, 50–61. doi:org/10.1016/j.cognition.2019.02.012
Harel, J., Koch, C., & Perona, P. (2007). Graph-based visual saliency. Advances in Neural Information Processing Systems, 545–552. Retrieved from http://papers.nips.cc/paper/3095- graph-based-visual-saliency.pdf
Hillier, B., & Hanson, J. (1984). The social logic of space. Cambridge, UK: Cambridge University Press.
Ishikawa, T., & Montello, D. R. (2006). Spatial knowledge acquisition from direct experience in the environment: Individual differences in the development of metric knowledge and the integration of separately learned places. Cognitive Psychology, 52(2), 93–129. doi:org/ 10.1016/j.cogpsych.2005.08.003
Itti, L., Koch, C., & Niebur, E. (1998). A model of saliency-based visual attention for rapid scene analysis. IEEE Transactions on Pattern Analysis and Machine Intelligence, 20(11), 1254–1259. doi:10.1109/34.730558
Itti, L. (2005). Quantifying the contribution of low-level saliency to human eye movements in dynamic scenes. Visual Cognition, 12(6), 1093–1123. doi:10.1080/13506280444000661
Jiang, M., Huang, S., Duan, J., & Zhao, Q. (2015). SALICON: Saliency in Context. In The IEEE Conference on Computer Vision and Pattern Recognition (CVPR), Boston, United States (pp. 1072–1080).
Judd, T., Ehinger, K., Durand, F., & Torralba, A. (2009). Learning to predict where humans look. In 2009 IEEE 12th International Conference on Computer Vision (pp. 2106–2113). DOI:10.1109/ICCV.2009.5459462
Kaplan, S. (1976). Adaptation, structure and knowledge. In G. T. Moore & R. G. Golledge (Eds.), Environmental knowing: Theories, research and methods (pp. 32–45). Stroudsburg, Penn: Downden, Hutchinson and Ross.
Klippel, A., & Winter, S. (2005). Structural salience of landmarks for route directions. In International Conference, COSIT, Ellicottville, NY, USA, (pp. 347–362).
Krukar, J. (2015). The influence of an art gallery’s spatial layout on human attention to and memory of art exhibits. University of Northumbria at Newcastle.
Kümmerer, M., Wallis, T. S. A., & Bethge, M. (2016). DeepGaze II: Reading fixations from deep features trained on object recognition. ArXiv Preprint, 1–16. Retrieved from http://arxiv.org/ abs/1610.01563
Kümmerer, M., Wallis, T. S. A., Gatys, L. A., & Bethge, M. (2017). Understanding low- and high-level contributions to fixation prediction. In The IEEE International Conference on Computer Vision (ICCV) (pp. 4789–4798).
Land, M., & Tatler, B. (2009). Looking and acting: Vision and eye movements in natural behaviour. Oxford: Oxford University Press. doi:10.1093/acprof:oso/ 9780198570943.001.0001
Leifman, G., Rudoy, D., Swedish, T., Bayro-Corrochano, E., & Raskar, R. (2017). Learning gaze transitions from depth to improve video saliency estimation. In 2017 IEEE International Conference on Computer Vision (ICCV) (pp. 1707–1716). DOI:10.1109/ICCV.2017.188
Li, H., Chen, G., Li, G., & Yu, Y. (2019). Motion guided attention for video salient object detection. ArXiv, arXiv:1909.07061. Retrieved from https://ui.adsabs.harvard.edu/abs/ 2019arXiv190907061L
Lovelace, K. L., Hegarty, M., & Montello, D. R. (1999). Elements of good route directions in familiar and unfamiliar environments. Spatial Information Theory. Cognitive and Computational Foundations of Geographic Information Science, 1661, 65–82. doi:10.1007/ 3-540-48384-5_5
Lufi, D., & Haimov, I. (2019). Effects of age on attention level: Changes in performance between the ages of 12 and 90. Aging, Neuropsychology, and Cognition, 26(6), 904–919. doi:10.1080/ 13825585.2018.1546820
Lynch, K. (1960). The image of the city. Cambridge, Massachusetts: MIT Press.
Meilinger, T., Schulte-Pelkum, J., Frankenstein, J., Berger, D., & Bülthoff, H. H. (2015). Global landmarks do not necessarily improve spatial performance in addition to bodily self-movement cues when learning a large-scale virtual environment. In M. Imura, P. Figueroa, & B. Mohler (Eds.), International Conference on Artificial Reality and Telexistence Eurographics Symposium on Virtual Environments. Retrieved from http:// www.kyb.mpg.de/fileadmin/user_upload/files/publications/2015/ICAT-EGVE-2015- Meilinger.pdf
Michon, P.-E., & Denis, M. (2001). When and why are visual landmarks used in giving directions? In D. R. Montello (Ed.), Spatial Information Theory (pp. 292–305). Berlin, Heidelberg: Springer Berlin Heidelberg.
Miller, J., & Carlson, L. (2011). Selecting landmarks in novel environments. Psychonomic Bulletin & Review, 18(1), 184–191. doi:10.3758/s13423-010-0038-9
Montello, D. R. (1998). A new framework for understanding thr acquisition of spatial knowl-edge in large-scale environments. In M. J. E. & R. G. Gollknowl-edge (Eds.), Spatial and Temporal
Reasoning in Geographic Information Systems (pp. 143–154). New York: Oxford University Press. doi:10.1088/1748-6041/6/2/025001
Nothegger, C., Winter, S., & Raubal, M. (2004). Selection of salient features for route directions. Spatial Cognition and Computation, 4(2), 113–136. doi:10.1207/s15427633scc0402
Philbeck, J. W., & O’Leary, S. (2005). Remembered landmarks enhance the precision of path integration. Psicologica, 26(1), 7–24.
Psarras, S., Fatah, A., Zarkali, A., & Hanna, S. (2019). Visual saliency in navigation: Modelling navigational behaviour using saliency and depth analysis. In Proceedings of 12th International Space Syntax Symposium. Beijing.
Quesnot, T., & Roche, S. (2015). Quantifying the significance of semantic landmarks in familiar and unfamiliar environments. In S. I. Fabrikant, M. Raubal, M. Bertolotto, C. Davies, S. Freundschuh, & S. Bell (Eds.), Spatial Information Theory (pp. 468–489). Cham, Switzerland: Springer International Publishing.
Raubal, M., & Winter, S. (2002). Enriching wayfinding instructions with local landmarks. In International Conference on Geographic Information Science (pp. 243–259). Springer Berlin Heidelberg. 10.1007/3-540-45799-2_17
Richter, K.-F., & Winter, S. (2014). Landmarks: GIScience for intelligent services. Cham, Berlin: Springer International Publishing. https://doi.org/10.1007/978-3-319-05732-3
Ruddle, R. A., Volkova, E., Mohler, B., & Bülthoff, H. H. (2011). The effect of landmark and body-based sensory information on route knowledge. Memory & Cognition, 39(4), 686–699. doi:10.3758/s13421-010-0054-z
Sadeghian, P., & Kantardzic, M. (2008). The new generation of automatic landmark detection systems: Challenges and guidelines. Spatial Cognition and Computation, 8(3), 252–287. doi:10.1080/13875860802039257
Schwering, A., Li, R., & Anacta, V. J. A. (2013). Orientation information in different forms of route instructions. In Short Paper Proceedings of the 16th AGILE Conference on Geographic Information Science, Leuven, Belgium. Leuven.
Siegel, A. W., & White, S. H. (1975). The development of spatial representations of large-scale environments. Advances in Child Development and Behavior, 10, 9–55. doi:10.1016/S0065- 2407(08)60007-5
Simonyan, K., & Zisserman, A. (2014). Very deep convolutional networks for large-scale image recognition. ICLR 2015. ArXiv, (1409), 1–14.
Sitzmann, V., Serrano, A., Pavel, A., Agrawala, M., Gutierrez, D., Masia, B., & Wetzstein, G. (2018). Saliency in VR: How do people explore virtual environments? IEEE Transactions on Visualization and Computer Graphics, 24(4), 1633–1642. doi:10.1109/TVCG.2018.2793599
Sorrows, M. E., & Hirtle, S. C. (1999). The nature of landmarks for real and electronic spaces. In International Conference on Spatial Information Theory (pp. 37–50). Springer Berlin Heidelberg. DOI:10.1007/3-540-48384-5
Stankiewicz, B. J., & Kalia, A. A. (2007). Acquistion of structural versus object landmark knowledge. Journal of Experimental Psychology. Human Perception and Performance, 33 (2), 378–390.
Steck, S. D., & Mallot, H. A. (2000). The role of global and local landmarks in virtual environment navigation. Presence: Teleoperators and Virtual Environments, 9(1), 69–83. doi:10.1162/105474600566628
Taluka, M., & Wilson, P. N. (1994). The effect of landmarks on route-learning in a computer-simulated environment. Journal of Environmental Psychology, 14(4), 305–313. Von Stülpnagel, R., & Frankenstein, J. (2015). Configurational salience of landmarks: An
analysis of sketch maps using Space Syntax. Cognitive Processing, 16(1), 437–441. doi:10.1007/s10339-015-0726-5
Wilson, P. N., Foreman, N., Gillett, R., & Stanton, D. (1997). Active versus passive processing of spatial information in a computer-simulated environment. Ecological Psychology, 9(3), 207–222. doi:10.1207/s15326969eco0903_3
Winter, S., Raubal, M., & Nothegger, C. (2005). Focalizing measures of salience for wayfinding. In Map-based Mobile Services: Theories, Methods and Implementations (pp. 125–139). Berlin, Heidelberg: Springer. doi:10.1007/3-540-26982-7_9
Winter, S., Tomko, M., Elias, B., & Sester, M. (2008). Landmark hierarchies in context. Environment and Planning. B, Planning & Design, 35(3), 381–398. doi:10.1068/b33106
Yesiltepe, D., Conroy Dalton, R., Ozbil Torun, A., Dalton, N., Noble, S., Hornberger, M., . . . Spiers, H. (2019). Usage of landmarks in virtual environments for wayfinding: Research on the influence of global landmarks. In 12th International Space Syntax Symposium (pp. 220–221, 220–10). Beijing.
Zetzsche, C., Schill, K., Deubel, H., Krieger, G., Umkehrer, E., & Beinlich, S. (1998). Investigation of a sensorimotor system for saccadic scene analysis: An integrated approach. In Proceedings of the Fifth International Conference on Simulation of Adaptive Behavior on From Animals to Animats 5 (pp. 120–126). Cambridge, MA, USA: MIT Press.
Appendix A. Saliency maps for level 31 and 32
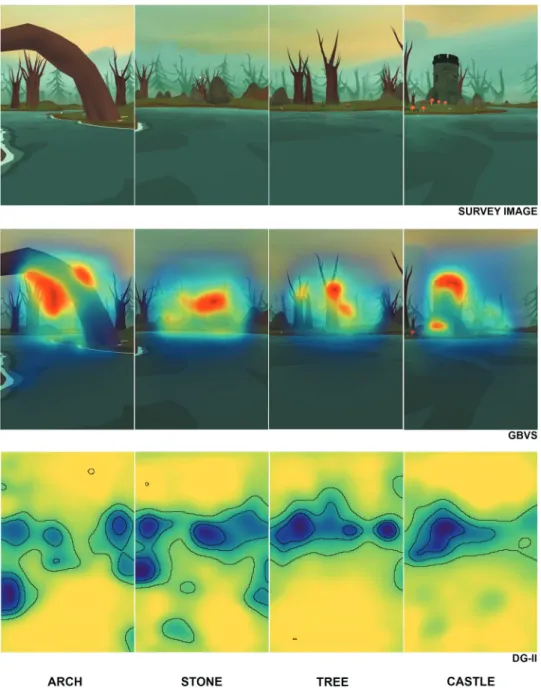
Next four figures (Figures A1–A4) show the results of the saliency models. Figure A1 and A2
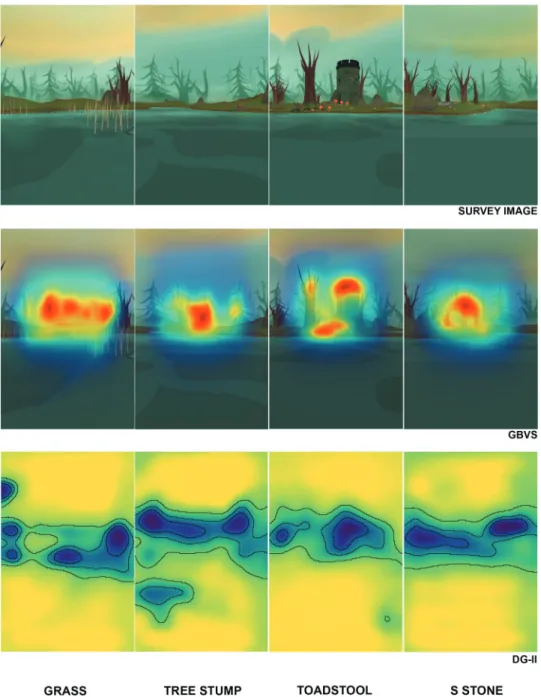
show the saliency maps of level 31 and the original images that are used in the study as well as the results of Gbvs and DeepGaze II models. Figure A3 shows the rest of the saliency maps from level 31 and the results of level 32 for three landmarks. It is followed by the fourth image,
A4, which shows the rest of the landmarks in level 32.
Figure A3. The maps that are produced from saliency models (Gbvs and DeepGaze II) for level 31 (plant) and level 32.