HAL Id: hal-01969037
https://hal.archives-ouvertes.fr/hal-01969037
Submitted on 13 Nov 2019
HAL is a multi-disciplinary open access
archive for the deposit and dissemination of
sci-entific research documents, whether they are
pub-lished or not. The documents may come from
teaching and research institutions in France or
abroad, or from public or private research centers.
L’archive ouverte pluridisciplinaire HAL, est
destinée au dépôt et à la diffusion de documents
scientifiques de niveau recherche, publiés ou non,
émanant des établissements d’enseignement et de
recherche français ou étrangers, des laboratoires
publics ou privés.
Recent Developments from Attribute Profiles for
Remote Sensing Image Classification
Minh-Tan Pham, Sébastien Lefèvre, Erchan Aptoula, Lorenzo Bruzzone
To cite this version:
Minh-Tan Pham, Sébastien Lefèvre, Erchan Aptoula, Lorenzo Bruzzone. Recent Developments from
Attribute Profiles for Remote Sensing Image Classification. International Conference on Pattern
Recognition and Artificial Intelligence, 2018, Montreal, Canada. �hal-01969037�
Recent Developments from Attribute Profiles
for Remote Sensing Image Classification
Minh-Tan Pham
IRISA - Universit´e Bretagne Sud UMR 6074, F-56000, Vannes, FranceErchan Aptoula
Institute of Information Technologies Gebze Technical University, 41400 Kocaeli, Turkey
S´ebastien Lef`evre
IRISA - Universit´e Bretagne Sud UMR 6074, F-56000, Vannes, France [email protected]Lorenzo Bruzzone
Dept. of Inf. Eng. Computer Science University of Trento, I-3812 Trento, ItalyAbstract—Morphological attribute profiles (APs) are among the most effective methods to model the spatial and contextual information for the analysis of remote sensing images, especially for classification task. Since their first introduction to this field in early 2010’s, many research studies have been contributed not only to exploit and adapt their use to different applications, but also to extend and improve their performance for better dealing with more complex data. In this paper, we revisit and discuss different developments and extensions from APs which have drawn significant attention from researchers in the past few years. These studies are analyzed and gathered based on the concept of multi-stage AP construction. In our experiments, a comparative study on classification results of two remote sensing data is provided in order to show their significant improvements compared to the originally proposed APs.
Index Terms—mathematical morphology, attribute profiles, multilevel image description, image classification, remote sensing
I. INTRODUCTION
Image classification is one of the most crucial tasks in remote sensing imagery which serves for several applications in land use and land cover mapping and monitoring. With the emergence of high resolution remote sensing technology, the exploitation of the spatial information together with the spectral characteristics becomes more and more significant to characterize and discriminate different thematic classes present from the image content. Within such spatial-spectral context, morphological profiles (MPs) [1] were extensively exploited during the 2000’s [2]–[5] thanks to their multilevel analysis of spatial information by applying a sequence of opening and closing by reconstruction operators with increasing-size structuring elements (SEs). However, their high computation complexity prevent them to deal with large-size images. Be-sides, SEs can only model the size and scale of regions without their gray-level characteristics, thus not considering contextual features such as texture and contrast.
To overcome the MPs’ shortcomings, morphological at-tribute profiles (APs) [6] were proposed in early 2010’s as their generalization and consist in applying a sequence of attribute
filters (AFs) which are more powerful than operators by reconstruction. These AFs can decompose the image according to different types of attribute (i.e. any geometric and statistical features of regions), not only restricted to the scale and size of SEs employed by MPs. Besides, the construction of APs can be efficiently implemented based on the hierarchical representation of image via tree structures (i.e. originally via min- and max-tree [6]), hence better dealing with large-size remote sensing images. Scalability is further ensured with parallel implementations [7].
In the past few years, a great number of research studies have been devoted to exploit and extend the use of APs applied to remote sensing image analysis, especially for classifica-tion task. These studies have been designed to improve the classification performance by focusing on the AP construction framework or adapting their use to different types of input data. In this paper, we conduct a survey on recent research studies that have been proposed and developed from the concept and application of APs. By decomposing the AP generation scheme into different stages, we regroup these studies into each specific stage in order to better provide an overview of their contribution to the general AP framework. We note that a recent survey [8] also exists but its contribution has focused only on the spatial-spectral approaches using different spectral feature extraction techniques and spatial processing by the standard APs [6]. Our survey involves more complete and detailed investigations of different developments and extensions from APs to improve their performance and optimize their construction framework.
We first recall the background of APs and highlights the key components from AP construction framework (Sec. II), before revisiting and discussing different developments from APs which have provided considerable contributions in the past few years (Sec. III). An experimental study (Sec. IV) provides a comparative evaluation of some extensions compared to the original APs by conducting supervised classification experi-ments on two remote sensing image data. We finally conclude the paper and indicate future research directions (Sec. V).
i i n CC p node w.r.t. 1 1 node w.r.t. i i n CC p p pixel ) ( ' image filtered X X k k
Ximage tree withattributeA pruned tree
100 52 39
19 20 9 8 44
A ≥ 10
tree construction attribute computation attribute filtering on tree image reconstruction
X
from tree
1 2 3 4
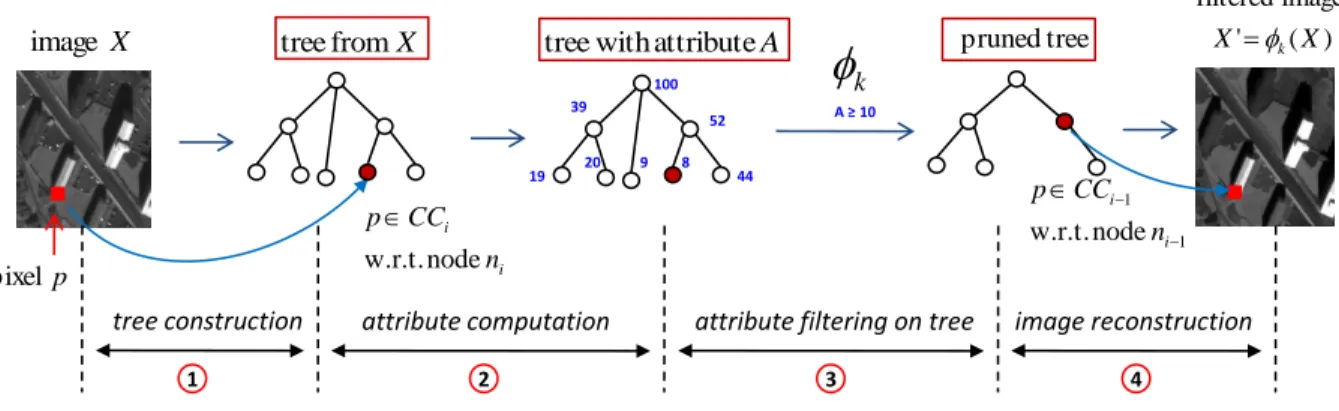
Fig. 1. The AP generation framework which involves four main stages: tree construction, attribute computation, tree-based attribute filtering (pruning) and image reconstruction from filtered (pruned) tree.
II. PRINCIPLE OFAPS
APs are multilevel image description tools obtained by suc-cessively applying a set of morphological attribute filters (AFs) [6]. Unlike usual image filtering operators which are directly performed on pixel level, AFs work on connected component (CC) level based on the concept of image connectivity. In other words, an AF is a filtering operator applied on CCs with regard to a specific attribute characterizing the size, shape, or other properties of objects and regions present in the image. That is why AFs are more general than operators by reconstruction (which are limited to the size and shape of SEs), and why APs are more general than MPs [1], [6].
The generation of the standard APs [6] from an input image can be summarized as a four-step framework (see Fig. 1):
1) construct the hierarchical tree to represent the image. In [6], the authors proposed to form one min-tree and one max-tree to encode the image;
2) compute some relevant attributes describing the geomet-rical and statistical features from each tree’s node which corresponds to one connected component;
3) filter the tree by keeping/removing nodes according to their attribute values compared to predefined thresholds; 4) reconstruct the image from the filtered tree.
Steps 3) and 4) can be done for different attributes (with different threshold values) to finally produce a set of filtered images (by stacking them) forming the final APs.
More formally, given a grayscale image X : E → Z, E ⊆ Z2, the standard generation of APs on X is achieved by applying a sequence of AFs based on a min-tree (attribute thickening operators {φk}Kk=1) and a max-tree (i.e. attribute
thinning operators {γk}Kk=1) as follows:
AP(X) =nφK(X), φK−1(X), . . . , φ1(X), X,
γ1(X), . . . , γK−1(X), γK(X)
o ,
(1)
where φk(X) is the filtered image obtained by applying the
attribute thickening φ with regard to the threshold k. Similar explanation is made for γk(X). As observed, the resulted
AP(X) is a stack of (2K + 1) images including the original
image, K filtered images from the thickening profiles and the other K from the thinning profiles.
III. RECENT ADVANCES FROMAPS
As described above, the construction of APs involves four main stages which are in fact the key components that have been focused for improvements by different literature studies within the past few years. In addition, since APs basically work on panchromatic images, some pre-processing or specific adaptation procedures are required when dealing with other input data (multi-channel images, radar data, etc.). Then, spatially post-processing the output profiles to increase their description capacity for classification has also drawn attention of researchers in several research studies.
We now revisit the recently proposed developments that have provided significant contributions to adapt and improve the AP framework for remote sensing image classification (Sec. III-A to Sec. III-E). Here, our investigation will focus on three main key features:
• the adaptation of APs to other input data, in particularly to multi-channel images (Sec. III-A);
• the construction of APs using various tree representation
structures (Sec. III-B);
• the AP post-processing using different feature
enhance-ment techniques (III-E).
For other related extensions (Sec. III-C and Sec. III-D), we provide standard concepts and refer readers to the related references for further details.
A. Input data
Since APs were originally proposed to deal with panchro-matic images [6], their adaptation to other kinds of remote sensing data becomes quite significant. In particular, the ap-plication of APs to the classification of multi-channel images (multispectral and hyperspectral) has become one of the hottest research topics in this field. The idea is to perform a spatial-spectral approach for classification by combining rich spatial-spectral information from these data with efficient spatial modeling capacity of APs.
The standard extension of APs on hyperspectral images was proposed in [9] by first applying the principal component analysis (PCA) on the image and then extracting APs from some first principal components. The advantage of PCA is that this low-complexity technique can compress most spectral information from the hyperspectral image into only some first principal components. Hence, applying APs on these components may perform a basic spectral-spatial feature ex-traction of the data. Other alternatives have been proposed to replace the PCA with the independent component analysis (ICA) [10], the kernel PCA (KPCA) [11] or other supervised methods such as the discriminant analysis feature extraction (DAFE) [12], the non-parametric weighted feature extraction (NWFE) [13], Sparse Hilbert Schmidt Independence Criterion and surrogate kernel (HSIC) [14], etc. These methods can capture more spectral relations among hyperspectral bands and hence provide better spectral information than the PCA.
Recently, the vector strategy [15] has been investigated to effectively adapt APs on multispectral and hyperspectral image. The motivation of that work is to replace the marginal strategy, i.e. independently applying APs on each image band (or each component yielded by the aforementioned feature ex-traction methods) and stacking them to form the extended APs, with the vector strategy which can simultaneously process all available bands based on predefined vector-ordering relations. As a result, tree construction can be done once per multivariate image and the proposed vector APs (VAPs) become promising to deal with such hyperspectral data.
While the application of APs to optical remote sensing data has been strongly focused on, their exploitation to other remote sensing data is quite limited. One may witness some tentative work on polarimetric SAR images [16], multispectral image derived features such as NDVI [17] or edge information [7] as well as on LiDAR data [17], [18]. This is still an opened topic for on-going and future research in remote sensing imagery field.
B. Tree formation
Tree formation is the first principal stage of the AP con-struction framework (Fig. 1). As described in Sec. II, the standard APs [6] were computed based on one max-tree and one min-tree (i.e. both are component trees). Other work has been proposed to exploit the inclusion tree (i.e. tree of shapes) [19] in order to form the self-dual APs (SDAPs). The advantages of using such a tree of shapes are twofold. First, its self-dual property enables the attribute filtering operators to simultaneously access and model both dark and bright regions from the image. And secondly, by using only one tree of shapes to replace both min-tree and max-tree [6], the feature dimension of SDAPs is reduced to half of that of APs. Consequently, SDAPs have been proved to be more efficient than APs in many research studies [13], [19], [20].
Since the above component and inclusion trees both rely on an ordering relation of the image pixels, their construction from multivariate images (e.g. multi- and hyperspectral data) is not straightforward. That is why the authors in [21] have
recently investigated and proposed to use the partition trees such as α-tree and ω-tree to compute the α-APs, ω-APs, respectively. These profiles have been proved to provide fair performance compared to the standard APs. Moreover, they offer the possibility to work on multivariate images only using a single tree. Furthermore, it is also possible to rely on training samples to perform metric learning so as to provide the basic elements required for a partitioning tree [22].
C. Node attributes and threshold selection
The selection of tree node attributes as well as their thresh-olds for filtering on tree plays also an important role. Node attributes are usually related to the geometrical (such as size, shape) and statistical features (pixel distribution, texture, etc.) of the CC corresponding to the node. In the literature, four attributes have been used in most studies related to remote sensing image classification: area, standard deviation, moment of inertia, diagonal length of bounding box.
After deciding which attributes to calculate from nodes, the setting of their threshold values has been also concerned. Early work [6], [10], [19] usually set attribute thresholds manually based on experiments on some specific image data. However, since those values might be not applicable to other data, automatic threshold selection has drawn attention from many researchers. Some interesting studies have been proposed to automatically compute attribute thresholds using fixed formu-las [23], [24], supervised approaches [25], [26] as well as granulometric characteristic functions [27], [28]. Readers are referred to the mentioned papers for further details about these attribute selection strategies.
D. Tree filtering
Once the tree is formed and the attributes together with their thresholds are selected, the next stage is to evaluate each node in order to filter (i.e prune) the tree. Basically, there are two filtering rules including the pruning strategy (min, max, Viterbi decision rules) and the non-pruning strategy (direct, subtractive rules) [6]. Studies on the effect of different filtering rules have been done by [20], [29].
E. Post-processing of output profiles
The output AP features, i.e. sequence of filtered images in Eq. (1), can be directly fed into supervised classifiers such as SVM or Random Forest for classification task. Such direct application has provided better performance compared to MPs [1] in terms of classification accuracy as well as computa-tional cost. However, since APs still involve quite redundant information within their high-dimension features, the post-processing of these profiles to improve their performance has been addressed in several studies. First and foremost, many studies have proposed to apply different feature selection techniques on APs to extract highly informative features and reduce their dimension. In [11], [12], [24], both linear (PCA, ICA) and nonlinear methods (ICA, KPCA, DAFE, DBFE, NWFE, etc.) have been investigated. A general framework as well as a systematic survey on spatial-spectral approaches
combining APs with these feature selection techniques have been investigated in [8].
Other work has focused on extra spatial processing of APs for better characterization of structural and textural informa-tion from the image content. Recent studies believe that when dealing with VHR remote sensing images from which regions and objects become more heterogeneous, APs may not provide a complete spatial characterization of pixels. Therefore, some efforts have been proposed to replace each AP sample response by the histogram or some first-order statistical features of the local patch around that AP’s pixel position. As a result, the local histogram-based APs (HAPs) [30], [31] and the local feature-based APs (LFAPs) [32], [33] have been proposed and proved to be more efficient for better dealing with local textures. Then, the extensions of these extra spatial processing methods on the self-dual profiles (using the tree of shapes) as well as on hyperspectral images have been provided [32].
Last but not least, we refer readers to some other frame-works using the sparse representation [34] or the deep learning approach [35] for post-processing of AP features. Also, some ensemble methods [36], [37] have been applied to better exploit and combine AP features to improve the classification performance.
IV. EXPERIMENTAL STUDY
This section describes our experimental study to evaluate the performance of the standard APs as well as some of their improvements and extensions. Supervised classification has been carried out on both panchromatic and hyperspectral image data in order to provide a comparative study. We first introduce the two data sets and the experimental setup. Then, classification results will be provided.
A. Data description
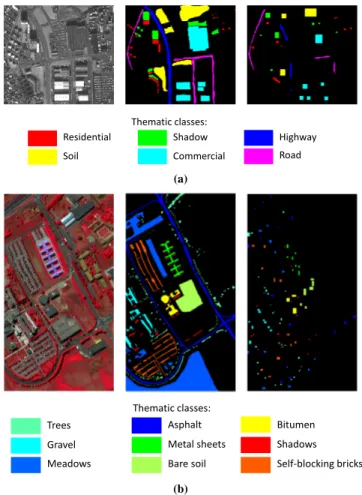
1) Reykjavik data set: The first data set is a panchromatic image of size 628 × 700 pixels acquired by the IKONOS Earth imaging satellite with 1-m resolution in Reykjavik, Iceland. This data consists of six thematic classes including residential, soil, shadow, commercial, highway and road. The image was provided with already-split training and test sets (22741 training samples and 98726 test samples). The input image together with its thematic ground truth map for testing and training sets are shown in Fig. 2(a).
2) Pavia University data set: The second data set is the hyperspectral image acquired by the ROSIS airborne sensor with 1.3-m spatial resolution over the region of Pavia Uni-versity, Italy. The image consists of 610 × 340 pixels with 103 spectral bands (from 0.43 to 0.86 µm) and covers nine thematic classes: trees, asphalt, bitumen, gravel, metal sheets, shadows, meadows, self-blocking bricks and bare soil. For this image, 3921 training samples and 42776 test samples were split for classification task. The false-color image (made by combining the bands 31, 56 and 102), the ground truth map and the training set are shown in Fig. 2(b). As previously discussed, for this data set, we first performed the PCA on the image and the first four PCs (involving more than 99% of the total variance) were preserved for our experiments.
Residential Thematic classes: Soil Shadow Commercial Highway Road (a) Trees Thematic classes: Gravel Asphalt Metal sheets Bitumen Shadows Meadows Bare soil Self-blocking bricks
(b)
Fig. 2. Two data sets used in our experimental study. (a) The 628 × 700 Reykjavik data (left to right: panchromatic, thematic ground truth with 6 classes and training set); (b) The 610 × 340 Pavia University data (left to right: false-color image made by bands 31-56-102, ground truth including nine thematic classes and training set).
B. Setup
Supervised classification was conducted on the two data sets using the random forest classifier [38] with 100 trees. The number of variables involved in the training was set to the square root of the feature vector length. In order to evaluate and compare classification accuracy of different approaches, overall accuracy (OA), average accuracy (AA), and kappa coefficient (κ) have been taken into account. For attribute filtering, we exploited two attributes including the area and the moment of inertia. Ten area thresholds were adopted for the Reykjavik data as proposed by several papers [20], [39], [40]. For the Pavia University data, fourteen thresholds were automatically computed according to [24]. We have:
λa,Rey= {25, 100, 500, 1000, 5000, 10000,
20000, 50000, 100000, 150000}, λa,P av= {770, 1538, 2307, 3076, 3846, 4615, 5384,
6153, 6923, 7692, 8461, 9230, 10000, 10769}. Next, the manual settings used in many studies [9], [13], [15] were adopted for the moment of inertia attribute as follows:
In the following subsection, we report and compare the clas-sification results yielded by the APs generated from different kinds of tree including: the max-tree (AP-maxT), the min-tree (AP-minT), one max-tree and one min-tree (standard APs) [6], the SDAPs [19], the α-APs and ω-APs [21]. We also provide the results of some effective post-processing tech-niques including the HAPs/HSDAPs [30], LFAPs/LFSDAPs [32] and the deep learning approach (deep-APs) [35]. Then, for the hyperspectral Pavia data, VAPs [15] are evaluated as well. Here, we perform standard implementation as well as equivalent parameter configuration of these methods to ensure a fair comparison.
C. Results
Tables I and II report the classification results of the Reyk-javik and the Pavia data, respectively, yielded by the above mentioned methods. The calculation of each method’s feature dimension can be consulted from the related papers. Here, we provide some remarks in terms of classification performance. For both data sets, we observe that those extension methods can provide extra classification accuracy compared to the standard APs but behave differently for each image.
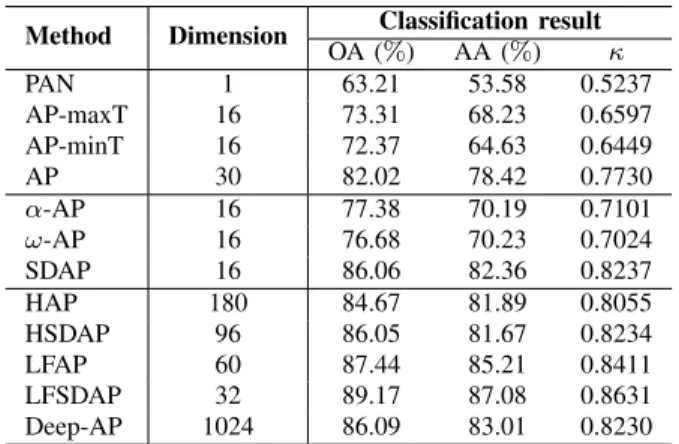
TABLE I
CLASSIFICATION RESULT OF THEREYKJAVIK DATA OBTAINED BY DIFFERENT METHODS USINGRANDOMFOREST WITH100TREES.
Method Dimension Classification result OA (%) AA (%) κ PAN 1 63.21 53.58 0.5237 AP-maxT 16 73.31 68.23 0.6597 AP-minT 16 72.37 64.63 0.6449 AP 30 82.02 78.42 0.7730 α-AP 16 77.38 70.19 0.7101 ω-AP 16 76.68 70.23 0.7024 SDAP 16 86.06 82.36 0.8237 HAP 180 84.67 81.89 0.8055 HSDAP 96 86.05 81.67 0.8234 LFAP 60 87.44 85.21 0.8411 LFSDAP 32 89.17 87.08 0.8631 Deep-AP 1024 86.09 83.01 0.8230
For Reykjavik image, efforts on changing the tree formation have provided some considerable effects. Indeed, the α-APs and ω-APs could outperform APs on each single max-tree or min-tree but still falls below the standard APs. Then, by using the tree of shapes, SDAPs significantly improved the accuracy with approximately 4% in OA (86.06% compared to 82.02%) and 5% in κ (0.824 compared to 0.773). Next, by post-processing the output profiles, techniques like HAP, LFAP and deep-AP have also provided important improvements. Consequently, the best classification result was obtained by using the local feature-based profiles with OA = 87.44% (κ = 0.841) using min-tree and max-tree (LFAP) and OA = 89.17% (κ = 0.863) using the tree of shapes (LFSDAP). Compared to the standard APs, an OA enhancement of 5.42% and 7.15%, respectively, was achieved.
For the hyperspectral Pavia data, we observe that APs built from different tree structures yielded different behaviors
TABLE II
CLASSIFICATION RESULT OF THEPAVIAUNIVERSITY DATA OBTAINED BY DIFFERENT METHODS USINGRANDOMFOREST WITH100TREES.
Method Dimension Classification result OA (%) AA (%) κ 4 PCs 4 70.62 80.37 0.6375 AP-maxT 80 83.66 88.52 0.7936 AP-minT 80 81.48 86.11 0.7596 AP 152 91.66 93.96 0.8891 SDAP 80 94.28 93.96 0.9234 α-AP 80 94.52 94.11 0.9293 ω-AP 80 96.10 95.66 0.9403 HAP 912 94.14 94.40 0.9234 HSDAP 480 94.53 92.64 0.9266 LFAP 304 93.57 93.50 0.9149 LFSDAP 160 95.25 94.49 0.9363 VAP 152 96.30 95.64 0.9500 Deep-AP 1024 99.02 98.54 0.9790
compared to the Reykjavik image. This time, the α-APs and ω-APs outperformed both APs and SDAPs. In particular, by using the ω-tree, one can achieve an OA = 96.10%, i.e. 4.44% and 1.82% better than standard APs and SDAPs, respectively. For post-processing methods, VAPs and deep-APs provided better performance compared to HAPs and LFAPs. These methods have been proved to be efficient within a spatial-spectral context usually applied to hyperspatial-spectral data. As a result, the best classification accuracy was achieved by deep-APs with OA = 99.02% and κ = 0.979. Compared to the standard APs, an enhancement of 7.36% in OA and 9% in κ was adopted.
V. CONCLUSION
We have conducted a survey on recent developments from morphological attribute profiles in the context of remote sensing image classification. Three key components have been focused including the AP adaptation on multi-channel image data, the use of different tree representations and the various AP post-processing procedures. Experimental study on one panchromatic and one hyperspectral image has been performed to provide a general evaluation of different methods compared to the original framework. This paper may serve as an overview of AP recent advances to readers as well as a guidance to researchers working on this framework and its alternatives within their work. We believe the exploitation and adaptation of APs in remote sensing imagery still remains an open research topic for on-going as well as future work.
ACKNOWLEDGMENT
This work was supported the R´egion Bretagne grant and the BAGEP Award of the Science Academy and the Tubitak grant 115E857. The authors would like to thank Prof. Jon Atli Benediktsson and Prof. Paolo Gamba for making available the Reykjavik image and the hyperspectral Pavia University data.
REFERENCES
[1] M. Pesaresi and J. A. Benediktsson, “A new approach for the morpho-logical segmentation of high-resolution satellite imagery,” IEEE Trans. Geosci. Remote Sens., vol. 39, no. 2, pp. 309–320, 2001.
[2] A. Plaza, P. Martinez, R. Perez, and J. Plaza, “A new approach to mixed pixel classification of hyperspectral imagery based on extended morphological profiles,” Pattern Recogn., vol. 37, no. 6, pp. 1097–1116, 2004.
[3] J. A. Palmason, J. A. Benediktsson, J. R. Sveinsson, and J. Chanussot, “Classification of hyperspectral data from urban areas using morpholog-ical preprocessing and independent component analysis,” in Proc. IEEE IGARSS, vol. 1, 2005, pp. 176–179.
[4] J. A. Benediktsson, J. A. Palmason, and J. R. Sveinsson, “Classification of hyperspectral data from urban areas based on extended morphological profiles,” IEEE Trans. Geosci. Remote Sens., vol. 43, no. 3, pp. 480–491, 2005.
[5] M. Fauvel, J. A. Benediktsson, J. Chanussot, and J. R. Sveinsson, “Spectral and spatial classification of hyperspectral data using svms and morphological profiles,” IEEE Trans. Geosci. Remote Sens., vol. 46, no. 11, pp. 3804–3814, 2008.
[6] M. Dalla Mura, J. A. Benediktsson, B. Waske, and L. Bruzzone, “Morphological attribute profiles for the analysis of very high resolution images,” IEEE Trans. Geosci. Remote Sens., vol. 48, no. 10, pp. 3747– 3762, 2010.
[7] F. Merciol, T. Balem, and S. Lef`evre, “Efficient and large-scale land cover classification using multiscale image analysis,” in ESA Conf. on Big Data from Space (BiDS), 2017.
[8] P. Ghamisi, M. Dalla Mura, and J. A. Benediktsson, “A survey on spectral–spatial classification techniques based on attribute profiles,” IEEE Trans. Geosci. Remote Sens., vol. 53, no. 5, pp. 2335–2353, 2015. [9] M. Dalla Mura, J. Atli Benediktsson, B. Waske, and L. Bruzzone, “Extended profiles with morphological attribute filters for the analysis of hyperspectral data,” Int. J. Remote Sens., vol. 31, no. 22, pp. 5975–5991, 2010.
[10] M. Dalla Mura, A. Villa, J. A. Benediktsson, J. Chanussot, and L. Bruzzone, “Classification of hyperspectral images by using extended morphological attribute profiles and independent component analysis,” IEEE Geosci. Remote Sens. Lett., vol. 8, no. 3, pp. 542–546, 2011. [11] S. Bernabe, P. R. Marpu, A. Plaza, M. Dalla Mura, and J. A.
Benedikts-son, “Spectral–spatial classification of multispectral images using kernel feature space representation,” IEEE Geosci. Remote Sens. Lett., vol. 11, no. 1, pp. 288–292, 2014.
[12] P. R. Marpu, M. Pedergnana, M. Dalla Mura, S. Peeters, J. A. Benedik-tsson, and L. Bruzzone, “Classification of hyperspectral data using extended attribute profiles based on supervised and unsupervised feature extraction techniques,” Int. J. Image Data Fusion, vol. 3, no. 3, pp. 269– 298, 2012.
[13] G. Cavallaro, M. Dalla Mura, J. A. Benediktsson, and L. Bruzzone, “Ex-tended self-dual attribute profiles for the classification of hyperspectral images,” IEEE Geosci. Remote Sens. Lett., vol. 12, no. 8, pp. 1690–1694, 2015.
[14] B. B. Damodaran, N. Courty, and S. Lef`evre, “Sparse hilbert schmidt independence criterion and surrogate-kernel-based feature selection for hyperspectral image classification,” IEEE Trans. Geosci. Remote Sens., vol. 55, no. 4, pp. 2385–2398, 2017.
[15] E. Aptoula, M. Dalla Mura, and S. Lef`evre, “Vector attribute profiles for hyperspectral image classification,” IEEE Trans. Geosci. Remote Sens., vol. 54, no. 6, pp. 3208–3220, 2016.
[16] P. R. Marpu, K.-S. Chen, C.-Y. Chu, and J. A. Benediktsson, “Spectral-spatial classification of polarimetric SAR data using morphological profiles,” in Synthetic Aperture Radar (APSAR), 2011 3rd Int. Asia-Pacific Conf., 2011, pp. 1–3.
[17] B. B. Damodaran, J. H¨ohle, and S. Lef`evre, “Attribute profiles on derived features for urban land cover classification,” Photogrammetric Engineering & Remote Sensing, vol. 83, no. 3, pp. 183–193, 2017. [18] M. Pedergnana, P. R. Marpu, M. Dalla Mura, J. A. Benediktsson, and
L. Bruzzone, “Classification of remote sensing optical and lidar data using extended attribute profiles,” IEEE J. Sel. Topics Sig. Proc., vol. 6, no. 7, pp. 856–865, 2012.
[19] M. Dalla Mura, J. Benediktsson, and L. Bruzzone, “Self-dual attribute profiles for the analysis of remote sensing images,” in Int. Symp. Math. Morpho. Appl. Sig. Image Proc., 2011, pp. 320–330.
[20] G. Cavallaro, M. Dalla Mura, J. A. Benediktsson, and A. Plaza, “Remote sensing image classification using attribute filters defined over the tree of shapes,” IEEE Trans. Geosci. Remote Sens., vol. 54, no. 7, pp. 3899– 3911, 2016.
[21] P. Bosilj, B. B. Damodaran, E. Aptoula, M. Dalla Mura, and S. Lef`evre, “Attribute profiles from partitioning trees,” in Int. Symp. Math. Morpho. Its Appl. Sig. Image Proc., 2017, pp. 381–392.
[22] S. Lef`evre, L. Chapel, and F. Merciol, “Hyperspectral image classi-fication from multiscale description with constrained connectivity and metric learning,” in IEEE Wksh. Hyper. Image and Sig. Proc.: Evol. Remote Sens. (WHISPERS), 2014, pp. 1–4.
[23] P. R. Marpu, M. Pedergnana, M. Dalla Mura, J. A. Benediktsson, and L. Bruzzone, “Automatic generation of standard deviation attribute profiles for spectral–spatial classification of remote sensing data,” IEEE Geosci. Remote Sens. Lett., vol. 10, no. 2, pp. 293–297, 2013. [24] P. Ghamisi, J. A. Benediktsson, and J. R. Sveinsson, “Automatic
spectral–spatial classification framework based on attribute profiles and supervised feature extraction,” IEEE Trans. Geosci. Remote Sens., vol. 52, no. 9, pp. 5771–5782, 2014.
[25] Z. Mahmood, G. Thoonen, and P. Scheunders, “Automatic threshold selection for morphological attribute profiles,” in Proc. IEEE IGARSS, 2012, pp. 4946–4949.
[26] M. Pedergnana, P. R. Marpu, M. Dalla Mura, J. A. Benediktsson, and L. Bruzzone, “A novel technique for optimal feature selection in attribute profiles based on genetic algorithms,” IEEE Trans. Geosci. Remote Sens., vol. 51, no. 6, pp. 3514–3528, 2013.
[27] G. Cavallaro, N. Falco, M. Dalla Mura, L. Bruzzone, and J. A. Benediktsson, “Automatic threshold selection for profiles of attribute filters based on granulometric characteristic functions,” in Int. Symp. Math. Morpho. Its Appl. Sig. Image Proc., 2015, pp. 169–181. [28] G. Cavallaro, N. Falco, M. Dalla Mura, and J. A. Benediktsson,
“Automatic attribute profiles,” IEEE Trans. Image Processing, vol. 26, no. 4, pp. 1859–1872, 2017.
[29] G. Cavallaro, M. Dalla Mura, J. A. Benediktsson, and L. Bruzzone, “A comparison of self-dual attribute profiles based on different filter rules for classification,” in Proc. IEEE IGARSS, 2014, pp. 1265–1268. [30] B. Demir and L. Bruzzone, “Histogram-based attribute profiles for
classification of very high resolution remote sensing images,” IEEE Trans. Geosci. Remote Sens., vol. 54, no. 4, pp. 2096–2107, 2016. [31] R. Battiti, B. Demir, and L. Bruzzone, “Compressed histogram attribute
profiles for the classification of VHR remote sensing images,” in SPIE Remote Sens., 2015, pp. 96 430R–96 430R.
[32] M.-T. Pham, S. Lef`evre, and E. Aptoula, “Local feature-based attribute profiles for optical remote sensing image classification,” IEEE Trans. Geosci. Remote Sens., vol. 56, no. 2, pp. 1199–1212, 2018.
[33] M.-T. Pham, S. Lef`evre, E. Aptoula, and B. B. Damodaran, “Classifica-tion of VHR remote sensing images using local feature-based attribute profiles,” in Proc. IEEE IGARSS, 2017, pp. 1083–1086.
[34] B. Song, J. Li, M. Dalla Mura, P. Li, A. Plaza, J. M. Bioucas-Dias, J. A. Benediktsson, and J. Chanussot, “Remotely sensed image classification using sparse representations of morphological attribute profiles,” IEEE Trans. Geosci. Remote Sens., vol. 52, no. 8, pp. 5122–5136, 2014. [35] E. Aptoula, M. C. Ozdemir, and B. Yanikoglu, “Deep learning with
attribute profiles for hyperspectral image classification,” IEEE Geosci. Remote Sens. Lett., vol. 13, no. 12, pp. 1970–1974, 2016.
[36] J. Xia, M. Dalla Mura, J. Chanussot, P. Du, and X. He, “Random subspace ensembles for hyperspectral image classification with extended morphological attribute profiles,” IEEE Trans. Geosci. Remote Sens., vol. 53, no. 9, pp. 4768–4786, 2015.
[37] R. Bao, J. Xia, M. Dalla Mura, P. Du, J. Chanussot, and J. Ren, “Combining morphological attribute profiles via an ensemble method for hyperspectral image classification,” IEEE Geosci. Remote Sens. Lett., vol. 13, no. 3, pp. 359–363, 2016.
[38] A. Liaw, M. Wiener et al., “Classification and regression by random-Forest,” R news, vol. 2, no. 3, pp. 18–22, 2002.
[39] M.-T. Pham, E. Aptoula, and S. Lef`evre, “Feature profiles from attribute filtering for remote sensing image classification,” IEEE J. Sel. Topics Appl. Earth Observations Remote Sens., vol. 11, no. 1, pp. 249–256, 2018.
[40] P. Ghamisi, R. Souza, J. A. Benediktsson, X. X. Zhu, L. Rittner, and R. A. Lotufo, “Extinction profiles for the classification of remote sensing data,” IEEE Trans. Geosci. Remote Sens., vol. 54, no. 10, pp. 5631–5645, 2016.