HAL Id: tel-01130838
https://pastel.archives-ouvertes.fr/tel-01130838
Submitted on 12 Mar 2015
HAL is a multi-disciplinary open access
archive for the deposit and dissemination of sci-entific research documents, whether they are pub-lished or not. The documents may come from teaching and research institutions in France or
L’archive ouverte pluridisciplinaire HAL, est destinée au dépôt et à la diffusion de documents scientifiques de niveau recherche, publiés ou non, émanant des établissements d’enseignement et de recherche français ou étrangers, des laboratoires
Three Essays on Financial Innovation
Boris Vallée
To cite this version:
Boris Vallée. Three Essays on Financial Innovation. Business administration. HEC, 2014. English. �NNT : 2014EHEC0008�. �tel-01130838�
! ! ! !! ! ! ! ! ECOLE%DES%HAUTES%ETUDES%COMMERCIALES%DE%PARIS% Ecole%Doctorale%«%Sciences%du%Management/GODI%»%B%ED%533% Gestion%Organisation%%Décision%Information% "Three%Essays%on%Financial%Innovation.
”%
THESE% présentée%et%soutenue%publiquement%le%25%juin%2014% en%vue%de%l’obtention%du%DOCTORAT%EN%SCIENCES%DE%GESTION%
Par%Boris%VALLEE%
JURY%
Président%du%Jury%:% % Monsieur%Marcin%KACPERCZYK% Professeur% Imperial%College,%Londres%–%UK% % % Directeur%de%Recherche%: Monsieur%Ulrich%HEGE%%% % % % % Professeur% % % % % HEC%%Paris%–%France% % CoBDirecteur%de%Recherche%: % Monsieur%Christophe%PERIGNON%%% % % % % Professeur%Associé,%HDR% % % % % HEC%%Paris%–%France% % % % % % % Rapporteurs%: Monsieur%JeanBCharles%ROCHET% % % % % Professeur% Université%de%Zurich%–%Suisse% % Madame%Paola%Sapienza%! % % % % Professeur%%% % % % % Kellogg%School%of%Management,%% Northwestern%University,%Illinois%–%USA% % % % % % % Suffragants%: Monsieur%Laurent%CALVET% Professeur% HEC%%Paris%–%France% % % % % Monsieur%Guillaume%PLANTIN% % % % % Professeur%% Université%de%Toulouse%Capitole%1–%France%% % Monsieur%David%THESMAR% Professeur,%HDR%% % %%%%%%%%%%%%%%%%% % % % % % % Ecole%des%Hautes%Etudes%Commerciales% Le%Groupe%HEC%Paris%n’entend%donner%aucune%approbation%ni%improbation%aux%% opinions%émises%dans%les%thèses%;%ces%opinions%doivent%être%considérées%% comme%propres%à%leurs%auteurs.%
Three Essays on Financial
Innovation
Ph.D. dissertation submitted by:
Boris Vall´
ee
Committee Members: Advisors: Laurent Calvet
Ulrich Hege, Research Director Christophe P´erignon, Co-Director
David Thesmar External Members:
Marcin Kacperczyk (Imperial College) Guillaume Plantin (Toulouse School of Economics)
Jean-Charles Rochet (University of Zurich) Paola Sapienza (Northwestern University)
Acknowledgements
It is not so much our friends’ help that helps us as the confident knowledge that they will help us. (Epicurus)
Writing this dissertation has been a tremendous educational experience and a reward-ing chapter in my professional development. This success would by no mean have been possible without the help and support of all the people around me during these five years, both in my professional and personal sphere. Now is the time to thank them!
First let me thank the members of my committee, who greatly contributed to the suc-cess of this dissertation. I am forever endebted to Ulrich Hege for his attentive guidance and encouragements, and for advising me to do a Ph.D. in the first place. I am deeply thankful to David Thesmar, who was always available and helped me raise the bar every time we met. I warmly thank Laurent Calvet for his help and advice, and look forward to working on our future common project. Last but not least, I am grateful to Christophe P´erignon for educating me about how the academic world works.
I am thankful to Marcin Kasperczyk, Guillaume Plantin, Jean-Charles Rochet and Paola Sapienza for accepting to take part in my dissertation committee. I look forward to hearing their feedback and hope to continue having fruitful exchanges with them in the future. I am grateful to all the members of the Finance department at HEC Paris for their generous feedback (with a special thank you to Thierry Foucault and Johan Hombert), and to Josh Rauh and Manju Puri for welcoming me at Northwestern University and Duke University. I enjoyed the companionship of my fellow Ph.D. candidates along the five years in HEC: Michael, Hedi, Olivier, Jerome, Jean-Noel, Adrien and Alina, to name only a few. I will miss our tiny office and discussions! I also thank the HEC Foundation for funding my scholarship, Lexifi and Jean-Marc Eber for his interest in my research, and Europlace and IFSID for their research grant.
pro-ductive collaboration that played a key role in the success of my PhD. Two papers so far and counting!
My most sincere gratitude goes to my family, who instilled in me a love of knowledge and a penchant for analytical thought: my parents Anne-Marie and Serge, my sister Axelle, and my brother Gildas. I also thank my friends, who sometimes teased me, of-ten helped me, and always encouraged me: Antoine, Cl´ement, Fabrice, Francois, Julien, Vanessa and Vince, to name only a few.
I dedicate this thesis to Anna, who brought a superior meaning to my visiting schol-arship in Chicago, and to all the e↵orts made in general.
Introduction
I cannot understand why people are frightened of new ideas. I’m frightened of the old ones. [John Cage, Composer]
Innovation is the introduction and development of new ideas, devices or methods. As in other fields, innovation in finance has been questioned on whether it represents progress. Warren Bu↵et, in the Berkshire Hathaway annual report for 2002, famously declared: ”Derivatives are financial weapons of mass destruction.” Analyzing both the motives and e↵ects of financial innovation is key for gaining a better understanding of its role in our society, and whether financial innovation can help improving welfare (Allen (2011)).
Financial innovation has been a fundamental companion of economic development over the centuries, under many di↵erent forms. The introduction of new payment meth-ods (from the invention of coins in the seventh century BC, to mobile phone payment in the 21st century), new asset classes (from stocks to cat bonds or Exchange Traded Funds), new services (from the deposit bank in the 16th century to online banking and crowdfunding), new processes (credit scoring, asset structuring and pricing), or new play-ers (Venture Capital, Shadow banks, Hedge Funds) have fundamentally changed the role and the scope of the finance sector. These innovations have therefore had a profound impact on our economies and societies. The invention of currency, for instance, led to the development of cities and the division of labor in the Mesopotamia of the 7th century before JC. In 13th century China, economy and war funding was eased by the inven-tion of paper money, or banknotes. The inveninven-tion of banks allowed the development of
Florence and Genova during the 17th century. More recently, micro-credit, invented by Peace Nobel Laureate Mohammed Yunus, has made it possible for millions of people to borrow and develop an economic activity.
Despite these examples, the strict identification of financial innovation presents a chal-lenge, as patents are almost non-existent in an industry that works on an intangible good: money. It is difficult to measure to what extent a new type of contract or idea corre-sponds to a breakthrough or merely represents a marginal change. Despite this challenge, academics have pointed to an acceleration of financial innovation in the last decades and have subsequently sought to understand its impact. Tufano (2003) identifies the intro-duction of 1,836 distinct financial assets from 1980 to 2001. These introintro-ductions have come with a general suspicion towards financial innovation since the 2008 financial crisis. Innovative financial instruments such as Credit Default Swaps or mortgages securitization have indeed been pointed out as one of the main drivers of the crisis. More generally, the utility of financial innovation is being questioned, as illustrated by Paul Volcker’s fa-mous quote in 2009: “The only thing useful banks have invented in 20 years is the ATM.”
Empirically Investigating Financial Innovation
My dissertation studies recent episodes of financial innovation, with the ambition of understanding their motives and e↵ects. This research thread has led me to go beyond the methods and insights of a single subfield of finance, and to relate methods of cor-porate finance and banking with other fields including household finance, public finance, political economy, and industrial organization. Generally, no readily available datasets existed that allowed me to analyze the considered innovative financial products, so in each chapter the research design involves the construction of new datasets and of original variables measuring the scope and use of innovation.
A frequently debated consequence of financial innovation is the increasing complexity of financial instruments. Financial complexity may be used as a strategic tool by firms to increase search costs (Carlin (2009)), or to intentionally reset investors’ learning (Carlin and Manso (2011)). This chapter, entitled What Drives Financial Complexity? A Look into the Retail Market for Structured Products, empirically investigates these theoreti-cal insights on financial complexity in a competitive environment. Claire C´el´erier and I focus on the highly innovative retail market for structured products. We perform a lexicographic analysis of the term sheets of 55,000 retail structured products issued in Europe since 2002 and construct three indexes measuring complexity. These measures al-low us to observe that financial complexity has been steadily increasing, even during and after the recent financial crisis. We show that financial complexity is most prominently used by banks with the least sophisticated client base, and provide empirical evidence that intermediaries strategically use complexity to mitigate competitive pressure. First, complex products exhibit higher mark-ups and lower ex post performance than simpler products. Second, using issuance level data spanning 15 countries over the 2002-2010 period, we find that financial complexity increases when competition intensifies.
Innovative Borrowing Instruments in Public Finance
In 2001, to comply with Eurozone requirements, Greece entered into an OTC cross-currency swap transaction to hide a significant amount of its debt. In the chapter entitled Political Incentives and Financial Innovation: The Strategic Use of Toxic Loans by Local Authorities, Christophe P´erignon and I evidence the use of another form of hidden public debt by local governments: toxic loans. Using proprietary data, we show that politicians strategically use these products to increase chances of being re-elected. Consistent with greater incentives to hide the actual cost of debt, toxic loans are utilized at a signifi-cantly higher frequency within highly indebted local governments. Incumbent politicians from politically contested areas are also more likely to turn to toxic loans. Using a di↵erence-in-di↵erences methodology, we show that politicians time the election cycle by
implementing more transactions immediately before an election than after. Politicians are also found to exhibit herding behavior in this process. Our findings for the market of municipal financial products o↵er an example of a strategic use of financial innovation.
Financial Institutions and Contingent Capital
As part of the debate on bank leverage, Bolton and Samama (2012) propose an innova-tive solution to decrease financial distress costs associated with high leverage of financial institutions: Contingent Capital with an Option to Convert. In a third chapter entitled Call Me Maybe? The E↵ects of Exercising Contingent Capital, I study the market reac-tion and economic performance following the exercise of comparable contingent capital options embedded in bank capital instruments. During the financial crisis, European banks massively triggered option features of hybrid bonds they had issued in response to regulatory capital requirements in order to reduce their debt burden. This episode constitutes the first ”real-world” experiment of the use of contingent capital features. I find that these trigger events are positively received by credit markets, while stockholders discriminate according to the type of resulting debt relief and the financial institution leverage. Moreover, I document that banks that obtain regulatory debt relief by using the embedded trigger option exhibit higher economic performance than similar banks that do not. These findings point to the possible constructive role of innovative debt instruments as an e↵ective solution to the dilemma of bank capital regulation.
Introduction (En Fran¸cais)
Chapitre I
La complexit´e des produits financiers o↵erts aux m´enages a augment´e de fa¸con spec-taculaire au cours des vingt derni`eres ann´ees. Des produits innovants ont ´et´e d´evelopp´es pour l’actif et le passif -par exemple les fonds communs de placement, les cartes de cr´edit et les prˆets immobilier, bien que la sophistication financi`ere des m´enages reste faible (Lusardi and Tufano (2009b), Lusardi et al. (2010)). Y a-t-il une tendance actuelle `a l’augmentation de la complexit´e financi`ere des produits de d´etail? Le cas ´ech´eant, quelles sont les raisons de cette augmentation?
Pour r´epondre `a ces questions, nous nous concentrons sur un march´e sp´ecifique qui a connu une forte croissance dans la derni`ere d´ecennie: le march´e des produits structur´es pour particuliers. Nous d´eveloppons un indice de la complexit´e de ces produits, que nous appliquons `a une base de donn´ees couvrant 55.000 produits structur´es pour particuliers vendus en Europe. A l’aide de cet indice, nous observons que la complexit´e financi`ere a augment´e au fil du temps. Nous ´etudions plusieurs explications d’un point de vue de la demande pour ce fait stylis´e: une ´evolution des besoins et des pr´ef´erences, une tendance `a un plus grand partage des risques au sein des march´es financiers, et un motif de ”lotterie”. Nos observations ne corroborent que peu ces explications. Nous nous concentrons donc sur des explications du cˆot´e de l’o↵re, en particulier sur l’utilisation strat´egique de la complexit´e qui a ´et´e r´ecemment ´etudi´ee th´eoriquement (par exemple, Carlin (2009) et Carlin and Manso (2011)) et en organisation industrielle (Ellison (2005)
et Gabaix and Laibson (2006)). Nous trouvons des preuves coh´erentes avec les pr´edictions
th´eoriques des mod`eles supposant une intention d’augmentation des coˆuts de recherche ou
de discrimination par les prix. Tout d’abord, nous montrons que la complexit´e ´elev´ee des produits est associ´ee `a une plus grande rentabilit´e pour les banques, et des performances plus faibles pour les investisseurs. Deuxi`emement, en utilisant des donn´ees d’´emissions couvrant 15 pays sur la p´eriode 2002-2010, nous constatons que la complexit´e des produits financiers augmente lorsque la concurrence s’intensifie. Notre papier fournit le premier test empirique de la relation positive entre concurrence accrue et complexit´e croissante sur les march´es financiers, qui a ´et´e identifi´ee dans la litt´erature th´eorique (Carlin (2009)). Le premier objectif de cette ´etude est de mesurer l’augmentation de la complexit´e financi`ere aussi pr´ecis´ement que possible. Nous observons une tendance `a l’augmentation de la complexit´e financi`ere en examinant les prospectus de tous les produits structur´es pour particuliers ´emis en Europe depuis 2002 `a l’aide d’une analyse textuelle. Nous con-statons que cette tendance haussi`ere se poursuit mˆeme apr`es la crise financi`ere. Mesurer la complexit´e des produits d’une mani`ere pr´ecise et pertinente sur le march´e tr`es diver-sifi´e des produits structur´es pour particuliers repr´esente le premier d´efi de notre analyse empirique. Pour ce faire, nous d´eveloppons un algorithme qui balaie pour chaque pro-duit la description du calcul des flux, et identifie les caract´eristiques de ces formules. Nous d´efinissons le niveau de complexit´e d’un produit donn´e comme le nombre des car-act´eristiques d´efinissant cette formule. La logique de notre approche est que plus une formule comprend de caract´eristiques distinctes, plus elle est difficile `a comprendre et `a comparer pour l’investisseur. Nous utilisons aussi le nombre de caract`eres utilis´es dans la description de la formule des flux, ainsi que le nombre de sc´enarios possibles, comme des tests de robustesse de notre mesure de complexit´e. L’observation de la hausse de la complexit´e au fil du temps est commune `a ces trois mesures de complexit´e.
Le deuxi`eme objectif de l’´etude est d’explorer les explications possibles de cette plexit´e croissante dans le march´e des produits structur´es pour particuliers. Nous com-men¸cons par explorer les raisons du cˆot´e de la demande. Tout d’abord, nous envisageons
que cette hausse puisse provenir de l’´evolution des pr´ef´erences ou des besoins des con-sommateurs. Cependant, nous constatons qu’aucune des nombreuses variables et des contrˆoles que nous utilisons dans notre analyse ne d´etecte de changements dans la com-position du march´e des produits structur´es. Deuxi`emement, nous analysons si la hausse de la complexit´e financi`ere peut ˆetre li´ee `a l’augmentation de la compl´etude du march´e ou `a un meilleur partage des risques. Cependant, cette hypoth`ese devrait impliquer que la complexit´e est plus r´epandue parmi les produits pour investisseurs avertis et for-tun´es, qui devraient obtenir le plus grand avantage de ces opportunit´es. Cependant, nos donn´ees indiquent le contraire: les institutions qui ciblent les clients moins sophistiqu´es, comme les caisses d’´epargne, o↵rent des produits plus complexes. En outre, certaines caract´eristiques sp´ecifiques - par exemple, la mon´etisation d’un plafond sur la hausse de l’indice sous-jacent - et la mon´etisation de la possibilit´e de subir une perte si l’indice sous-jacent tombe en dessous d’un certain seuil - sont plus fr´equents lorsque la volatilit´e implicite est ´elev´ee, ce qui est difficile `a expliquer par des facteurs de demande. En e↵et, l’aversion au risque des investisseurs est plus faible lors des p´eriodes de crise.
Par cons´equent, dans notre tentative de compr´ehension de la hausse de la com-plexit´e, nous nous tournons vers des hypoth`eses d’utilisation strat´egique de celle-ci. Nous testons en particulier deux hypoth`eses d´ecoulant directement de pr´edictions th´eoriques: la rentabilit´e des produits complexes doit ˆetre relativement ´elev´ee et la complexit´e devrait augmenter lorsque la concurrence s’intensifie. Nous ´etablissons d’abord une relation entre la complexit´e financi`ere et la rentabilit´e des produits. Nous calculons la marge r´ealis´ee pour un sous-ensemble homog`ene en terme d’actif sous-jacent de produits structur´es pour particuliers, `a l’aide d’une m´ethodologie Least Square Monte Carlo. Nous contrastons ensuite le niveau de rentabilit´e avec celui de complexit´e du produit. Nous constatons que plus un produit est complexe, plus il est rentable. Bas´e sur la performance r´ealis´ee de 48 % des produits qui sont arrives a terme, nous montrons ´egalement que plus un produit est complexe, plus sa performance finale est faible. Deuxi`emement, nous ´etudions em-piriquement l’e↵et d’un choc de concurrence sur la complexit´e financi`ere. Nous utilisons
une m´ethodologie de di↵´erence de di↵´erences afin d’´evaluer l’impact de l’entr´ee des Ex-change Traded Funds (ETF) sur la complexit´e des produits structures pour particuliers.
Ce choc a ´et´e utilis´e par Sun (2014) aux ´Etats-Unis pour ´etudier l’impact de la
concur-rence sur les frais des fonds de placement communs. L’entr´ee des ETF repr´esente en e↵et une augmentation de la concurrence pour les produits structur´es pour particuliers, car ils repr´esentent un substitut possible `a ces produits. Nous constatons que le mˆeme
distribu-teur propose des produits plus complexes dans les pays o`u les ETF ont ´et´e introduits que
dans les pays o`u ils n’ont pas ´et´e introduits. Nous ´evaluons ´egalement l’impact du nombre
de concurrents dans le march´e des produits structur´es pour particuliers sur la complexit´e moyenne, explorant ainsi une autre dimension de concurrence. Nous montrons que la complexit´e moyenne de l’o↵re de produits du mˆeme distributeur est plus ´elev´ee dans les
march´es o`u le nombre de concurrents a augment´e. Ce r´esultat est robuste au contrˆole
par le niveau de rentabilit´e du secteur financier au niveau national.
Pour notre ´etude, nous utilisons une nouvelle base de donn´ees qui contient des infor-mations d´etaill´ees sur tous les produits structur´es pour particuliers qui ont ´et´e vendus en Europe de 2002 `a 2011. Cette base de donn´ees pr´esente des caract´eristiques cl´es qui facilitent l’analyse textuelle, ainsi que la strat´egie d’identification propre `a une ´etude d’organisation industrielle empirique. Elle couvre 17 pays, 9 ans de donn´ees et plus de 400 concurrents. Pour chaque ´emission, une description d´etaill´ee de la formule de calcul de performance, de nombreuses autres informations sur le produit et son distributeur, ainsi que le volume vendu, sont disponibles.
En termes d’implications r`eglementaires, notre travail souligne la n´ecessit´e d’´evaluer la complexit´e des produits ind´ependamment de leur risque. Une ´etape suppl´ementaire pourrait ˆetre d’imposer un plafond sur la complexit´e, ou de favoriser la standardisation des produits financiers pour particuliers afin de limiter la dynamique de complexification que nous observons. Ces mesures supposent pour le r´egulateur de d´evelopper et d’utiliser une mesure globale et homog`ene de la complexit´e des produits.
Chapitre II
L’innovation financi`ere vise `a am´eliorer le partage des risques en parvenant `a la compl´etude des march´es financiers. Cependant, les innovations financi`eres peuvent ˆetre utilis´ees `a d’autres fins, notamment par les politiciens soucieux de leurs propres int´erˆets. Ainsi, en 2001, afin de se conformer aux exigences de la zone euro, la Gr`ece a mis en place une transaction de swap de devises de gr´e `a gr´e avec Goldman Sachs dans le but
de cacher une part importante de sa dette. Aux ´Etats-Unis, les municipalit´es utilisent
r´eguli`erement une forme de remboursement anticip´e qui leur fournit une am´elioration
budg´etaire `a court terme, mais `a un coˆut total ´elev´e ((Ang et al., 2013)).
L’innovation financi`ere facilite-t-elle les strat´egies personnelles des politiciens aux frais du contribuable? Pour r´epondre `a cette question, nous ´etudions l’utilisation de produits financiers innovants par les collectivit´es locales. Nous nous concentrons sur un type de prˆet structur´es, surnomm´es emprunts toxiques par la presse en raison de leur profil `a haut risque ((Erel et al., 2013). Nous ´emettons l’hypoth`ese que ces produits sont utilis´es comme leviers de strat´egies d´elib´er´ees de la part des ´elus. Comme les utilisateurs de prˆets immobiliers complexes ´etudi´es par Amromin et al. (2013), les politiciens exploitent-ils d´elib´er´ement certaines caract´eristiques de ces prˆets `a leur propre avantage, malgr´e les risques `a long terme encourus?
Pour tester empiriquement cette hypoth`ese, nous exploitons une base de donn´ees unique qui inclut les portefeuilles d’emprunts toxiques de pr`es de 3000 collectivit´es locales fran¸caises. En utilisant des analyses transversales et une m´ethodologie de di↵´erence des di↵´erences, nous montrons que les politiciens utilisent ces produits plus fr´equemment et
dans une large mesure lorsque leurs incitations pour cacher le coˆut de la dette est ´elev´e,
lorsque ils sont les ´elus d’une zone sujette `a l’alternance, et lorsque leur confr`eres mettent en œuvre des op´erations similaires.
Au cours de la r´ecente crise financi`ere, du fait de la hausse de la volatilit´e, les frais d’int´erˆet des utilisateurs de prˆets toxiques ont atteint des niveaux tr`es ´elev´es. Un exemple
int´eressant est la ville de Saint-Etienne, qui poursuit actuellement en justice ses banques pour avoir vendu des produits financiers accus´es d’ˆetre trop risqu´e. En 2010, le taux d’int´erˆet annuel factur´e sur l’un de ses principaux prˆets a augment´e de 4 % `a 24 %, car il ´etait index´e sur le taux de change livre / franc suisse (Business Week, 2010). Les moins-values latentes totales de Saint-Etienne sur les emprunts toxiques ont atteint 120 millions d’euros en 2009, soit presque le niveau de la dette nominale de cette ville : 125 millions d’euros (Cour des comptes, 2011).
Bien que tr`es r´epandu, le ph´enom`ene des prˆets toxiques reste peu ´etudi´e acad´emiquement.1
Cette absence de recherche sur le sujet r´esulte principalement d’un manque de donn´ees utilisables. Nous nous appuyons sur deux ensembles de donn´ees in´edits qui se compl`etent mutuellement. Le premier jeu de donn´ees contient le portefeuille complet de la dette pour un ´echantillon d’environ 300 grandes collectivit´es locales fran¸caises `a fin 2007 pour chaque instrument de la dette. Il contient le montant nominal, la maturit´e, le taux du coupon moyen, le type de produit, de l’indice financier, et le prˆeteur identit´e. Le deuxi`eme ensem-ble de donn´ees comprend toutes les op´erations d’emprunts structur´ees faites par Dexia, la banque leader sur le march´e fran¸cais pour les prˆets aux collectivit´es locales, entre 2000 et 2009. Cette base de donn´ees fournit des informations au niveau du prˆet, y compris la valeur latente de la transaction, et la date de la transaction. Cette derni`ere variable est cruciale pour notre strat´egie d’identification. Contrairement aux ´etats financiers des gouvernements locaux qui ne distinguent pas entre prˆets structur´es et prˆet classique, ces bases de donn´ees fournissent des informations d´etaill´ees sur les types de prˆets qui sont utilis´es par chaque administration locale.
Nous apportons la preuve empirique de l’utilisation strat´egique de prˆets toxiques par les d´ecideurs publics. Nous commen¸cons par montrer que les prˆets structur´es repr´esentent plus de 20% de l’ensemble des encours de dette. Plus de 72% des gouvernements locaux de notre premier ´echantillon utilisent des prˆets structur´es. Parmi ces prˆets structur´es, 40% sont toxiques. Une analyse transversale de nos donn´ees montre que les ´elus des 1Capriglione (2014) ´etudie l’utilisation des instruments d´eriv´es par les gouvernements locaux italiens.
gouvernements locaux en difficult´e financi`ere sont nettement plus enclins `a se tourner
vers ce type de prˆet, attestant de leur incitation ´elev´ee `a cacher le coˆut r´eel de la dette
contract´ee. En e↵et, les gouvernements locaux du quartile sup´erieur du point de vue de l’endettement sont deux fois plus susceptibles d’avoir des prˆets toxiques par rapport `a ceux du quartile inf´erieur. Nous constatons ´egalement que les politiciens ´elus dans les zones `a alternance fr´equente sont plus enclins `a utiliser les prˆets toxiques, ce qui sugg`ere une motivation de leur part `a obtenir des ´economies `a court terme pour se faire r´e´elire.
Nous exploitons ´egalement la dimension temporelle de nos donn´ees. Nous identifions un groupe de traitement dont l’´election co¨ıncide avec la p´eriode de notre l’´echantillon, par opposition `a un groupe de contrˆole qui n’a pas d’´elections pour cette p´eriode (par exemple, les r´egions, dont le calendrier ´electoral di↵`ere, et les a´eroports, les ports, et les hˆopitaux, qui n’ont jamais d’´elections). En utilisant une m´ethodologie de di↵´erence des di↵´erences sur ces deux groupes, nous constatons que le calendrier des ´elections joue un rˆole impor-tant: pour le groupe ayant une ´election, les transactions sont plus fr´equentes peu avant les ´elections que peu apr`es. L’utilisation d’emprunts toxiques s’appuie ´egalement sur un comportement gr´egaire : les politiciens sont plus susceptibles de contracter des emprunts toxiques si leurs voisins l’ont fait r´ecemment. Ce comportement gr´egaire r´eduit le risque de r´eputation, tout en augmentant la probabilit´e d’un sauvetage collectif en cas de sce-nario n´egatif.
Chapitre III
Le levier excessif des institutions financi`eres a ´et´e un catalyseur important de la r´ecente crise financi`ere, ce qui a conduit les r´egulateurs et les politiciens `a blˆamer les r`egles de capital r`eglementaire comme responsables du niveau d’endettement atteint par les grandes institutions financi`eres en amont de la crise. Le d´ebat sur la r´eglementation des fonds propres des banques, cependant, a r´ev´el´e un dilemme fondamental. Comme pr´econis´e par les r´egulateurs (Rapport de la Commission ind´ependante des banques dirig´e
par Sir John Vickers (2013)) et universitaires (Admati et al. (2011)), une augmenta-tion significative du montant de capital requis pour les banques repr´esente la r´eponse logique au risque de faillite financi`ere devenu manifeste dans les ann´ees 2007 - 2009, et aidera `a ´eviter de futurs sauvetages bancaires par les gouvernements. L’application de ces r`eglements plus contraignants, cependant, est susceptible d’avoir des e↵ets r´eels ind´esirables tels que la contraction du cr´edit, car les investisseurs sont r´eticents `a fournir aux banques ces fonds propres suppl´ementaires (Jim´enez et al. (2013)). Cette r´eticence est partag´ee par les leaders de l’industrie bancaire (Ackermann (2010)). Par cons´equent, les instruments de capital contingent, qui combinent les avantages de la dette et des cap-itaux propres, et repr´esentent une solution possible `a ce dilemme, semblent ˆetre une voie prometteuse (Flannery (2005); Brunnermeier et al. (2009); Kashyap et al. (2008), French et al. (2010)). En principe, la r´eduction de la dette et l’am´elioration de capitalisation peuvent ´egalement ˆetre obtenus par des restructurations de la dette a posteriori, par exemple `a l’aide d’´echanges de dettes en actions. Les instruments de capital contingent peuvent, cependant, ˆetre plus efficace pour ´eviter le couteux renflouement des banques par les Etats, ainsi qu’aider `a r´esoudre les probl`emes de surendettement (Duffie (2010)) sans encourir de risque de d´efaut ou de l’´echec d’un plan de restructuration de la dette. La substitution d’une partie du capital r`eglementaire traditionnel en instrument de cap-ital contingent pourrait permettre aux banques d’am´eliorer leur r´esilience en limitant les
surcoˆuts li´es `a l’´emission de capital suppl´ementaires.2
Le but de cet article est d’´evaluer l’efficacit´e des instruments de capital contingent
pour r´esoudre les situations de d´etresse financi`ere des institutions financi`eres. Plus
pr´ecis´ement, cet article r´epond aux questions suivantes: lorsque la d´ecision d’exercice du capital contingent est laiss´ee `a l’´emetteur, celui-ci l’utilise-t-il cet outil ad´equatement, c’est- `a -dire en p´eriode de stress? Comment les cr´eanciers et actionnaires r´eagissent-ils `a ces exercices? Quel est l’impact des exercices d’instrument de capital contingent 2La litt´erature fournit plusieurs exemples de d´eviation de Modigliani-Miller tels que: les couts de
garantie d’op´eration par les banques, la sous-´evaluation des actions ´emises en raison de l’asym´etrie de l’information, et la r´eaction n´egative du cours des actions `a l’annonce d’une nouvelle ´emission. Pour plus de d´etails, voir Eckbo et al. (2007).
sur la performance ´economique des institutions financi`eres? La litt´erature sur l’analyse th´eorique des instruments de capital contingent est actuellement en plein essor, avec un volet important sur les incitations d’exercice et leurs e↵ets (Sundaresan and Wang (2013), Pennacchi et al. (2011), Martynova and Perotti (2012), Zeng (2012), Flannery (2010)). Cependant, il n’existe aucune ´etude empirique sur ce sujet `a ma connaissance.
Pour r´epondre `a ces questions, cet article s’appuie sur l’´emission d’obligations hybrides de premi`ere g´en´eration en Europe et l’utilisation massive de leurs possibilit´es d’exercice par les institutions financi`eres europ´eennes pendant la crise financi`ere r´ecente. Les instru-ments de capital contingent sont des hybrides entre dette et fonds propres: ils sont ´emis sous forme d’obligations, avec paiements de coupons et ´ech´eance stipul´ee, mais compor-tent des clauses qui permetcompor-tent leur conversion discr´etionnaire ou automatique pendant les p´eriodes de stress en instruments de capital `a maturit´e illimit´ee. Le capital contin-gent est moins cher que le capital traditionnel en raison du bouclier fiscal qu’il procure, et parce qu’il permet de lever des fonds propres que lorsque cela est n´ecessaire. Ces
instruments limitent donc les coˆuts associ´es `a l’´emission d’actions `a certains ´etats de la
nature (Bolton and Samama (2012)). Les obligations dites ”hybrides” sont la premi`ere g´en´eration d’instruments de fonds propres conditionnels, et sont connus comme des ”Trust
Preferred Securities” (TPS) aux ´Etats-Unis.
La premi`ere contribution de cet article est de montrer que les banques europ´eennes ont massivement utilis´es les possibilit´es d’exercice de leurs obligations hybrides au cours de la p´eriode 2009 - 2012, `a l’aide de deux m´ecanismes: l’extension de leur maturit´e, et des o↵res publiques de rachat a des niveaux inferieur au pair. De nombreux ´emetteurs ont ´etendu la maturit´e de leurs obligations hybrides, en ne proc´edant pas `a leur rappel lors de leur premi`ere date de remboursement possible. Dans mes donn´ees, je trouve que les banques europ´eennes n’ont pas rappel´e `a la premi`ere date de call un total de 200 milliards d’euros d’obligations hybrides. Ce montant repr´esente 30 pour cent des obligations hybrides en circulation sur la p´eriode, ou 11 % du capital total des banques europ´eennes. Les institutions financi`eres avec les ratios de capital les plus bas, qui sont
donc les plus susceptibles de sou↵rir d’une contrainte sur leur capital r´eglementaire, sont plus enclines `a cette action. Cette constatation minimise la crainte que le caract`ere discr´etionnaire des exercices puisse conduire `a des comportements de risk-shifting, puisque que les institutions financi`eres ne renoncent pas `a la r´eduction de leur dette comme cela serait le cas si cette hypoth`ese s’av´erait valide.
Parmi les ´emetteurs qui ´etendent la maturit´e de leurs obligations hybrides, cer-tains lancent simultan´ement une o↵re publique d’achat sur celles-ci. L’o↵re d’achat est g´en´eralement mise en œuvre avec une d´ecote importante, inh´erente au changement de maturit´e du titre super-subordonn´e. Ces actions combin´ees permettent `a l’institution financi`ere d’obtenir la d´ecote comme injection de capital Core Tier 1, car elle correspond
`a une plus-value.3 Les investisseurs ont apporte plus de 87 milliards d’euros d’obligations
hybrides `a ces o↵res de rachat sur la p´eriode, qui ont permis aux banques d’obtenir 22 milliards d’euros de plus-value, et donc d’injection de capital Core Tier 1.
La deuxi`eme contribution du papier correspond `a l’´etude de la r´eaction des investis-seurs aux exercices de la contingence. Ces ´ev`enements sont accueillis favorablement par les cr´eanciers, alors que la r´eaction des actionnaires est plus mitig´ee. La r´eaction du march´e est plus prononc´ee pour les extensions de maturit´e coupl´ees avec des o↵res de rachat, ce qui est coh´erent avec leur e↵et sur le Core Tier 1, un indicateur cl´e pour le r´egulateur pendant la crise. En outre, les o↵res d’´echange en actions, qui r´eduisent le plus l’endettement, sont re¸cus positivement `a la fois par les cr´eanciers et les actionnaires. La troisi`eme contribution du chapitre consiste `a fournir des preuves empiriques des e↵ets ´economiques positifs et persistants pour les banques de l’exercice du capital contin-gent. Les institutions financi`eres qui obtiennent un all´egement permanent de leur dette par ce moyen obtiennent un rendement sur actifs plus ´elev´es, et cette am´elioration relative est proportionnelle `a l’augmentation des fonds propres Core Tier 1 lors de l’op´eration. Cet e↵et est robuste au contrˆole des renflouements des Etats, ainsi que des augmentations de capital. De plus, l’activit´e de prˆet demeure plus soutenue pour ces institutions.
3Le Core Tier 1, ou Common Equity Tier 1, repr´esente la plus haute qualit´e de capital, et n’inclut
Les extensions de maturit´e, coupl´ees avec des o↵res de rachat ont des e↵ets ´economiques similaires `a l’exercice des instruments de capital contingent actuellement ´emis :
Obliga-tions Write-O↵ et CoCos: un gain en capital imm´ediat, combin´e dans certains cas `a
une ´emission d’actions. Puisque les r´egulateurs et les analystes financiers se concentrent sur le capital r´eglementaire, l’impact des all´egements de la dette sur les ratios de fonds propres r´eglementaires est essentiel pour l’´emetteur. Le caract`ere discr´etionnaire des ex-ercices ´etudi´es dans ce chapitre les rend encore plus comparable `a la forme de capital contingent propos´e par Bolton and Samama (2012), Capital contingent avec option de
conversion. 4 Par cons´equent, mes r´esultats illustrent comment des produits innovants
au passif peuvent aider ex ante `a diminuer les coˆuts de d´etresse financi`ere associ´es `a un
fort e↵et de levier.
4Ces instruments sont des obligations convertibles en actions, o`u la possibilit´e de convertir appartient
`
Contents
1 What Drives Financial Complexity? 5
1.1 Introduction . . . 7
1.2 The Retail Market for Structured Products . . . 11
1.2.1 Background . . . 11
1.2.2 Data . . . 13
1.3 Measuring Financial Complexity . . . 15
1.3.1 Classifying Payo↵s . . . 15
1.3.2 Results . . . 16
1.3.3 Robustness Checks . . . 17
1.4 Demand-Side Explanations of Financial Complexity . . . 18
1.4.1 Catering to Changing Needs and Preferences . . . 18
1.4.2 Risk Sharing and Increasing Completeness . . . 19
1.4.3 Gambling Products . . . 20
1.5 The Strategic Use of Financial Complexity . . . 21
1.5.1 Theoretical Considerations . . . 21
1.5.2 Financial Complexity and Product Profitability . . . 23
1.5.3 Complexity and Competition: The impact of ETF entry on
com-plexity . . . 27
1.5.4 Complexity and Competition: Number of Competitors in the Retail
Market for Structured Products . . . 29
1.7 Figures and Tables . . . 33
2 Political Incentives and Financial Innovation 49
2.1 Introduction . . . 51
2.2 The Toxic Loan Market . . . 54
2.2.1 Common Characteristics of Structured Loans . . . 54
2.2.2 Which Structured Loans Are Toxic? . . . 55
2.2.3 Example of a Toxic Loan . . . 56
2.2.4 Local Government Rationale . . . 56
2.2.5 Post-crisis developments . . . 57
2.3 Data . . . 57
2.3.1 Local Government-Level Data from a Leading Consulting Firm
(Dataset A) . . . 57
2.3.2 Bank-Level Data on Structured Transactions from Dexia (Dataset
B) . . . 59
2.4 Empirical Analysis . . . 60
2.4.1 Incentives to Hide the Cost of Debt . . . 60
2.4.2 Political Cycle . . . 63
2.4.3 Herding . . . 65
2.4.4 Political Affiliation and Fiscal Policy . . . 67
2.4.5 Alternative Motive: Hedging . . . 67
2.5 Conclusion . . . 68
2.6 Figures and Tables . . . 70
3 Call Me Maybe? 80
3.1 Introduction . . . 82
3.2 Background and Debt Relief Mechanisms . . . 86
3.2.1 The European Hybrid Bond Market in the Run-up to the Crisis . 86
3.2.3 Contingent Debt Relief Events . . . 89
3.3 Data . . . 90
3.4 Contingent Debt Relief Use . . . 91
3.5 Market Reaction to Contingent Debt Relief Events . . . 93
3.5.1 Hypotheses . . . 93
3.5.2 Event Study . . . 95
3.6 Economic E↵ects of Contingent Debt Relief . . . 99
3.6.1 Impact on Economic Performance . . . 99
3.6.2 Inspecting the Transmission Mechanism . . . 100
3.7 Discussion . . . 101
3.7.1 Alternative Hypotheses . . . 101
3.7.2 Comparison with Second-Generation Contingent Capital Instruments104
3.7.3 Comparing Europe and the United States . . . 105
3.8 Conclusion . . . 105
3.9 Figures and Tables . . . 107
4 Conclusion 122
5 Appendices 123
Appendix A Chapter 1 . . . 124 Appendix A.1Typology of Retail Structured Products . . . 124 Appendix A.2- Figures. . . 126 Appendix A.3- Tables . . . 127 Appendix A.4- Theoretical Framework (Model) . . . 132 Appendix B Chapter 2 . . . 135 Appendix B.1Types of Structured Debt Products and Risk Classification . . . 135 Appendix B.2Tables . . . 138 Appendix C Chapter 3 . . . 140
Chapter 1
What Drives Financial Complexity?
A Look into the Retail Market for Structured Products
KISS: Keep It Simple, Stupid. [US Navy Motto in the 1960s]
1.1
Introduction
Abundant anecdotal evidence suggests that the complexity of household financial prod-ucts has dramatically increased over the last twenty years. Innovative prodprod-ucts have been introduced continuously on the asset and liability sides -for example for mutual funds, credit cards, and mortgages -while financial literacy and sophistication seem to remain low (Lusardi and Tufano (2009b), Lusardi et al. (2010)). Is there an actual trend towards increasing financial complexity in retail products? If so, what drives this increase?
To answer these questions, we focus on a specific market that has been experienc-ing sustained growth and innovation in the last decade: the retail market for structured products. We first develop an index of product complexity, which we apply to a compre-hensive dataset of 55,000 retail structured products sold in Europe. We observe through this index that financial complexity has been increasing over time. We consider several demand-side explanations for this stylized fact: catering to changing needs and prefer-ences, a trend to more risk sharing and better market completeness, and a gambling motive. Observations from our data do not corroborate the first three explanations. We therefore focus on supply side based explanations, specifically on the strategic use of complexity that has been stipulated in various theoretical contributions in finance (e.g., Carlin (2009) and Carlin and Manso (2011)) and in industrial organization (Ellison (2005) and Gabaix and Laibson (2006)). We find evidence consistent with the theoretical explanations that emphasize motives such as increasing search costs or price discrimi-nation. First, we document that product complexity is associated with higher product profitability for banks and lower performance for investors. Second, using issuance level data spanning 15 countries over the period 2002-2010, we find that product financial complexity increases when competition intensifies. Our paper provides the first empirical test of the positive relationship between heightened competition and increasing financial complexity, which has been postulated in the theoretical literature (Carlin (2009)).
The first objective of this paper is to measure the possible increase in financial com-plexity as accurately as possible. We document a trend of increasing financial comcom-plexity by examining the product term sheets of all the retail structured products issued in Eu-rope since 2002 through a lexicographic analysis. We find that this trend continues even after the financial crisis. A major empirical challenge of our analysis lies in measuring product complexity in an accurate and relevant way in the highly diverse market of retail structured products. To do so, we develop an algorithm that precisely strips and identifies each feature embedded in the payo↵ formula of all the past and currently existing struc-tured products in the retail market. We define the complexity level of a given product as its total number of features. The rationale of our approach is that the more features
a product has, the more complex it is for the investor to understand and compare. We also use the number of characters used in the pay-o↵ formula description, as well as the number of potential scenarios, as robustness checks for our measure of complexity. The finding of increasing financial complexity over time is robust to any of these complexity measures.
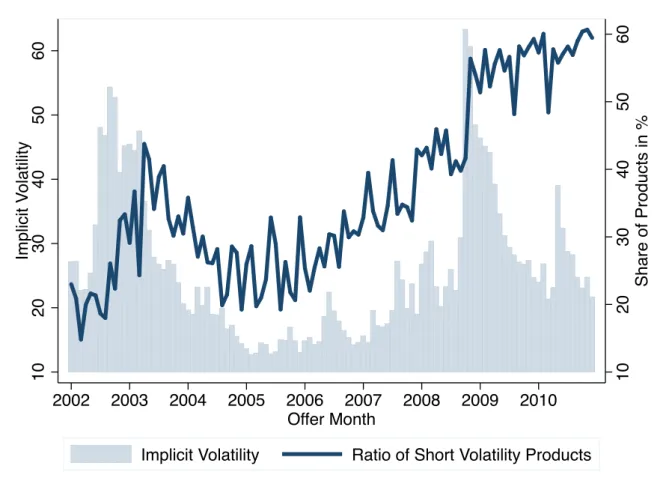
The second objective of the paper is to explore possible explanations for this increas-ing complexity in the retail market for structured products. We begin by investigatincreas-ing demand side explanations. First, we examine whether this observation results from cater-ing to changcater-ing preferences or consumer needs. However, we find that none of the many variables and controls we use detects any time trends or shifts in the composition of the market for structured products. Second, we analyze whether rising financial com-plexity is linked to increasing market completeness or better risk sharing opportunities. However, this hypothesis should imply that complexity is more prevalent among prod-ucts for sophisticated and a✏uent investors, who should obtain the largest benefit from such opportunities. However, our data indicate the opposite: institutions that target unsophisticated clients, such as savings banks, o↵er relatively more complex products. Additionally, specific product features - e.g., monetizing a cap on the rise of the under-lying index above a certain threshold - and more surprisingly monetizing the possibility to take a loss if the underlying index drops below a certain threshold - are more frequent when implied volatility is high, potentially driving up the average product complexity during these periods.
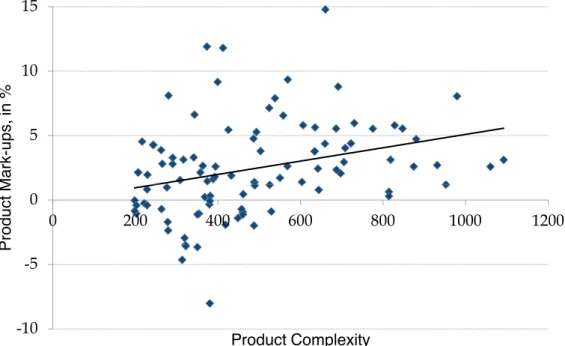
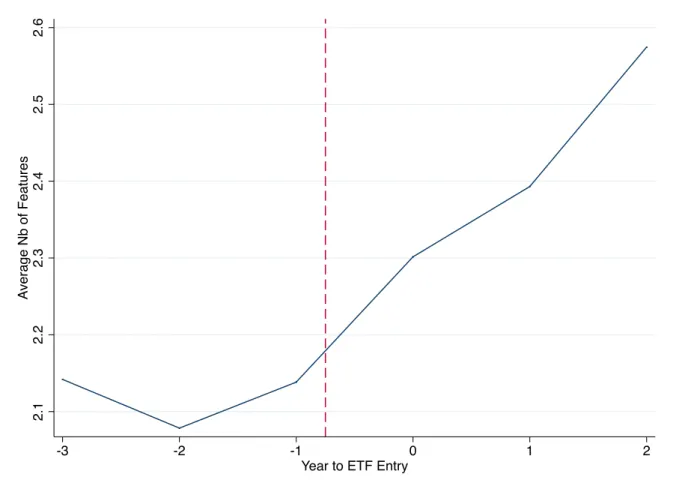
Therefore, in our attempt to understand the origins of increasing complexity, we turn to arguments explaining the use of financial complexity as a strategic tool to mitigate competitive pressure. Based on ample theoretical literature, we test in particular two hypotheses: markup of complex products should be relatively higher, and complexity should increase when competition intensifies. We first establish a relationship between financial complexity and product profitability. We price a subset of very homogenous retail structured products based on liquid underlying assets with Least Square Monte Carlo and then examine the explanatory power of product complexity for markups. We find that the more complex a product is, the more profitable it becomes. Based on the realized ex-post performance of 48% of the products that have matured, we also show that the more complex a product is, the lower its final performance. These findings are consistent with higher complexity being associated with a higher profit for the distributing intermediaries. Second, we empirically investigate the e↵ect of a competition shock on financial complexity. We implement a di↵erence-in-di↵erences methodology to assess the impact of Exchange Trading Fund (ETF) entries, on complexity. This instrument has first been used by Sun (2014) in the US to study the price impact of competition on
active management investment products. The entry of ETFs represents an increase of competition for retail structured products, as ETFs can be o↵ered as a substitute to these products. We find that the same distributor o↵ers more complex products in countries where ETFs have been introduced than in countries where they have not been introduced. A specification with bank-year fixed e↵ects further mitigates potential concerns over reverse causality between ETF entries and financial complexity. We also assess the impact of the number of competitors in the retail market for structured products on complexity, thus exploring another dimension of competition. We show that the average complexity of the product o↵er from the same distributor is higher in markets where the number of competitors has increased, which is again consistent with distributors adapting to the competitive environment. This result is robust to controlling for country level financial sector profitability, which could drive endogenously the number of competitors.
We use a new dataset that contains detailed information on all the retail structured products that have been sold in Europe since 2002. This database has key characteristics that facilitate text analysis, as well as a clean identification strategy in an empirical industrial organization study. It covers 17 countries and 9 years of data, with both strong inter-country and inter-temporal heterogeneity. It includes more than 300 competitors. At the issuance level, a detailed description of payo↵s, information on distributors, and volume sold are available.
There are several reasons to study the financial complexity dynamics in the retail market for structured products; one of them is the sheer size of the market. In Europe alone, outstanding volumes of retail structured products add up to more than EUR 700bn, which is equivalent to 12% of the mutual fund industry. Assets under management have been steadily growing, despite the financial crisis, with the US market exhibiting USD 160bn of retail structured product issuance since 2010. As direct participation in financial markets has been structurally decreasing in Europe, structured products often represent a privileged way of getting exposure to stock markets. In addition, information asymmetry is high between innovators, investment banks structuring the products, and the final consumer: the mass-market retail investor. We find many examples of products that pile up many complex features which are then marketed to savings bank customers, who
are less likely to be sophisticated.1 This finding illustrates the gap between supply-side
complexity and demand-side sophistication. In this study, we define financial complexity from the investor’s point of view, meaning how difficult it is for him or her to understand
a product and compare it with possible alternatives.2
1See section 3 for an example.
2We do not take the structuring bank point of view: how difficult it is to create a given product. A
product simple to understand can be challenging to structure. For instance, derivatives on real estate, although easily understood by retail investors are extremely difficult to structure for banks, mainly for
Our work contributes to several fields of the literature. First, our paper builds on the theoretical literature on financial complexity. Ellison (2005) and Gabaix and Laibson (2006) describe how inefficient product complexity emerges in a competitive equilibrium. To account for the complexity increase in financial products, Carlin (2009) and Carlin and Manso (2011) develop models in which the fraction of unsophisticated investors is endogenous and increases with product complexity. Carlin (2009) shows that as compe-tition intensifies, product complexity increases. Our paper tests direct implications from these models by empirically assessing the role of competition in the evolution of financial complexity. Sun (2014) tests empirically the e↵ect of competition on price discrimination against consumers with low price sensitivity. More specifically, our work contributes to the emerging field on complex securities (Griffin et al. (2013), Ghent et al. (2013), Carlin et al. (2013), Amromin et al. (2011), Sato (2013)).
Our project also complements the literature on the role of financial literacy and limited cognition in consumer financial choices and bank strategies. Bucks and Pence (2008) and Bergstresser and Beshears (2010) explore the relationship between cognitive ability and mortgage choice. Lusardi and Tufano (2009a) find that people with low financial literacy are more likely to take poor financial decisions. Complexity might amplify these issues. This paper also relates to the recent interest in the role of financial intermediaries in providing product recommendations to potentially uninformed consumers (Anagol and Cole (2013)).
Our paper also adds to the literature on structured products. Hens and Rieger (2008) theoretically reject completing markets as a motive for complexity by showing that the most represented structured products do not bring additional utility to investors in a rational framework. Empirical papers on the retail market for structured products have focused on the pricing of specific types of products. Henderson and Pearson (2011) estimate overpricing by banks to be almost 8%, on the basis of a detailed analysis of 64 issues of a popular type of retail structured products. This result challenges the completeness motive, as it will come at too high a cost.
In terms of policy implications, our work stresses the need to assess product complexity independently from risk. An additional step may be to impose a cap on complexity or to foster the standardization of retail structured products to limit the competition dynamics we observe. Such measures suppose for the regulator to develop and use a comprehensive and homogenous measure of product complexity beforehand.
Our paper is organized as follows: we begin in section 2 by providing background information on the retail market for structured products. Our methodology for building
liquidity reasons. The incentive is clear for a structuring bank to be the only one to price a product as it allows charging the monopolistic price.
a complexity index is described in section 3, as well as the trend towards increasing complexity. Section 4 considers possible demand-side explanations for the increase in financial complexity. Section 5 explores the strategic use of financial complexity. Finally, section 6 concludes.
1.2
The Retail Market for Structured Products
1.2.1
Background
Retail structured products regroup any investment products marketed to retail investors with a payo↵ that is determined following a formula defined ex-ante. They leave no
place for discretionary investment decisions along the life of the investment.3 Our study
excludes products with pay-o↵s that are a linear function of a given underlying perfor-mance, e.g., ETFs. Retail structured products are typically structured with embedded options. Although these products largely rely on equities, the exposure one can achieve with them is very broad: commodities, fixed income or other alternative underlyings, with some example of products even linked to the Soccer World Cup results.
Below is an example of a product commercialized by Banque Postale (French Post Office Bank) in 2010:
Vivango is a 6-year maturity product whose final payo↵ is linked to a basket of 18 shares (largest companies by market capitalization within the Eurostoxx50). Every year, the average performance of the three best-performing shares in the basket, compared to their initial levels is recorded. These three shares are then removed from the basket for subsequent calculations. At maturity, the product o↵ers guaranteed capital of 100%, plus 70% of the average of these performances recorded annually throughout the investment period.
This example illustrates the complexity of a popular structured product, which contrasts with the likely level of financial sophistication of the average client of Banque Postale. The biased underlying dynamic selection and the averaging of performance across time makes the product complex to assess in terms of expected performance.
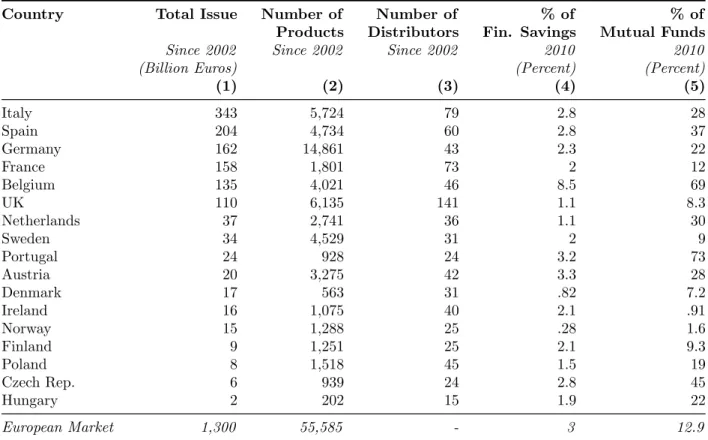
The retail market for structured products has emerged in 1996 and has been steadily growing from then on. In 2011, assets under management of retail structured products amount to about 700 billion euros in Europe, which amounts to nearly 3% of all Euro-pean financial savings, or 12% of mutual funds’ asset under management. Europe, with 3Retail structured product do not give any discretion to the investor in terms of exercising options,
a market share of 64%, and 357 distributors in 2010 is by far the largest market for these products. However, the US and Asia are catching are growing quickly. The US
market has met USD160bn of retail structured product issuance since 2010.4 Regulation,
both in terms of consumer protection and bank perimeter is the main explanation for the di↵erence in size between the European and the US markets. Consumer protection im-poses retail structured products to have a high minimum investment in the US, typically USD250,000. Furthermore, the Glass Steagall Act limited internal structuring of these products until its repeal in 1999. The predominant role of personal brokers as financial advisers in the US, as opposed to bank employees, may also have played a role.
The growth of this market has been fostered by an increasing demand for passive products, as the added value of active management has become more and more challenged (Jensen (1968) or Grinblatt and Titman (1994)). Structured product profitability for the banks structuring and distributing them also plays an important role (Henderson and Pearson (2011)). Indeed, on top of disclosed fees, some profits are hidden in the payo↵ structure that is hedged at better conditions than o↵ered to investor. The incentive to hide markup within the product has been increased in Europe by recent MiFID regulation that requires distributors to disclose commercial and management fees. In addition, retail structured products, when packaged as securities or deposits, can o↵er a funding alternative for banks, and a possible way of transferring some specific risks to retail
investors.5
The organization of the retail market for structured products is largely explained by the nature of the structuring process. Since these products are very complex to structure, only large investment banks have the exotic trading platform required to create them. But no equivalent barriers of scale exist on the distribution side, and distribution channels are more dispersed. Consequently, entities distributing the products to retail investors are often, but not necessarily, distinct from investment banks that structure them. These products have been marketed by a large range of financial institutions, from commercial banks, savings banks and insurance, to organizations active in wealth management and private banking. Many providers emphasize in their marketing e↵orts their expertise in structuring even when they do not actually structure the products, but only select them and implement a back-to-back transaction with an entity that can manage the market risk. Therefore, competition is playing out at two levels: between structuring entities, which sell to distributors, and between distributors, which sell to retail investors. Our analysis focuses on the latter, as we are interested in the dynamics of financial complexity in retail markets.
4Source: Euromoney Structured Retail Products.
5Recent issuances often allow bank to transfer tail risk to retail investors, as product will incur losses
The regulatory framework is a key determinant of the development and structure of this market, in which both bank supervision and investor protection exist. European national regulators, which are subordinated to a supranational regulator since 2011, the European Securities and Markets Authority (ESMA), have been increasingly attentive to protecting retail investors. The European Commission has developed a single Europe-wide regulatory framework defined by the UCITS Directive. However, until 2010, na-tional regulators mainly focused on disclosure requirements, which may have amplified issues of an asymmetric relationship between intermediaries and clients by mandating information requirements that were too abundant or too technical for clients, such as backtesting. MiFID regulation introduced client classification and corresponding prod-ucts appropriateness. Investors are warned when they choose a product deemed unusual or inappropriate. However, some national regulators appear to mix complexity with risk, and focus on the latter. For instance, in his latest guidelines about structured products (REF 2010), the French regulator limits product complexity if and only if investor capital is at risk.
1.2.2
Data
Our original data stems from a commercial database, called Euromoney Structured Retail Products, which collects detailed information on all the retail structured products that have been sold in Europe since the market inception (1996). As no benchmark data source exists, it is difficult to determine the exact market coverage of the database. However, some country-comparisons suggest that the database provides a comprehensive repository
of the industry.6
The retail market for retail structured products is divided into three categories: flow products, leverage products, and tranche products. We focus on tranche products, which are non-standardized products with a limited o↵er period, usually 4 to 8 weeks, and a maturity date. These products have the largest investor base, the highest amount of assets under management (they stand for 90% of total volumes), the highest average volumes, and exhibit the largest heterogeneity in terms of pay-o↵s. We therefore exclude flow products, which are highly standardized and frequently issued products, as they
rep-resent a high number of issuances with very low volumes (sometimes even null).7 We also
exclude leverage products, which are short term and open-ended products. In tranche 6For instance, the coverage on Danish products is 10% larger than that of a hand collected data on
the same market in Jorgensen et al. (2011)
7These products, for instance bonus and discount certificates, are very popular in Germany. Indeed,
hundreds of flow products are issued every day and 825,063 of them have been issued from 2002 to 2010. However, their size is only 20,000 Euros on average, against 8.8 million euros for the core market that we consider.
products, investors typically implement a buy and hold strategy, because there are signif-icant penalties for exiting before the maturity of the product. As of December 2010, the total volume (number) of outstanding structured tranche products was respectively EUR
704bn (41,277) in Europe.8 Data are available for 17 countries in Europe, and cumulated
volumes per country since the market inception are given in Table 1.1. Italy, Spain, Germany, and France dominate the market in terms of volume sold, making up for 60% of the total. We match this data with additional information on providers (Bankscope and hand-collected data), market conditions (Datastream) and macro-economic country variables (World Bank) at the time of issuance.
INSERT TABLE 1.1
Since 2002, the retail market for structured products has seen the emergence of two major trends: both the volume sold (Figure 1.1) and the number of distributors have significantly increased (from 144 in 2002 to 357 in 2010), with a slight decrease since the financial crisis (Table 1.2). The market is divided between commercial banks, private banks, saving banks and insurance companies, implying a heterogeneous investor base.
INSERT FIGURE 1.1
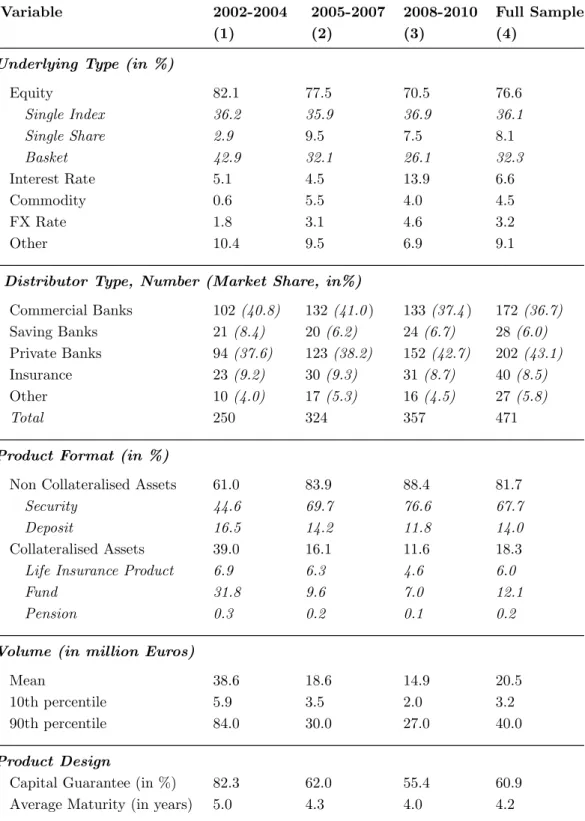
Table 1.2 provides summary statistics on the underlying type, distributor type, mar-keting format, volume and design of the products in our dataset. We observe that equity is the most widespread exposure, either through single shares, basket of shares or equity indices. Although slightly decreasing over time, the fraction of products with an equity underlying represent 77% of products from our sample. In terms of format, structured notes are becoming increasingly popular, as opposed to collateralized fund type product. This trend is likely to be motivated by banks trying to raise funding through these in-struments. With the number of products increasing, the average volume per product has been decreasing over the last ten years. Finally, products where the investor is guaran-teed to receive at least her initial investment, which were dominant at the beginning of the period, are becoming less popular and represent around half of the products in the recent years.
INSERT TABLE 1.2
8If we include leverage and flow products, the number of outstanding structured products are 406,037
1.3
Measuring Financial Complexity
1.3.1
Classifying Payo↵s
This subsection describes how we measure product complexity in the retail market for structured products. We develop an algorithm that converts the text description of 55,000 potentially unique products into a quantitative measure of complexity in a robust and replicable manner. This algorithm identifies features embedded in each payo↵ formula and counts them. The rationale of our approach is that the more features a product has, the more complex it is for the investor to understand and compare.
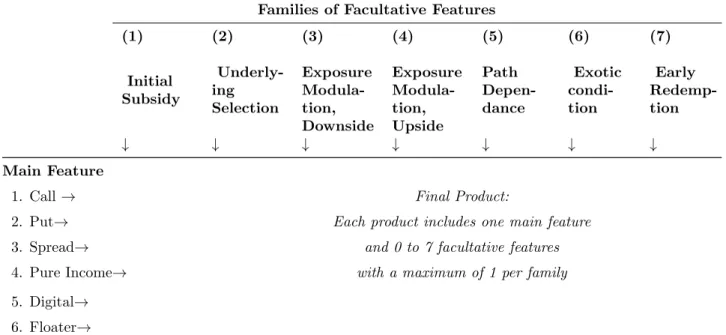
We first develop a typology of all the features retail structured products may be composed of. This typology classifies the features along a tree-like structure. The eight nodes of the tree represent the steps that an investor may face to understand the final payo↵ formula of a retail structured product. Only the first node, the main pay-o↵ formula, is compulsory. The following nodes cover facultative features. Example of features are: reverse convertible, which increases the investor exposition to a negative performance of the underlying, or Asian option, where the value of the payo↵ depends on the average price of the underlying asset over a certain period of time. Each one of the eight nodes of our typology includes on average five features. Therefore, our methodology covers more than 70,000 combinations of features and hence di↵erentiated products. Table 1.3 displays the structure of our typology by representing each node of the tree. We provide the description for each node and definition for each pay-o↵ feature in the appendix. Our typology covers exhaustively the features that presently exist in the market.
INSERT TABLE 1.3
In a second stage, an algorithm scans the text description of the final payo↵ formula of
all the 55,000 products and counts the number of features they contain.9 This algorithm
first runs a lexicographic analysis by looking for specific word combinations in the text description that pinpoint each feature we have defined in our typology. The algorithm identifies more than 1,500 di↵erent pay-o↵ features combinations in our data. Then we simply count the number of features to measure complexity. This approach assumes that all the features defined in our typology are equally complex. Like for any index, the equal weighting is a simplification, but it avoids subjective weighting biases. Given the depth of the breakdown we develop, the potential error introduced by equal weighting is probably a minor concern when compared to indexes built on a small number of components.
9Each formula description has been translated by the data provider, and only contains the necessary
Table 1.4 shows how our methodology applies to two existing products. While the first product is only made of one feature at the compulsory node: Call, the second exhibits three distinct features: Call, Himalaya, and Asian option, indicating a higher level of complexity. The length of the product descriptions also appears to be an increasing function of the number of features.
INSERT TABLE 1.4
Our methodology allows us to identify and measure the complexity of the payo↵ formula of all the past and currently existing retail structured products, but also that of virtually any new products that might be invented and marketed in the future. A simple typology based on the final product formula with corresponding levels of complexity would indeed not have been satisfying given the high diversity we observe. Our methodology is especially appropriate as far as it allows us to capture the piling up of features we observe in the market. Furthermore, our algorithm can easily be updated to take into account future developments of the market. Updating our algorithm only requires adding a branch to the feature tree when some new features are created.
1.3.2
Results
Figure 1.2 shows the unconditional average complexity of products from our sample by year. Complexity appears to be an increasing function of time, with almost no decrease in its growth trend following the financial crisis.
INSERT FIGURE 1.2
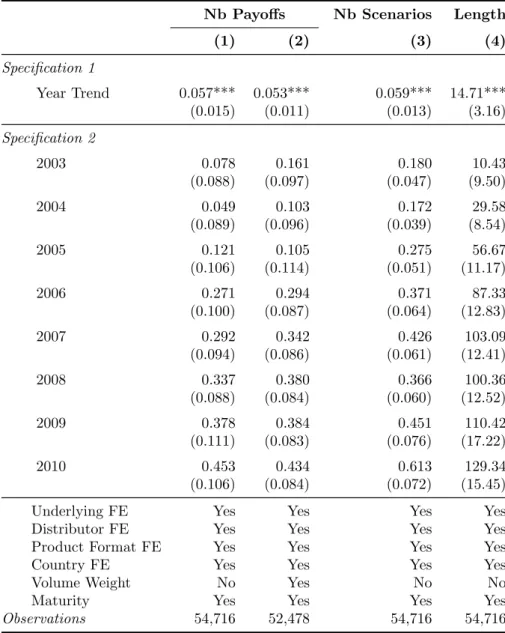
To examine this graphical evidence more formally, we regress our complexity measures on a linear time trend, as well as year fixed e↵ects in a second specification. We control for a battery of products characteristics, such as underlying type, distributor, format, country, volume and maturity. Results are shown in Table 1.5. Both specifications indicate that complexity has been steadily and significantly increasing over time. The coefficient of the linear trend is positive and highly significant. Coefficients on the year fixed e↵ects are increasing with time.
INSERT TABLE 1.5
Despite the widespread view that the financial crisis has driven down the complexity of financial instruments, we find that this is not the case for products targeted to retail investors. This fact points towards product structuring being driven by the supply side
of the market, not the demand side.10 This result is robust to the measure of complexity
we use. In section 5 and 6, we explore an industrial organization explanation for this increase in complexity.
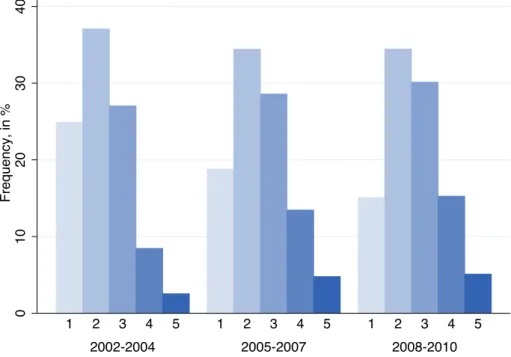
We then look into the evolution of the distribution of complexity. Figure 1.3 plots the distribution of products from our sample along our complexity index, for three sub-periods. The increase of complexity is not driven only by a fraction of the distribution of complexity, but instead increases across all complexity quartiles. Over time, we observe a decrease in the share of simple products, as well as an increase in the share of the most complex products. This empirical fact is consistent with banks piling up new features on existing pay-o↵ combinations.
INSERT FIGURE 1.3
1.3.3
Robustness Checks
As a first robustness check for our measure of complexity, we use the length of the formula description, measured by the number of characters. Table 1.4 illustrates that the more complex a product is, the higher the number of words needed to describe its payo↵.
As a second robustness check, we consider the number of di↵erent scenarios that impact the final return formula. The same product formula can indeed vary depending on one or several conditions at maturity or along the life of the product. This measure is close to counting the number of kinks in the final payo↵ curves, as a change of scenario
translates into a point of non-linearity for the pay-o↵ function.11 We quantify the number
of scenarios by identifying conditional subordinating conjunctions such as “if”, “when” and “whether” in the text description of the payo↵ formula. Overall, we observe a correlation around 0.6 between our three di↵erent complexity measures, which illustrates that they are coherent and still complementary.
We observe the same increasing trend over the year when using the length of descrip-tions or the number of scenarios as a complexity measure. Figure A.0 in the appendix provides graphical evidence for this result.
We also consider the possibility that a change in regulation, more specifically the implementation of the MiFID directive on November 1st, 2007, might have led to a di↵erent methodology for describing pay-o↵s, therefore creating a measurement error. 10The rise in complexity does not appear to be driven by banks providing additional insurance in the
products. On the contrary, reverse convertible features, that expose investors to downside, are more frequent after the crisis than before. This increased popularity is likely to relate to a higher volatility that increases the value of selling options. We discuss further this point in the next session.
11However this measure also accounts for path dependency that is not captured by the number of kinks