original article
RBCDH
Licence Creative Commom CC
1 Universidade Estadual de Londri-na. Group of Study and Research in Neuromuscular System and Exercise. Londrina, PR. Brazil. 2 Universidade Estadual de Londrina. Department of Physical Therapy. Londrina, PR. Brazil. 3 Universidade do Norte do Paraná. Department of Physical Therapy. Londrina, PR. Brazil. 4 Universidade Estadual de Londrina. Department of Electrical Engineering. Londrina, PR. Brazil. 5 Universidade de Campinas. Laboratory of Electromyography Studies. Campinas, SP. Brazil. Received: 19 April 2012 Accepted: 24 May 2012
EMG spectral analysis of incremental exercise
in cyclists and non-cyclists using Fourier
and Wavelet transforms
Análise espectral do sinal emg de exercício incremental
em ciclistas e não ciclistas usando as transformadas de
Fourier e Wavelet
Marcelo Vitor-Costa1
Henrique Bortolotti1
Thiago Viana Camata1
Jefferson Rosa Cardoso1,2
Rubens Alexandre da Silva1,3
Taufik Abrão1,4
Antonio Carlos de Moraes1,5
Leandro Ricardo Altimari1,5
Abstract– The aim of this study was to compare the electromyographic indices of fatigue (slope of median frequency) calculated with the fast Fourier transform (FFT) and wavelet transform (WT) in trained and untrained individuals during cycle exercise. A second objective was to compare the variance of the spectral parameters (median frequency - MF) obtained by the FFT and WT during exercise. Twelve cyclists and non-cyclists performed a maximal incremental test to determine the peak power (Wp) and electromyographic activity of the vastus lateralis (VL), rectus femoris (RF), biceps femoris (BF), semitendinous (ST) and tibialis anterior (TA). Mean values of median frequency, determined by the FFT and WT, were used for the spectral analysis of the electromyographic signals of the studied muscles. The analyzed parameters were obtained for each time period corresponding to 0, 25, 50, 75, and 100% of total duration of the maximal incremental test. No statistically significant differences were found in the values of MF and electromyographic indices of fatigue between the two techniques (FT and WT) both in the cyclists and non-cyclists group (P>0.05). Regarding the MF variance, statistically significant differences were found in all analyzed muscles, as well as in different time periods, both in the cyclists and non-cyclists groups when comparing the FFT and WT techniques (P<0.05). The WT seems to be more adequate to dynamic tasks, since it does not require the signal to be quasi-stationary, unlike the limitation imposed upon the use of the FFT.
Key words: Electromyography; Exercise test; Muscle fatigue; Spectral analysis.
Resumo– O objetivo deste estudo foi comparar índices de fadiga eletromiográfica (inclinação
da frequência mediana), calculado com a transformada rápida de Fourier (FFT) e transforma-da de wavelet (WT) em indivíduos treinados e não treinados durante o exercício de ciclismo. Um segundo objetivo foi o de comparar a variância dos parâmetros espectrais (frequência mediana - MF), obtidos por FFT e WT durante o exercício. Doze ciclistas e doze não ciclistas realizaram um teste incremental máximo, para determinar a potência pico (Wp) e atividade eletromiográfica do vasto lateral (VL), reto femoral (RF), bíceps femoral (BF), semitendíneo (ST) e tibial anterior (TA). Os valores médios da frequência mediana determinados pelo FFT e WT, foram utilizados para a análise espectral dos sinais eletromiográficos dos músculos estudados. Os parâmetros avaliados foram obtidos para cada período de tempo correspondente a 0, 25, 50, 75 e 100% da duração total do teste incremental máximo. Nenhuma diferença estatisticamente significativa foi encontrada nos valores da MF e índices eletromiográficos de fadiga entre as duas técnicas utilizadas (FT e WT), em ambos os grupos, ciclistas e não ciclistas (P> 0,05). Quanto à variância da MF, as diferenças estatisticamente significativas foram encontradas em todos os músculos analisados, bem como em diferentes períodos de tempo, tanto nos ciclistas quanto nos não ciclistas, quando se compara as técnicas FFT e WT (P <0,05). A WT parece ser mais adequada para tarefas dinâmicas, uma vez que não
INTRODUCTION
Muscular fatigue can be defined as a decrease in the ability of the muscle
to produce force or torque1 and may be followed by an increase of the rate
of perceived exertion2. One technique used to study muscular fatigue is
the surface electromyography (EMG), which provides information of the
muscle electrical activity during muscle contraction3. EMG analysis is
usu-ally performed by spectral decomposition of the signal using mathematical algorithms such as the fast Fourier transform (FFT), which allows the
de-composition of the signal in spectral components of high and low frequency3.
The FFT is well suited for the processing of EMG signals obtained dur-ing static contractions where the signal is supposedly stationary with no
alteration in muscle force, speed, and length3. However, most exercises are
not performed statically, which makes the use of this technique inadequate
for studies on muscular fatigue in dynamic activities4,5.
Changes in force, speed, and muscle length over time introduce varia-tions in the spectral content of the EMG signal creating additional difficul-ties in the use of the FFT, since this technique is suitable for processing periodic or cycle-stationary signals. In this case, it is necessary to identify the time windows in which the EMG signal does not change its cycle-stationarity, and then process the signal from these short-time windows.
This technique is known as short-time Fourier transform(STFT), or
alter-natively, short-term Fourier transform. This Fourier-related transform is applied to determine the spectral content, in terms of sinusoidal frequency and phase content, of local portions of a signal as it changes over time.
Given the limitations imposed upon the use of the FFT in dynamic contractions, another technique, called wavelet transform (WT), has been
used to decompose the EMG signal6. This technique consists in mapping
the signal in frequency and time from a series of base functions that can be designated, depending upon the analysis needs, and are built based on
a “mother” wavelet7 forming an orthogonal signals base. However, some
studies show that both techniques provide similar information about
muscle fatigue, both in static and dynamic conditions8-10.
The EMG analysis for muscle fatigue is commonly performed through spectral parameters (mean frequency or median frequency (MF)) over time during a fatiguing effort. The percentage of fatigue during exercise is determined by the ratio between the variation in the median frequency and its correspondent time interval, i.e., by the slope
given by MFslp = ΔMF / Δtand it’s known as a valid and reliable fatigue
index6,11. However, these results are demonstrated in a static (or not
purely dynamic) environment where the angle and speed of movement, as well as muscle force production, are systematically controlled by an isokinetic system.
To the best of our knowledge, few studies have investigated the compari-son of these methods in dynamic activities such as cycling. Vontscharner
identifying the muscle recruitment pattern of different types of muscle fiber in a specific phase of movement during running. The FFT analysis would hardly be able to identify this pattern with the same accuracy as the
WT analysis, as suggested by the study of Karlsson et al.13. However, more
studies are necessary to compare these two techniques (FFT and WT) and support these hypotheses.
The main objective of this study was to compare the fatigue indices (MF slope) obtained from the FFT and WT analyses in trained and untrained individuals during cycling exercise. A second objective was to determine the variance of the spectral parameters (MF) of FFT and WT during exercise. Our hypothesis is that the EMG fatigue indices from the two techniques are comparable, but the indices obtained through FFT analysis are less accurate (i.e., have more variability).
MATERIALS AND METHODS
Participants
Twenty-four healthy volunteers participated in this study, including 12 cyclists (28.0 ± 7.0 years; 176.2 ± 8.5 cm; 70.3 ± 13.0 kg), and 12 non-cyclists (24.9 ± 3.92 years; 174.4 ± 6.6 cm; 72.6 ± 8.7 kg). Cyclists had a minimum training frequency of three sessions per week (>100 km) and participated in competitions for at least 1.5 years in amateur or professional categories. Volunteer non-cyclists were physically active, practicing different sports or recreational physical activities of moderate to high intensity. All volun-teers signed an informed consent form, previously approved by the Ethics and Research Committee of the State University of Londrina (Protocol n° 032/07; CAAE n° 0034.0.268.000-07), after being informed of the details and procedures of the present study.
Experimental Design
This study was conducted over a period of two weeks, during which all participants were subjected to an incremental test to determine their peak
power (Wp) and EMG activity. The participants were oriented to abstain
from any substance or food containing caffeine during the experiment period, as well as alcoholic beverages, to be hydrated, and not to perform vigorous physical activity in the 24 h prior to the tests, in order to avoid any type of interference in the results. Each participant was tested at the same time of the day to minimize the effects of diurnal biological variation. The participants underwent a pilot study for familiarization with the test protocol and equipment used.
Maximal Incremental Test (ITmax)
All participants performed a maximal incremental test (ITmax) to determine
their peak power (Wp) and EMG activity in a CompuTrainer DYNAFIT
(RacerMate®, Seattle, WA, USA) cycle simulator, which allows the
protocol consisted of an initial load corresponding to 0 W, with increments
of 20 W.min-1 until volitional exhaustion or the inability to maintain a
cadence of 90 RPM for 5 s. The Wp was considered as the power generated
in the last second of the test.
Bike measures for each participant, such as saddle height and distance, stem height and distance, and hand positions were standardized during the pilot test in order to avoid changes in the participants’ posture and possible interferences in solicitation of the evaluated muscles. In all trials, the temperature and relative humidity were controlled and maintained between 21 – 24°C and 40 – 60%, respectively.
EMG signal processing and analysis
EMG signals were collected during the entire period of ITmax. Electrode
placement was according to SENIAM15. Before each IT
max, active EMG
bipolar electrodes, model TSD 150TM (BIOPAC Systems®, USA), with an
in-terelectrode distance of two centimeters, were placed on the vastus lateralis (VL), rectus femoris (RF), biceps femoris (BF), semi-tendinous (ST), and tibialis anterior (TA) muscles. Prior to electrode attachment, the sites were shaved, abraded, and cleaned with 70% alcohol to reduce skin impedance; the electrodes were placed on each muscle. EMG activity was recorded by
a 16-channel electromyograph, model MP150TM (BIOPAC Systems®, USA),
with sampling frequency of 2000 Hz. The common mode rejection ratio was 120 dB, and input signal limits were ± 5 mV. The reference electrode was placed at the bone protuberance of the participant’s right acromion.
For signal capture and processing the AcqKnowledge 3.8.1™ (BIOPAC
Systems®, USA) software and the Matlab 7.0 (Mathworks®, South Natick,
MA, USA) mathematical simulation environment were used. The raw EMG
signals were sampled at fs = 2000 samples/sec and filtered with a band-pass
digital filter of 20 and 500 Hz. For the spectral analysis of the EMG signal of the studied muscles, mean values of median frequency (MF) were used, obtained using the short-term fast Fourier transform (ST-FFT) and wavelet
db5 (WT) techniques. With these two techniques, the following parameters
were determined: the magnitude of the median frequency over time (MF(t));
MF slope normalized by the initial value (NMFslp) (which is the EMG index
of fatigue); and MF variance. The EMG fatigue index was determined by linear regression between the MF and the duration of the exercise for each muscle. The analyzed parameters were obtained from each time period
corresponding to 0, 25, 50, 75 and 100% of total duration of ITmax.
Statistical Analysis
Results were expressed as means with standard deviations (± SD). Analysis of variance for repeated measures was used to compare the data regarding the FFT and WT techniques. Mauchly’s sphericity test was applied, and whenever this test was violated the necessary technical corrections were made using the Greenhouse-Geisser test. Whenever the F test indicated statistical significance, the analysis was complemented using Tukey’s
comparison test. The limit of statistical significance was set at 5% (p≤0.05). Data were analyzed using the Statistical Package for the Social Sciences (SPSS), version 15 for Windows.
RESULTS
The maximum power achieved during the incremental test was 373.8 ± 46.5 vs. 258.5 ± 36.2 W, in cyclists and non cyclists respectively. Likewise, the time to volitional exhaustion in cyclists and cycling was 1112.5 ± 140.1 vs. 804.7 ± 117.4 s.
Median frequency (MF) and slope (NMFslp) values obtained through
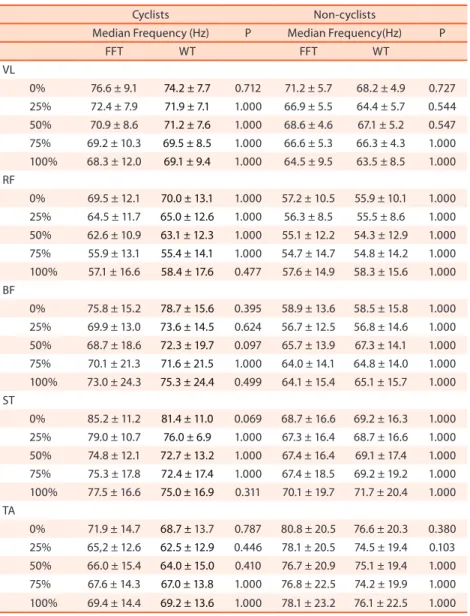
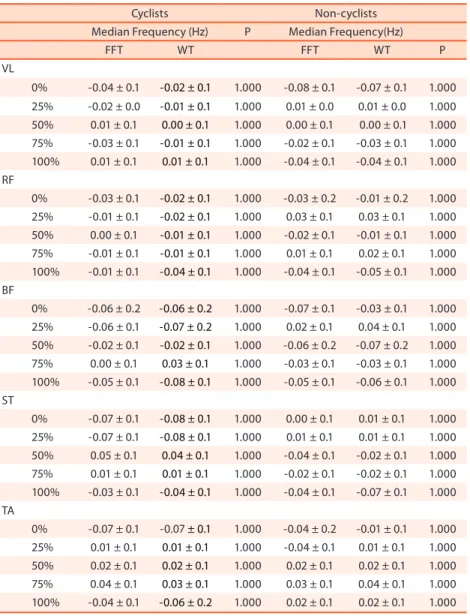
FFT and WT for the VL, RF, BF, ST, and TA muscles of cyclists and non-cyclists are shown in Tables 1 and 2 respectively. There were no statistically significant differences in the MF values and EMG fatigue indices between the two techniques (FFT and WT) in any of the analyzed muscles in the different time periods, both in the cyclists and non-cyclists group (p>0.05).
Table 1. Mean values ± standard deviation of median frequency obtained by FFT and WT for the vastus
lateralis (VL), rectus femoris (RF), biceps femoris (BF), semi-tendinous (ST), and tibialis anterior (TA) muscles of cyclists and non-cyclists.
Cyclists Non-cyclists
Median Frequency (Hz) P Median Frequency(Hz) P
FFT WT FFT WT VL 0% 76.6 ± 9.1 74.2 ± 7.7 0.712 71.2 ± 5.7 68.2 ± 4.9 0.727 25% 72.4 ± 7.9 71.9 ± 7.1 1.000 66.9 ± 5.5 64.4 ± 5.7 0.544 50% 70.9 ± 8.6 71.2 ± 7.6 1.000 68.6 ± 4.6 67.1 ± 5.2 0.547 75% 69.2 ± 10.3 69.5 ± 8.5 1.000 66.6 ± 5.3 66.3 ± 4.3 1.000 100% 68.3 ± 12.0 69.1 ± 9.4 1.000 64.5 ± 9.5 63.5 ± 8.5 1.000 RF 0% 69.5 ± 12.1 70.0 ± 13.1 1.000 57.2 ± 10.5 55.9 ± 10.1 1.000 25% 64.5 ± 11.7 65.0 ± 12.6 1.000 56.3 ± 8.5 55.5 ± 8.6 1.000 50% 62.6 ± 10.9 63.1 ± 12.3 1.000 55.1 ± 12.2 54.3 ± 12.9 1.000 75% 55.9 ± 13.1 55.4 ± 14.1 1.000 54.7 ± 14.7 54.8 ± 14.2 1.000 100% 57.1 ± 16.6 58.4 ± 17.6 0.477 57.6 ± 14.9 58.3 ± 15.6 1.000 BF 0% 75.8 ± 15.2 78.7 ± 15.6 0.395 58.9 ± 13.6 58.5 ± 15.8 1.000 25% 69.9 ± 13.0 73.6 ± 14.5 0.624 56.7 ± 12.5 56.8 ± 14.6 1.000 50% 68.7 ± 18.6 72.3 ± 19.7 0.097 65.7 ± 13.9 67.3 ± 14.1 1.000 75% 70.1 ± 21.3 71.6 ± 21.5 1.000 64.0 ± 14.1 64.8 ± 14.0 1.000 100% 73.0 ± 24.3 75.3 ± 24.4 0.499 64.1 ± 15.4 65.1 ± 15.7 1.000 ST 0% 85.2 ± 11.2 81.4 ± 11.0 0.069 68.7 ± 16.6 69.2 ± 16.3 1.000 25% 79.0 ± 10.7 76.0 ± 6.9 1.000 67.3 ± 16.4 68.7 ± 16.6 1.000 50% 74.8 ± 12.1 72.7 ± 13.2 1.000 67.4 ± 16.4 69.1 ± 17.4 1.000 75% 75.3 ± 17.8 72.4 ± 17.4 1.000 67.4 ± 18.5 69.2 ± 19.2 1.000 100% 77.5 ± 16.6 75.0 ± 16.9 0.311 70.1 ± 19.7 71.7 ± 20.4 1.000 TA 0% 71.9 ± 14.7 68.7 ± 13.7 0.787 80.8 ± 20.5 76.6 ± 20.3 0.380 25% 65,2 ± 12.6 62.5 ± 12.9 0.446 78.1 ± 20.5 74.5 ± 19.4 0.103 50% 66.0 ± 15.4 64.0 ± 15.0 0.410 76.7 ± 20.9 75.1 ± 19.4 1.000 75% 67.6 ± 14.3 67.0 ± 13.8 1.000 76.8 ± 22.5 74.2 ± 19.9 1.000 100% 69.4 ± 14.4 69.2 ± 13.6 1.000 78.1 ± 23.2 76.1 ± 22.5 1.000
Table 2. Mean values ± standard deviation of the normalized fatigue índex (NMFslp) obtained by FFT and WT for the vastus lateralis (VL), rectus femoris (RF), biceps femoris (BF), semi-tendinous (ST), and tibialis anterior (TA) muscles of cyclists and non-cyclists.
Cyclists Non-cyclists
Median Frequency (Hz) P Median Frequency(Hz)
FFT WT FFT WT P VL 0% -0.04 ± 0.1 -0.02 ± 0.1 1.000 -0.08 ± 0.1 -0.07 ± 0.1 1.000 25% -0.02 ± 0.0 -0.01 ± 0.1 1.000 0.01 ± 0.0 0.01 ± 0.0 1.000 50% 0.01 ± 0.1 0.00 ± 0.1 1.000 0.00 ± 0.1 0.00 ± 0.1 1.000 75% -0.03 ± 0.1 -0.01 ± 0.1 1.000 -0.02 ± 0.1 -0.03 ± 0.1 1.000 100% 0.01 ± 0.1 0.01 ± 0.1 1.000 -0.04 ± 0.1 -0.04 ± 0.1 1.000 RF 0% -0.03 ± 0.1 -0.02 ± 0.1 1.000 -0.03 ± 0.2 -0.01 ± 0.2 1.000 25% -0.01 ± 0.1 -0.02 ± 0.1 1.000 0.03 ± 0.1 0.03 ± 0.1 1.000 50% 0.00 ± 0.1 -0.01 ± 0.1 1.000 -0.02 ± 0.1 -0.01 ± 0.1 1.000 75% -0.01 ± 0.1 -0.01 ± 0.1 1.000 0.01 ± 0.1 0.02 ± 0.1 1.000 100% -0.01 ± 0.1 -0.04 ± 0.1 1.000 -0.04 ± 0.1 -0.05 ± 0.1 1.000 BF 0% -0.06 ± 0.2 -0.06 ± 0.2 1.000 -0.07 ± 0.1 -0.03 ± 0.1 1.000 25% -0.06 ± 0.1 -0.07 ± 0.2 1.000 0.02 ± 0.1 0.04 ± 0.1 1.000 50% -0.02 ± 0.1 -0.02 ± 0.1 1.000 -0.06 ± 0.2 -0.07 ± 0.2 1.000 75% 0.00 ± 0.1 0.03 ± 0.1 1.000 -0.03 ± 0.1 -0.03 ± 0.1 1.000 100% -0.05 ± 0.1 -0.08 ± 0.1 1.000 -0.05 ± 0.1 -0.06 ± 0.1 1.000 ST 0% -0.07 ± 0.1 -0.08 ± 0.1 1.000 0.00 ± 0.1 0.01 ± 0.1 1.000 25% -0.07 ± 0.1 -0.08 ± 0.1 1.000 0.01 ± 0.1 0.01 ± 0.1 1.000 50% 0.05 ± 0.1 0.04 ± 0.1 1.000 -0.04 ± 0.1 -0.02 ± 0.1 1.000 75% 0.01 ± 0.1 0.01 ± 0.1 1.000 -0.02 ± 0.1 -0.02 ± 0.1 1.000 100% -0.03 ± 0.1 -0.04 ± 0.1 1.000 -0.04 ± 0.1 -0.07 ± 0.1 1.000 TA 0% -0.07 ± 0.1 -0.07 ± 0.1 1.000 -0.04 ± 0.2 -0.01 ± 0.1 1.000 25% 0.01 ± 0.1 0.01 ± 0.1 1.000 -0.04 ± 0.1 0.01 ± 0.1 1.000 50% 0.02 ± 0.1 0.02 ± 0.1 1.000 0.02 ± 0.1 0.02 ± 0.1 1.000 75% 0.04 ± 0.1 0.03 ± 0.1 1.000 0.03 ± 0.1 0.04 ± 0.1 1.000 100% -0.04 ± 0.1 -0.06 ± 0.2 1.000 0.02 ± 0.1 0.02 ± 0.1 1.000
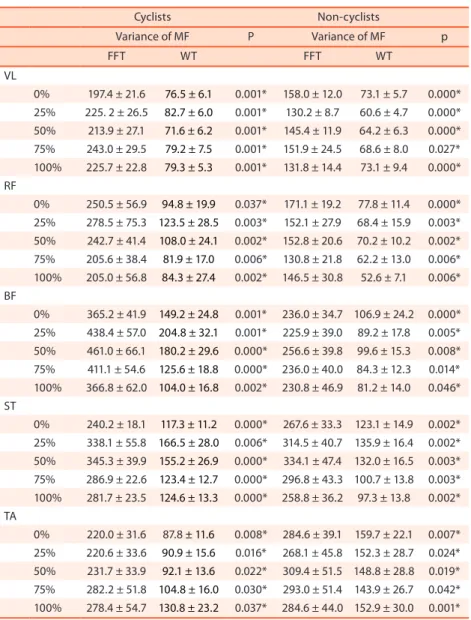
Regarding the variance of the MF, we observed statistically significant differences in all analyzed muscles, as well as in the different time periods, both for the cyclists and for the non-cyclists group when comparing the FFT and WT techniques (p<0.05) (Table 3).
The data dispersion of this index is greater when calculated using the FFT compared with WT, indicating an improved accuracy of the WT technique in the analysis of the EMG signals related to muscle fatigue and subject to variability in the spectral content throughout the processing time window.
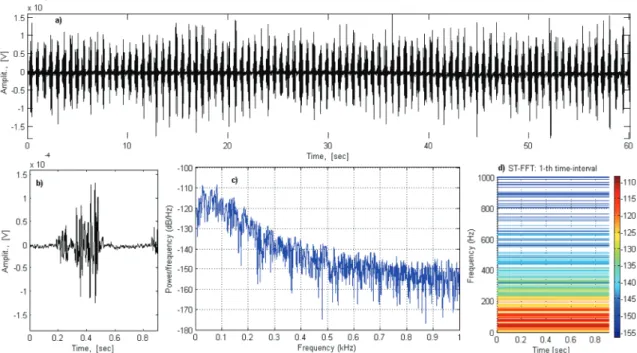
Figures 1 and 2 illustrate the results of the Fourier and wavelet signal processing techniques, respectively. The RF muscle signal of a cyclist at the
time period corresponding to 75% of ITmax, with approximately 60 s duration,
was taken as an illustrative example. Figure 1 a) presents time domain EMG RF muscle signal, while a zoom-in on the first 0.9 s duration of the signal is shown in Figure 1 b). Hence, short-term FFT was performed over each 0.9 s
time window along the time domain signal. As a result, Figure 1 c) presents a typical periodogram (PSD – power spectral density, in dB/Hz) performed over the 33-th time-interval (0.9sec) of the EMG RF muscle signal. Figure 1 d) indicates the spectrogram of the RF muscle signal from the time-domain signal of Figure 1 b).
Spectral analysis of the RF muscle signal, employing continuous wavelet
transform with db5 family and 128 scales, is depicted in Figure 2. Figure
2 a) illustrates the absolute values coefficients of the WT (image option), applied to the overall EMG signal of a cyclist, at the time period
corre-sponding to 75% of ITmax, with 60 s time-interval. In order to visualize the
spectral content changes, Figures 2 b) and 2 c) exhibit recursive zoom-in over WT (contour option), considering the first 5 s of the continuous WT image, from Figure 2 a). A contour representation (SC) of the WT scalogram represents the percentage of energy for each of 128 wavelet coefficients at
a specific time, and is obtained by computing
:
Table 3. Mean values ± standard deviation of MF variance of the vastus lateralis (VL), rectus femoris (RF),
biceps femoris (BF), semi-tendinous (ST), and tibialis-anterior (TA) muscles of cyclists and non-cyclists.
Cyclists Non-cyclists Variance of MF P Variance of MF p FFT WT FFT WT VL 0% 197.4 ± 21.6 76.5 ± 6.1 0.001* 158.0 ± 12.0 73.1 ± 5.7 0.000* 25% 225. 2 ± 26.5 82.7 ± 6.0 0.001* 130.2 ± 8.7 60.6 ± 4.7 0.000* 50% 213.9 ± 27.1 71.6 ± 6.2 0.001* 145.4 ± 11.9 64.2 ± 6.3 0.000* 75% 243.0 ± 29.5 79.2 ± 7.5 0.001* 151.9 ± 24.5 68.6 ± 8.0 0.027* 100% 225.7 ± 22.8 79.3 ± 5.3 0.001* 131.8 ± 14.4 73.1 ± 9.4 0.000* RF 0% 250.5 ± 56.9 94.8 ± 19.9 0.037* 171.1 ± 19.2 77.8 ± 11.4 0.000* 25% 278.5 ± 75.3 123.5 ± 28.5 0.003* 152.1 ± 27.9 68.4 ± 15.9 0.003* 50% 242.7 ± 41.4 108.0 ± 24.1 0.002* 152.8 ± 20.6 70.2 ± 10.2 0.002* 75% 205.6 ± 38.4 81.9 ± 17.0 0.006* 130.8 ± 21.8 62.2 ± 13.0 0.006* 100% 205.0 ± 56.8 84.3 ± 27.4 0.002* 146.5 ± 30.8 52.6 ± 7.1 0.006* BF 0% 365.2 ± 41.9 149.2 ± 24.8 0.001* 236.0 ± 34.7 106.9 ± 24.2 0.000* 25% 438.4 ± 57.0 204.8 ± 32.1 0.001* 225.9 ± 39.0 89.2 ± 17.8 0.005* 50% 461.0 ± 66.1 180.2 ± 29.6 0.000* 256.6 ± 39.8 99.6 ± 15.3 0.008* 75% 411.1 ± 54.6 125.6 ± 18.8 0.000* 236.0 ± 40.0 84.3 ± 12.3 0.014* 100% 366.8 ± 62.0 104.0 ± 16.8 0.002* 230.8 ± 46.9 81.2 ± 14.0 0.046* ST 0% 240.2 ± 18.1 117.3 ± 11.2 0.000* 267.6 ± 33.3 123.1 ± 14.9 0.002* 25% 338.1 ± 55.8 166.5 ± 28.0 0.006* 314.5 ± 40.7 135.9 ± 16.4 0.002* 50% 345.3 ± 39.9 155.2 ± 26.9 0.000* 334.1 ± 47.4 132.0 ± 16.5 0.003* 75% 286.9 ± 22.6 123.4 ± 12.7 0.000* 296.8 ± 43.3 100.7 ± 13.8 0.003* 100% 281.7 ± 23.5 124.6 ± 13.3 0.000* 258.8 ± 36.2 97.3 ± 13.8 0.002* TA 0% 220.0 ± 31.6 87.8 ± 11.6 0.008* 284.6 ± 39.1 159.7 ± 22.1 0.007* 25% 220.6 ± 33.6 90.9 ± 15.6 0.016* 268.1 ± 45.8 152.3 ± 28.7 0.024* 50% 231.7 ± 33.9 92.1 ± 13.6 0.022* 309.4 ± 51.5 148.8 ± 28.8 0.019* 75% 282.2 ± 51.8 104.8 ± 16.0 0.030* 293.0 ± 51.4 143.9 ± 26.7 0.042* 100% 278.4 ± 54.7 130.8 ± 23.2 0.037* 284.6 ± 44.0 152.9 ± 30.0 0.001*
where Coefs is the matrix of the continuous wavelet db5 coefficients. Finally, Figure 2 d) shows the wavelet scales conversion to pseudo-frequencies used in this illustrative example.
Figure 1. Short-term FFT under rectangular window (overall of the EMG signal of a cyclist, 75% of ITmax duration, 60 s for the RF muscle; a) time domain EMG signal; b) Zoom-in on the first 0.9 s; c) Short-term periodogram over the 33-th time-interval with 0.9 s of duration; d) Spectrogram of RF muscle signal from b).
Figure 2. Wavelet transform for the RF muscle using db5 wavelet family and 128 scales: a) Absolute Values Coefficients of wavelet transform (Image) applied to the overall EMG signal of a cyclist, 75% of ITmax duration, 60 s for the RF muscle; b) Zoom-in contour on the first 5 sec.; c) Zoom-in contour on the central portion of the item; b) (4500-5000 samples); and d) Wavelet scales conversion to pseudo-frequencies.
DISCUSSION
The main objective of this study was to compare the EMG fatigue indices obtained with the FFT and WT techniques in trained and untrained in-dividuals during cycle exercise. Our results show no difference between the investigated techniques regarding the percentage of muscle fatigue during the different experimental conditions. However, the FFT technique showed significantly greater dispersion of the MF values over time when compared to the values obtained by the WT technique, which supports our research hypothesis.
Different studies compared the FFT and WT in different experimental
protocols9,10,13,15. It seems that both techniques provide the same
informa-tion regarding muscular fatigue – that is, when EMG fatigue indices are analyzed in dynamic exercise systematically controlling the movement speed, angle, and force. Although our protocol involved a sport activity (cycling), without proper control of these variables that may change the spectral content of the EMG signal, our results also agree with other
stud-ies that compared the EMG fatigue indices between the two techniques9,10.
One possible explanation for these results is that the EMG fatigue in-dices are derived from an averaging process both within the time windows selected for analysis and in the linear regression. This process eliminates the individual differences between the spectral estimates of the FFT and WT, and could thus reduce the measurement errors, as suggested by the
results of this averaging effect presented by Da Silva et al.9 and MacIsaac
et al.16. This is also supported by our variance results, indicating less
ac-curacy (i.e., greater variability) in the data obtained with the FFT analysis compared to the WT (Table 3).
Our results corroborate findings of other studies that found no signifi-cant differences between the spectral parameters, estimated by FFT and
WT, obtained in constant load cycling exercises at submaximal17,
maxi-mum18, or supramaximal19 intensities, in the comparison between dynamic
and isometric exercises20 and also in dynamic back-muscle exercises9 as well.
CONCLUSION
When presented as mean values, the median frequency and the normal-ized fatigue index did not differ between FFT and WT over the duration of an incremental exercise. Although no differences between the methods in calculating the fatigue indices were found, the values obtained using the FFT showed greater data variance when compared to WT. The WT technique seems to be more appropriate to dynamic tasks, since it does not require the signal to be quasi-stationary, unlike the limitation imposed by the conventional FFT technique. Given this requirement, when analyz-ing dynamic signals with the FFT technique, there are high values for the
variance directly influencing the standard deviation of the data, which can hinder the detection of representative differences in a given data set. Thus, studies using a small number of subjects, where the variability of the data can compromise the statistical comparisons (type two error), may benefit from using the WT decomposition of the EMG signal.
REFERENCES
1. Bigland-Ritchie B, Rice CL, Garlnad SJ, Walsh ML. Task-dependent factors in fatigue of human voluntary contractions. In: Gandevia SC, McComas AJ, Stuart DG, Thomas CK. editors. Fatigue. Neural and muscular mechanisms, edited by New York: Plenum Press. 1995. p.361-80.
2. Enoka RM, Stuart DG. Neurobiology of muscle fatigue. J Appl Physiol 1992;72(5):1631-48.
3. De Luca CJ. The use of surface electromyography in biomechanics. J Appl Biomech 1997;13(2):135-63.
4. Bonato P, Roy SH, Knaflitz M, De Luca CJ. Time-frequency parameters of the surface myoelectric signal for assessing muscle fatigue during cyclic dynamic contractions. IEEE Trans Biomed Eng 2001;48(7):745-53.
5. Knaflitz M, Bonato P. Time-frequency methods applied to muscle fatigue assess-ment during dynamic contractions. J Electromyogr Kinesiol 1999;9(5):337-50.
6. Kankaanpaa M, Taimela S, Webber CL, Jr., Airaksinen O, Hanninen O. Lumbar paraspinal muscle fatigability in repetitive isoinertial loading: EMG spectral indices, Borg scale and endurance time. Eur J Appl Physiol Occup Physiol 1997;76(3):236-42.
7. Barria EA, Jagadeesh JM. Multiresolution estimation of motion using the wavelet transform. Proceedings - Spie the International Society for Optical Engineering 1994;(2303):542-53.
8. Beck TW, Housh TJ, Johnson GO, Weir JP, Cramer JT, Coburn JW, Malek MH. Comparison of fourier and wavelet transform procedures for examining the mechanomyographic and electromyographic frequency domain responses during fatiguing isokinetic muscle actions of the biceps brachii. J Electromyogr Kinesiol 2005;15(2):190-9.
9. Da Silva RA, Lariviere C, Arsenault AB, Nadeau S, Plamondon A. The comparison of wavelet- and Fourier-based electromyographic indices of back muscle fatigue during dynamic contractions: validity and reliability results. Electromyogr Clin Neurophysiol 2008;48(3-4):147-62.
10. Sparto PJ, Parnianpour M, Barria EA, Jagadeesh JM. Wavelet analysis of electro-myography for back muscle fatigue detection during isokinetic constant-torque exertions. Spine 1999;24(17):1791-8.
11. Lariviere C, Arsenault AB, Gravel D, Gagnon D, and Loisel P. Evaluation of meas-urement strategies to increase the reliability of EMG indices to assess back muscle fatigue and recovery. J Electromyogr Kinesiol 2002;12(2):91-102.
12. von Tscharner V, Goepfert B. Estimation of the interplay between groups of fast and slow muscle fibers of the tibialis anterior and gastrocnemius muscle while running. J Electromyogr Kinesiol 2006;16(2):188-97.
13. Karlsson S, Yu J, Akay M. Time-frequency analysis of myoelectric signals during dy-namic contractions: a comparative study. IEEE Trans Biomed Eng 2000;47(2):228-38.
14. Hermens HJ, Freriks B, Disselhorst-Klug C, Rau G. Development of recommenda-tions for SEMG sensors and sensor placement procedures. J Electromyogr Kinesiol 2000;10(5):361-74.
15. Hostens I, Seghers J, Spaepen A, Ramon H. Validation of the wavelet spectral esti-mation technique in biceps brachii and brachioradialis fatigue assessment during prolonged low-level static and dynamic contractions. J Electromyogr Kinesiol 2004;14(2):205-15.
Corresponding author
Leandro R. Altimari
Departamento de Educação Física Universidade Estadual de Londrina, Rodovia Celso Garcia Cid, Pr 445 Km 380 – Campus Universitário, Cx. Postal 6001,
CEP 86051-990, Londrina, PR, Brazil. E-mail: altimari@uel.br
16. MacIsaac D, Parker PA, Scott RN. The short-time Fourier transform and muscle fa-tigue assessment in dynamic contractions. J Electromyogr Kinesiol 2001;11(6):439-49.
17. Garavelo JJ, Altimari LR, Camata TV, Vieira JLL, Abrão T, Moraes AC. Análise espectral do sinal EMG dos músculos superficiais do quadríceps durante ex-ercício submáximo de carga constante no cicloergômetro. Rev Educ Fís/UEM 2011;22(2):211-20.
18. Vitor-Costa M, Pereira LA, Oliveira RS, Pedro RE, Camata TV, Abrao T, Brunetto MA, Altimari LR. Fourier and wavelet spectral analysis of EMG signals in maximal constant load dynamic exercise. Conf Proc IEEE Eng Med Biol Soc 2010;1(1):4622-5.
19. Camata TV, Dantas JL, Abrão T, Brunetto MAOC, Moraes AC, Altimari LR. Fou-rier and Wavelet spectral analysis of EMG signals in supramaximal constant load dynamic exercise. Conf Proc IEEE Eng Med Biol Soc 2010;1(1):1364-7.
20. Dantas JL, Camata TV, Brunetto MAOC, Moraes AC, Abrão T, Altimari LR. Fourier and Wavelet spectral analysis of EMG signals in isometric and dynamic maximal effort exercise. Conf Proc IEEE Eng Med Biol Soc 2010;1(1):5979-82.