Infl uence of Forest Composition on
Understory Cover in Boreal
Mixed-wood Forests of Western Quebec
Sonia Légaré, Yves Bergeron and David Paré
Légaré, S., Bergeron, Y. & Paré, D. 2002. Infl uence of forest composition on understory cover
in boreal mixedwood forests of western Quebec. Silva Fennica 36(1): 353–366. Forest overstory composition infl uences both light and nutrient availability in the mixed boreal forest. The infl uence of stand composition on understory cover and biomass was investigated on two soil types (clay and till deposits). Four forest composition types were considered in this study: aspen (Populus tremuloides Michx.), paper birch (Betula papyrifera Marsh.), jack pine (Pinus banksiana Lamb.) and a mixture of balsam-fi r (Abies balsamea (L.) Mill.) and white spruce (Picea glauca (Moench) Voss). The cover of all understory species was recorded while the biomass of two important and ubiquitous species was measured: mountain maple (Acer spicatum Lam.) of the shrub layer and large-leaved aster (Aster macrophyllus L.) of the herb layer. Soil analyses were conducted to evaluate the infl uence of overstory composition on understory biomass through its infl uences on soil characteristics. Analyses of variance showed a signifi cant effect of forest canopy type on mountain maple biomass, understory cover and shrub cover but not on herb cover and large-leaved aster biomass. Path analysis was performed to explore the relationships between canopy type, nutrient availability and understory biomass. Contrary to what was expected, the variation in plant biomass associated with forest composition was weakly related to soil nutrient availability and more strongly related to stand structural attributes.
Keywords understory, composition, canopy, nutrient availability, biomass
Authors’ addresses Légaré, Université du Québec en Abitibi-Témiscamingue, Groupe
de recherche en écologie forestière interuniversitaire, 445, boulevard de l'Université, Rouyn-Noranda, QC, Canada J9X 5E4; Bergeron, NSERC-UQAT-UQAM, Industrial Chair in sustainable forest management, CP 8888, succ. Centre-Ville, Montréal, QC, Canada H3C 3P8; Paré, Natural Resources Canada, Canadian Forest Service, Laurentian Forestry Centre, P.O. Box 3800, Sainte-Foy, QC, Canada G1V 4C7
E-mail sonia.legare@uqat.uquebec.ca
1 Introduction
The forest understory is an important component of forest biodiversity, and is where competition for light, water and nutrients strongly affects the initial success of tree species (Abrams and Dickmann 1982, Brumelis and Carleton 1989, George and Bazzaz 1999, Kabzems and Lousier 1992, Lieffers and MacDonald 1993). The predic-tion of the effect of forest management activities on forest biodiversity, regeneration and productiv-ity requires a better understanding of the factors controlling the composition and growth of the understory layer. It is well established that there are interactions between overstory and understory vegetation (Carleton and Maycock 1980, Gagnon and Bradfi eld 1986, Host and Pregitzer 1992, Gil-liam et al. 1995, Sagers and Lyon 1997, Légaré et al. 2001), mediated by relationships among light, water and nutrients (Paré et al. 1993, Longpré et al. 1994, Brais et al. 1995, Paré and Bergeron 1996, Messier et al. 1998).
It has long been recognized that understory bio-mass increases with an increase in incident solar energy (Zavitkovski 1976). In fact, the understory layer is affected by a reduction of light, when canopy is closed and stratifi ed, and by nutrient availability (Gilliam and Turrill 1993). Also, more light is transmitted to the understory of stands composed predominantly of shade intolerant spe-cies such as aspen (Populus tremuloides Michx.), jack pine (Pinus banksiana Lamb.) and white birch (Betula papyrifera Marsh.), than stands composed of shade tolerant species such as balsam fi r (Abies balsamea (L.) Mill.), white spruce (Picea glauca (Moench) Voss) and white cedar (Thuja occidentalis L., Messier et al. 1998).
The different nutrient requirements of the spe-cies in a stand and their relative contributions to the chemistry of the forest litter affect soil nutri-ent availability and other soil properties such as pH and net nitrifi cation (Paré et al. 1993, Longpré et al. 1994, Brais et al. 1995, Paré and Bergeron 1996, Ste-Marie and Paré 1999). The relationship between overstory and understory is complex and also dependant on permanent site factors such as surface deposit. This is illustrated in the use of understory species as indicators of site quality or site productivity (Spies and Barnes
1985, Nieppola and Carleton 1991). It has been demonstrated that canopy type, through is infl u-ence on nutrient availability, affects understory composition (Légaré et al. 2001). Our general hypothesis was that forest composition infl uences understory cover and biomass despite similar edaphic conditions.
The principal objective of this study was to determine the infl uence of forest canopy compo-sition on understory. More precisely, we studied the effect of forest composition on: i) the abun-dance (i.e., per cent cover) of tree, shrub, and herbaceous species in the understory; and, ii) the biomass (g / m2) of the indicator species mountain
maple (Acer spicatum Lam.) and large-leaved aster (Aster macrophyllus L.). A secondary objec-tive was to investigate the interactions among canopy type, nutrient availability and understory biomass using path analysis.
2 Materials and Methods
2.1 Study Area
The area studied is located at Lake Duparquet Research and Teaching Forest, in northwestern Quebec (48°30´N, 79°20´W). This area is part of the western Abies balsamea (balsam fi r)–Betula
papyrifera (paper birch) bioclimatic domain
(Grondin 1996). This domain covers a part of the clay belt of Quebec and Ontario, a major physiographic region resulting from the deposits left by the proglacial Lakes Barlow and Ojibway at the time of their maximum expanse during the post-Wisconsinian (Vincent and Hardy 1977). The closest weather station to the study area is located at La Sarre, 35 km north of Lake Duparquet. The average annual temperature is 0.8 °C, daily mean temperature for January is –17.9 °C and 16.8 °C for July, and the average annual precipitation is 856.8 mm (Environnement Canada 1993).
In the early stages of succession, paper birch, aspen, or jack pine dominate the forests in our study area. If stands are not subjected to any major disturbances such as fi res (Bergeron 1991, Dansereau and Bergeron 1993) or spruce bud-worm outbreaks (Morin et al. 1993), they develop
into forests dominated by balsam fi r and white cedar (Bergeron and Dubuc 1989). However, sev-eral different successional pathways are possible, and in some cases fi r and spruce return immedi-ately after a fi re (Bergeron and Dubuc 1989). Pio-neer understory species such as Solidago rugosa Mill. and Rubus idaeus L. disappear soon after canopy closure. Later, shade tolerant species such as Cornus canadensis L., Linnaea borealis L. and
Taxus canadensis Marsh. appear, while
domi-nance of Aster macrophyllus L., Aralia
nudicau-lis L. and Acer spicatum Lam. decreases (De
Grandpré et al. 1993).
2.2 Sampling Methods
Ninety-four plots, each measuring 10 m × 10 m, were selected with particular care to ensure that the site conditions (slope and drainage) among plots were similar. The small size of these plots enabled us to avoid areas that had been disturbed by spruce budworm outbreaks. Plots were chosen on two different types of surface deposits; well to moderately drained clay and till. Four categories of forest composition were considered: aspen, paper birch, jack pine, and spruce-fi r (balsam fi r, white cedar, white spruce). One of these catego-ries was assigned to each plot as a function of the species or group of species that exceeded 75% of the total basal area of the stand (Table 1). Sam-pled stands originated from fi res that occurred in: 1870, 1916, 1919, 1923, 1944, 1964 (Table 2). Except for the aspen stand originating from the 1870 fi re, which corresponds to a second cohort of aspen, dominant trees established immediately after the fi re in all stands (Bergeron 2000). The
stand type and surface deposits selected repre-sent the common forests and soils in the region (Bergeron et al. 1983). There were several rep-licates for each combination of soil and forest composition (Table 2). Some combinations had fewer replicates than others because of the dif-fi culty of dif-fi nding sites undisturbed by human activity and on the desired soil type.
2.2.1 Vegetation Sampling Methods
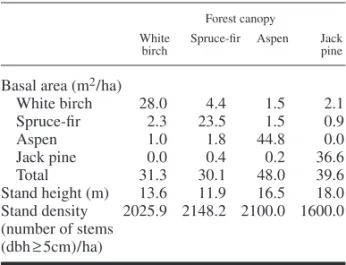
Herb, shrub and tree species less than 1 m high, or of a diameter at breast height less than 1 cm (Appendix 1) were sampled in the summer of 1998. Ten randomly distributed subplots (1 m × 1 m) were installed in each 10 m × 10 m plot. The per cent cover of each species was estimated in each subplot. For each plot, the mean cover of Table 1. Mean basal area of each tree species, mean
stand height and mean stand density for each canopy type.
Forest canopy
White Spruce-fi r Aspen Jack
birch pine
Basal area (m2 / ha)
White birch 28.0 4.4 1.5 2.1 Spruce-fi r 2.3 23.5 1.5 0.9 Aspen 1.0 1.8 44.8 0.0 Jack pine 0.0 0.4 0.2 36.6 Total 31.3 30.1 48.0 39.6 Stand height (m) 13.6 11.9 16.5 18.0 Stand density 2025.9 2148.2 2100.0 1600.0 (number of stems (dbh ≥ 5cm) / ha)
Table 2. Sampling plan.
Forest composition Clay Till
Time since fi re (yr)
130 77–84 56 36 130 77–81 56 36 Aspen 4 4 4 4 4 4 4 4 White birch 4 3 4 0 4 5 4 3 Jack pine 0 4 0 0 0 4 0 0 Spruce-fi r 4 4 4 0 4 4 4 3 Number of plots 12 15 12 4 12 17 12 10
each species was calculated, as well as total herb cover, shrub cover and total understory cover (i.e., all species).
Following the observations of preliminary sam-pling in 1997, two understory species (mountain maple for its dominance in the shrub layer and large-leaved aster in the herb layer) were selected as indicator species of their respective understory layer biomass. Mountain maple and large-leaved aster biomass in each plot (10 m × 10 m) were assessed with allometric equations established for the Lake Duparquet Research and Teaching Forest (Appendix 2 and 3).
2.2.2 Soil Sampling
Eight samples were taken from two soil horizons: four samples from FH horizon and four samples from the fi rst 10 cm of the mineral soil (Ae horizon and the top of the B horizon) in each plot. The samples were pooled by horizon and were air dried and ground. FH layer pH was analyzed in distilled water (McKeague 1977). Mineral N (NH4 and NO3) was extracted with 2M KCl
and analyzed by fl ow injection analysis (Tecator FIA Star 5020). Exchangeable calcium in the humus layer was extracted with 0.1M BaCl2 and
determined by atomic absorption (Hendershot et al. 1993). Percentages of silt and clay in the mineral soil were determined by granulometric analysis (McKeague 1977).
2.2. Light Measurements
Available light for herb species was assessed using a LAI-2000 plant canopy analyzer (LICOR Inc., Lincoln, NE), which measured photosyn-thetic photon fl ux density (PPFD). PPFD was measured at 50 cm above forest fl oor at eight sys-tematically selected places in each plot. Simulta-neously, reference measures, which corresponded to full light, were recorded every 15 seconds in an open fi eld near the study stand. Light measured at 50 cm above the forest fl oor was associated with the appropriate reference measures by the C-2000 computer program (LICOR Inc., Lincoln, NE), and light ratio transmitted at 50 cm above the forest fl oor was calculated.
2.2. Statistical Analysis
To maintain a balanced experimental design, jack pine stands were not included in the prelimi-nary analyses of variance (ANOVA). Prelimiprelimi-nary ANOVAs, with three fi xed factors (canopy type, time since fi re and surface deposit), were per-formed for the following dependant variables: shrub cover, herb cover, total understory cover, mountain maple biomass, and large-leaved aster biomass. Analyses were conducted on ranked cover and ranked mountain maple biomass data (Conover and Iman 1981). Biomass data for large-leaved aster was log transformed to satisfy the assumption of normality. The principal objec-tive of these analyses was to ensure that there was no interaction between forest composition and time since fi re. Therefore, data of only the 77, 81 and 84 year-old stands, which include all canopy types, were subjected to analysis of variance testing the effects of forest composition type and surface deposit. Herb cover, shrub cover, understory cover and large-leaved aster biomass were subjected to Tukey’s multiple comparison tests to identify the signifi cant differences among cover types. Because there is a signifi cant interac-tion between forest composiinterac-tion type and surface deposit for the mountain maple biomass, two other Tukey’s multiple comparison tests between canopy types were conducted for each surface deposit. All statistical analyses were performed using SAS (SAS Institute Inc. 1985)
It is diffi cult to distinguish the respective effects of nutrient and light availability on understory cover and biomass. Path analysis, by way of cor-relation and partial regression coeffi cients, can be used to estimate direct and indirect contributions between the standardized predictor and criterion variables (Sokal and Rohlf 1981, Legendre and Legendre 1983). The fi rst path analysis was per-formed to explore relationships between under-story cover, forest composition type (spruce-fi r basal area), surface deposit (silt-clay percent-age), nutrient availability (NH4 and silt-clay
per-centage), and light availability (stand height and spruce-fi r basal area). The second path analysis was performed to observe relationships between mountain maple biomass, canopy type (spruce-fi r basal area and aspen basal area), surface deposit (silt-clay percentage), nutrient availability
(exchangeable Ca) and light availability (stand height and spruce-fi r basal area). The third path analysis was performed to explore the relation-ship between herb biomass (large-leaved aster biomass), canopy type (spruce-fi r basal area), surface deposit (silt-clay percentage), and nutri-ent availability (NH4 available). Light availability
was removed from the model because its infl u-ence on large-leaved aster biomass was not sig-nifi cant. These path analyses were performed on Piste 3.1.1 (Université de Montréal (A. Vaudor), Montreal, Quebec), by way of Spearman correla-tion (SAS Institute Inc 1985).
3 Results
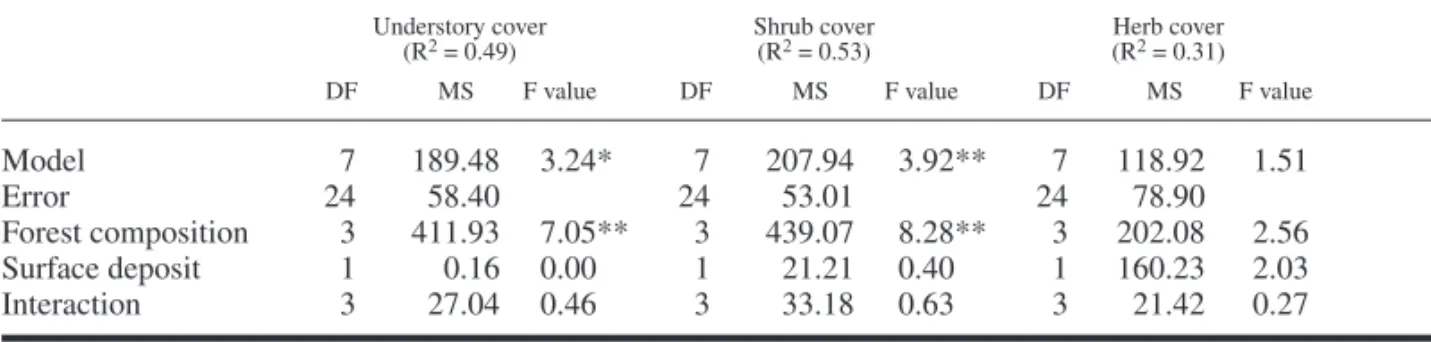
3.1 Effects of Forest Cover Type on
Indicator Species Biomass and on Total Understory, Shrub and Herb Cover Total understory cover was affected by forest canopy type, being lower under spruce-fi r stand than under any other forest composition (Table 3, Fig. 1). There was a strong effect of forest com-position on shrub cover, which was also lower under shade-tolerant coniferous stands than under white birch, aspen and jack pine stands (Fig. 2). Total herb cover and large-leaved aster biomass were unaffected by forest composition and sur-face deposit (Table 4). Mountain maple biomass was signifi cantly affected by forest composition, surface deposit and the interaction of these fac-tors. On clay, its biomass was signifi cantly lower under spruce-fi r stand than under jack pine and aspen stands. However, on till deposits, mountain
Table 3. Analysis of variance performed, on 77, 81 and 84 year old stands, on understory cover rank, shrub cover
rank and herb cover rank including all canopy types.
Understory cover Shrub cover Herb cover
(R2 = 0.49) (R2 = 0.53) (R2 = 0.31)
DF MS F value DF MS F value DF MS F value
Model 7 189.48 3.24** 7 207.94 3.92** 7 118.92 1.51 Error 24 58.40 24 53.01 24 78.90 Forest composition 3 411.93 7.05** 3 439.07 8.28** 3 202.08 2.56 Surface deposit 1 0.16 0.00** 1 21.21 0.40** 1 160.23 2.03 Interaction 3 27.04 0.46** 3 33.18 0.63** 3 21.42 0.27 200 150 100 50 0
Aspen Birch Spruce-fir
Pine Understory cover, % a b a a
Fig. 1. Tukey’s multiple comparison tests of understory
cover rank mean among forest composition types. Note: Columns with same letter are not signifi -cantly different according to Tukey’s test. Bars indicate standard deviation.
100 80 60
40
0
Aspen Birch Pine Spruce-fir
Shrub cover, % 20 a b a a
Fig. 2. Tukey’s multiple comparison tests of shrub cover
rank mean among forest composition types. Note: Columns with same letter are not signifi cantly different according to Tukey’s test. Bars indicate standard deviation.
maple biomass was lower in spruce-fi r stands than in both deciduous stands and it was also lower in jack pine stands than in white birch stands (Fig. 3).
3.2 Effects of Forest Composition, Nutrients and Light Availability
Total understory cover was positively related to NH4 availability, which was negatively associated
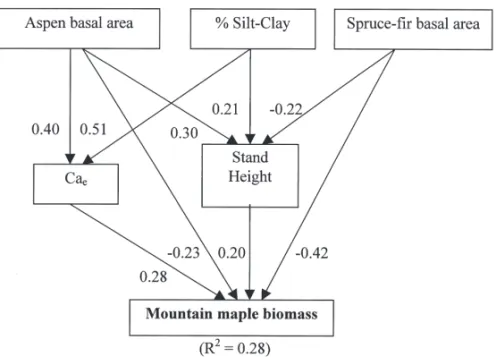
to spruce-fi r basal area. It was also positively related to stand height, which was negatively related to spruce-fi r basal area. Spruce-fi r basal area also had a direct negative relationship with understory cover (Table 5, Fig. 4). The silt-clay percentage is positively related to stand height but it had no causal relation with understory cover. The availability of calcium had a positive direct relationship with mountain maple biomass and exchangeable calcium was positively related to aspen basal area and silt-clay percentage. Moun-tain maple biomass was positively associated to stand height, which was related to aspen (positive effect) and spruce-fi r (negative effect) basal area and silt-clay percentage. Aspen and spruce-fi r basal area also had a direct negative relationship with mountain maple biomass (Table 6, Fig. 5). For clarity (Figs. 4 and 5), stand height was related to silt-clay percentage instead of calcium availability and to the acidity of the mineral soil, which had a strong direct relationship with stand height (model not shown). Large-leaved aster bio-mass was positively associated to available NH4
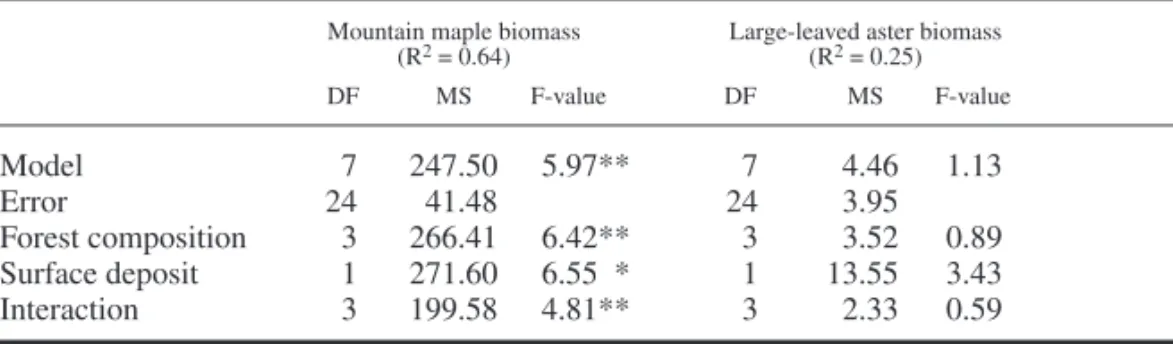
Table 4. Analysis of variance performed, on 77, 81 and 84 year old stands, on mountain maple
biomass rank and on large-leaved aster biomass including all canopy types.
Mountain maple biomass Large-leaved aster biomass
(R2 = 0.64) (R2 = 0.25) DF MS F-value DF MS F-value Model 7 247.500 5.97** 7 4.46 1.13 Error 24 41.488 24 3.95 Forest composition 3 266.411 6.42** 3 3.52 0.89 Surface deposit 1 271.600 6.55** 1 13.55 3.43 Interaction 3 199.58 4.81** 3 2.33 0.59 *= 0.01 < p < 0.05 ; ** = 0.001 < p < 0.01 ; *** = p < 0.001, DF: Degree of freedom, MS: Mean square
Mountain maple biomass, g/100m2 70000 50000 30000 0 10000 Aspen
Birch Pine Spruce-fir
Aspen Birch Spruce-fir
Pine
Mountain maple biomass, g/100m2
60000 40000 20000 0 a b ab ab a b ab a a b
Fig. 3. Tukey’s multiple comparison tests of mountain
maple biomass rank mean among forest composi-tion types over two surface deposits: a) clay and b) till. Note: Columns with same letter are not signifi cantly different according to Tukey’s test. Bars indicate standard deviation.
Table 5. Path analysis performed on spruce-fi r basal area (BAsf), percent silt-clay
(Clay), stand height (Height), available ammonium (NH4) and understory
cover (cover).
Relationship Total Causal Causal Causal Spurious covariation covariation covariation covariation correlation
direct indirect total
BAsf-Height –0.32 –0.32 0.00 –0.32 0.00 Basf-NH4 –0.29 –0.29 0.00 –0.29 0.00 BAsf-cover –0.65 –0.52 –0.13 –0.65 0.00 Clay-Height 0.22 0.22 0.00 0.22 0.00 NH4-cover 0.36 0.19 0.01 0.20 0.15 Height-cover 0.42 0.22 0.00 0.22 0.20
Table 6. Path analysis performed on aspen basal area (BAa), spruce-fi r basal
area (BAsf), percent silt-clay (Clay), stand height (Height), exchangeable calcium (Ca) and mountain maple biomass (maple).
Relationship Total Causal Causal Causal Spurious covariation covariation covariation covariation correlation
direct indirect total
BAsf-maple –0.42 –0.42 –0.04 –0.46 0.04 BAa-maple 0.10 –0.23 0.17 –0.06 0.16 Height-maple 0.30 0.20 0.00 0.20 0.10 Ca-maple 0.23 0.28 0.00 0.28 –0.05 BAa-Ca 0.42 0.40 0.00 0.40 0.02 Clay-Ca 0.52 0.51 0.00 0.51 0.01 BAsf-Height –0.32 –0.22 0.00 –0.22 –0.10 BAa-Height 0.38 0.30 0.00 0.30 0.08 Clay-Height 0.22 0.21 0.00 0.21 0.01
Table 7. Path analysis performed on spruce-fi r basal area, silt-clay percent,
available ammonium and large-leaved aster biomass (aster).
Relationship Total Causal Causal Causal Spurious covariation covariation covariation covariation correlation
direct indirect total
BAsf-aster –0.36 –0.30 –0.06 –0.36 0.00 NH4-aster 0.24 0.20 0.00 0.20 0.04
Clay-aster 0.33 0.36 0.00 0.36 –0.03 BAsf-NH4 –0.29 –0.29 0.00 –0.29 0.00
and silt-clay percentage, and negatively related to spruce-fi r basal area (Table 7, Fig. 6). Light availability at 50 cm above the forest fl oor had no direct relationship with aster biomass (model not shown). Light availability at 50 cm above the
forest fl oor cannot be considered as a predictive variable for the model of total understory cover and mountain maple biomass because shrub spe-cies grow higher than 50 cm.
Fig. 4. Path analysis performed on spruce-fi r basal area (BAsf), percent silt-clay
(Clay), stand height (Height), available ammonium (NH4) and understory
cover (cover). Causal relationships between predictor and criterion variables are depicted as arrows with the magnitude of the contribution (path coeffi cient) next to the arrow.
Fig. 5. Path analysis performed on aspen basal area (BAa), spruce-fi r basal area
(BAsf), silt-clay percent (Clay), stand height (Height), exchangeable calcium (Ca) and mountain maple biomass (maple). Causal relationships between predictor and criterion variables are depicted as arrows with the magnitude of the contribution (path coeffi cient) next to the arrow.
4 Discussion
The variation seen in the effect of forest composition on understory biomass suggests an infl uence of the stand structure. Our work seems to be consistent with that of Gilliam and Turrill (1993), who showed that understory layer is more limited by light availability when canopy is closed and stratifi ed. Messier et al. (1998) found that shade intolerant tree species such as aspen, white birch and jack pine, transmit more light than shade tolerant tree species such as balsam fi r and white spruce. The direct negative effect of spruce-fi r basal area on total understory could be explained by the light attenuation of the forest canopy. Furthermore, stand height, a factor positively related to light availability (Messier et al. 1998) has a direct infl uence on understory cover. Above-ground biomass is often related to light availability and to the structure of the canopy cover (Zavitkovski 1976, González-Hernández et al. 1998) and it is generally accepted that understory biomass is negatively affected by increasing tree canopy cover (Ohmann and Grigal 1985, Tappeiner and Zasada 1993, Huffman et al. 1994). The absence of signifi cant variation of herb layer (herb cover and large-leaved aster biomass) related to forest composition could be explained by the fact that light availability at the
forest fl oor level and at 50 cm above the forest fl oor is not signifi cantly different between stands of different composition (Messier et al. 1998, Légaré et al. 2001).
The infl uence of spruce-fi r basal area on the herb layer as well as the lower total understory and shrub cover in spruce-fi r stands could also be explained by the competition for water and nutrients between understory species and late-successional trees. Fine and small roots of aspen and white birch are well distributed in the soil profi le, whereas for late-successional trees such as balsam fi r and white spruce, the fi ne roots are concentrated in the humus layer and in the surface mineral soil (Grier et al. 1981, Gale and Grigal 1987, Finér et al. 1997), close to the roots of understory species. Interception of precipitation by the forest canopy could also contribute to the direct effect of spruce-fi r basal area on understory composition (Anderson et al. 1969).
Légaré et al. (2001) showed that through its infl uence on nutrient availability (Paré et al. 1993, Longpré et al. 1994, Brais et al. 1995, Paré and Bergeron 1996), forest composition affects under-story composition and Turner and Franz (1986) suggest that soil heterogeneity associated with tree species would infl uence the spatial distribu-tion of understory species. The negative reladistribu-tion- relation-ship between available ammonium and spruce-fi r Fig. 6. Path analysis performed on spruce-fi r basal area, silt-clay
percent, available ammonium and large-leaved aster biomass. Causal relationships between predictor and criterion variables are depicted as arrows with the magnitude of the contribution (path coeffi cient) next to the arrow.
basal area and the positive relationship with total understory cover observed in the present study, suggests an infl uence of nitrogen availability on understory cover. However, a signifi cant differ-ence in understory cover between conifer stands (jack pine and spruce-fi r) of lower soil fertility and deciduous stands of higher soil fertility was not observed.
The effect of forest composition on mountain maple biomass varied with surface deposit. In jack pine stands, a greater biomass of mountain maple on clay deposits, which contains high available Ca, suggests that nutrient availability has an important infl uence. Mountain maple is a relatively nutrient demanding species (Vincent 1965, Jobidon 1995) and is often nutrient limited (Aubin 1999). On till, the smaller biomass of mountain maple in jack pine stands among early-successional species stands can be explained by the negative infl uence of jack pine on available nutrients (Longpré et al. 1994). Thus, mountain maple could be replaced, to some extent, by another species that are better adapted to infertile soil (e.g., green alder (Alnus crispa (Ait.) Pursh.). Other studies have indicated an infl uence of forest composition on understory composition through an effect on soil nutrient availability (Bergeron and Bouchard 1983, Légaré et al. 2001). On clay, the differences observed among forest composi-tions was also linked to stand structure vari-ables such as total basal area, stand height and stand density, which affect light availability. The smaller biomass of mountain maple in aspen and white birch stands on clay deposits, could be related to the leaf area index (LAI) which is infl uenced by soil fertility (Zobel et al. 1976, Long and Smith 1988).
5 Conclusion
In this study, stand structure variables seems to explained variation in understory biomass among stands of different composition and availability of soil nutrients does not appear to be an important factor. In contrast, a companion study indicated that changes in understory composition among forests of different composition were strongly related to nutrient availability (Légaré et al. 2001).
The lack of a strong effect of nutrient availability on understory biomass suggests that understory species present in a given stand are well adapted to soil characteristics and that their growth is largely linked to light and water availability. How-ever, in full light conditions, when the canopy is removed, or on poor site, nutrient availability may become more critical to the understory and the better adapted species should be more competi-tive and produccompeti-tive.
Acknowledgements
This research was funded by the Natural Science and Engineering Research Council of Canada and the Quebec Department of Education (FCAR). We are also grateful to Marie-Claude Richard for great help in the fi eld work, and to Elizabeth Campbell, Mark Purdon and Gavin Kernaghan for revising the manuscript.
References
Abrams, M.D. & Dickmann, D.I. 1982. Early reveg-etation of clear-cut and burned jack pine sites in northern lower Michigan. Canadian Journal of Botany 60: 946–954.
Anderson, R.C., Loucks, O.L., & Swain, A.M. 1969. Herbaceous response to canopy cover, light inten-sity, and throughfall precipitation in coniferous forests. Ecology 50: 255–263.
Aubin, I. 1999. Végétation de sous-bois et disponibilité de la lumière dans la forêt boréale du sud-ouest québécois. Mémoire de maîtrise en biologie. Uni-versité du Québec à Montréal, Montréal, Québec. 85 p.
Bergeron, Y. 1991. The infl uence of lake and mainland landscapes on fi re regime of the boreal forest. Ecology 72: 1980–1992.
— 2000. Species and stand dynamics in the mixed-woods of Quebec’s southern boreal forest. Ecology 81: 1500–1516.
— & Bouchard, A. 1983. Use of ecological groups in analysis and classifi cation of plant communities in a section of western Quebec. Vegetatio 56: 45–63.
— & Dubuc, M. 1989. Succession in the southern part of the Canadian boreal forest. Vegetatio 79: 51–63.
— , Bouchard, A., Gangloff, P. & Camiré, C. 1983. La classifi cation écologique des milieux forestiers de la partie ouest des cantons d’Hébécourt et de Roquemaure, Abitibi, Québec. Études écologiques. Université Laval, Québec. 169 p.
Brais, S., Camiré, C., Bergeron, Y. & Paré, D. 1995. Changes in nutrient availability and forest fl oor characteristics in relation to stand age and forest composition in the southern part of the boreal forest of northwestern Quebec. Forest Ecology and Management 76: 181–189.
Brumelis, G. & Carleton, T.J. 1989. The vegetation of post-logged black spruce lowlands in central Canada. II. Understorey vegetation. Journal of Applied Ecology 26: 321–339.
Carleton, T.J. & Maycock, P.F. 1980. Vegetation of the boreal forest south of James Bay: non-centered component analysis of the vascular fl ora. Ecology 61: 1199–1212.
Conover, W.J. & Iman, R.L. 1981. Rank transformation as a bridge between parametric and nonparametric statistics. The American Statistician 35: 124–129. Dansereau, P.-R. & Bergeron, Y. 1993. Fire history in
the southern boreal forest of northwestern Quebec. Canadian Journal of Forest Research 23: 25–32. De Grandpré, L., Gagnon, D. & Bergeron, Y. 1993.
Changes in understory of Canadian southern boreal forest after fi re. Journal of Vegetation Science 4: 803–810.
Environnement Canada. 1993. Normales climatiques au Canada. Service de l’environnement atmos-phérique, Ottawa. 157 p.
Finér, L., Messier, C. & De Grandpré, L. 1997. Fine-root dynamics in mixed boreal conifer-broad-leafed forest stands at different successional stages after fi re. Canadian Journal of Forest Research 27: 304–314.
Gagnon, D. & Bradfi eld, G.E. 1986. Relationships among forest strata and environment in southern coastal British Columbia. Canadian Journal of Forest Research 16 : 1264–1271.
Gale, M.R. & Grigal, D.F. 1987. Vertical root distribution of northern species in relation to successional status. Canadian Journal of Forest Research 17: 829–834.
George, L.O. & Bazzaz, F.A. 1999. The fern under-story as an ecological fi lter: emergence and
estab-lishment of canopy-tree seedlings. Ecology 80: 833–845.
Gilliam, F.S. & Turrill, N.L. 1993. Herbaceous layer cover and biomass in a young versus a mature stand of a central Appalachian hardwood forest. Bulletin of the Torrey Botanical Club 120: 445–450. — , Turrill, N.L. & Adams, M.B. 1995.
Herbaceous-layer and overstory species in clear-cut and mature central Appalachian hardwood forests. Ecological Applications 5: 947–955.
González-Hernández, M.P., Silva-Pando, F.J. & Casal Jiménez, M. 1998. Production patterns of under-story layers in several Galician (NW Spain) wood-lands: seasonality, net productivity and renewal rates. Forest Ecology and Management 109: 251–259.
Grier, C.C., Vogt, K.A., Keyes, M.R. & Edmonds, R.L. 1981. Biomass distribution and above- and below-ground production in young and mature Abies amabilis zone ecosystems of the Washington Cacasdes. Canadian Journal of Forest Research 11: 155–167.
Grondin, P. 1996. Écologie forestière. In: Manuel de foresterie. Presse de l’Université Laval, Québec. p. 135–279.
Hendershot, W.H., Lalande, H. & Duquette, M. 1993. Ion exchange and exchangeable cations. In: Carter, M.R. (ed.). Soil sampling and methods of analysis. Canadian Society of Soil Science. p. 167–176. Host, G.E. & Pregitzer, K.S. 1992. Geomorphic
infl uences on ground-fl ora and overstory composition in upland forests of northwestern lower Michigan. Canadian Journal of Forest Research 22: 1547–1555.
Huffman, D.W., Tappeiner II, J.C. & Zasada, J.C. 1994. Regeneration of salal (Gaultheria shallon) in the central Coast Range forests of Oregon. Canadian Journal of Forest Research 72: 39–51.
Jobidon, R. 1995. Érable à épis. In: Autécologie de quelques espèces de compétition d’impor-tance pour la régénération forestière au Québec. Revue de la littérature. Mémoire de recherche forestière 117. Gouvernement du Québec, Québec. p. 54–61.
Kabzems, R. & Lousier, J.D. 1992. Regeneration, growth and development of Picea glauca under Populus spp. canopy in the boreal white and black spruce zone. FRDA research program, research branch, BC ministry of forest. FRDA report 176. Victoria, Canada. 35 p.
Légaré, S., Bergeron, Y. & Paré, D. 2001. Comparison of the understory vegetation in boreal forest types of southwest Quebec. Canadian Journal of Botany 79: 1019–1027.
Legendre, L. & Legendre, P. 1983. Numerical ecology. 2nd edition. Elsevier, New York. 197 p.
Lieffers, V.J. & MacDonald, S.E. 1993. Ecology of and control strategies for Calamagrostis canadensis in boreal forest sites. Canadian Journal of Forest Research 23: 2070–2077.
Long, J.N. & Smith, F.W. 1988. Leaf area – sapwood area relations of lodgepole pine as infl uenced by stand density and site index. Canadian Journal of Forest Research 18: 247–250.
Longpré, M.H., Bergeron, Y., Paré, D. & Béland, M. 1994. Effect of companion species on the growth of jack pine (Pinus banksiana). Canadian Journal of Forest Research 24: 1846–1853.
McKeague, J.A. (ed.). 1977. Manuel de méthodes d’échantillonnage et d’analyse des sols. Comité canadien de pédologie, Ottawa, Ontario. 223 p. Messier, C., Parent, S. & Bergeron, Y. 1998. Effects
of overstory vegetation on the understory light environment in mixed boreal forests. Journal of Vegetation Science 9: 511–520.
Morin, H., Laprise, D. & Bergeron, Y. 1993. Chronol-ogy of spruce budworm outbreaks in the Lake Duparquet region, Abitibi, Québec. Canadian Jour-nal of Forest Research 23: 1497–1506.
Nieppola, J.J. & Carleton, T.J. 1991. Relation between understory vegetation, site productivity, and environmental factors in Pinus sylvestris L. stands in southern Finland. Vegetatio 93: 57–72. Ohmann, L.F. & Grigal, D.F. 1985. Biomass distribution
of unmanaged upland forests in Minnesota. Forest Ecology and Management 13: 205–222.
Paré, D. & Bergeron, Y. 1996. Effect of colonizing tree species on soil nutrient availability in clay soil of the boreal mixedwood. Canadian Journal of Forest Research 26: 1022–1031.
— , Bergeron, Y. & Camiré, C. 1993. Changes in the forest fl oor of Canadian southern boreal forest after disturbance. Journal of Vegetation Science 4: 811–818.
Sagers, C.L. & Lyon, J. 1997. Gradient analysis in a riparian landscape: contrast among forest layers. Forest Ecology and Management 96: 13–26. SAS Institute. 1985. SAS user’s guide: statistics. 5th
edition. SAS Institute, NE. 956 p.
Sokal, R.R. & Rohlf, F.J. 1995. Biometry: the
princi-ples and practice of statistics in biological research. 3rd edition. W.H. Freeman and Co., San Francisco, California. 859 p.
Spies, T.A. & Barnes, B.V. 1985. A multifactor ecologi-cal classifi cation of the northern hardwood and conifer ecosystems of Sylvania Recreation Area, Upper Peninsula, Michigan. Canadian Journal of Forest Research 15: 949–960.
Ste-Marie, C. & Paré, D. 1999. Soil, pH, and N availability effects on net nitrifi cation in the forest fl oors of a range of boreal forest stands. Soil Biology and Biochemistry 31: 1579–1589. Tappeiner, J.C. & Zasada, J.C. 1993. Establishment of
salmonberry, salal, vine maple, and bigleaf maple seedlings in the coastal forests of Oregon. Cana-dian Journal of Forest Research 23: 1775–1780. Vincent, A.B. 1965. Growth habits of mountain maple
in the Ontario claybelt. Forestry Chronicle 41: 330–344.
Vincent, J.S. & Hardy, L. 1977. L’évolution et l’ex-tinction des lacs glaciaires Barlow et Ojibway en territoire québécois. Géographie Physique du Quaternaire 31: 357–372.
Zavitkovski, J. 1976. Ground vegetation biomass, pro-duction, and effi ciency of energy utilization in some northern Wisconsin forest ecosystems. Ecol-ogy 57: 694–706.
Zobel, D.B., McKee, W.A., Hawk, G.M. & Dyrness, C.T. 1976. Relations of environment to composi-tion, structure, and diversity of forest communi-ties of the central western Cascades of Oregon. Ecological Monographs 46: 135–156.
Appendix 1. Understory species status. Shrub species Herb species
Abies balsamea (L.) Actae rubra (Ait.) Goodyera Prunella
Mill. Willd. tesselata Lodd. vulgaris L.
Acer rubrum L. Apocynum Graminée spp. Pteridium
Acer spicatum Lam. androsaemifolium L. Dryopteris aquilinum (L.)
Alnus crispa (Ait.) Aralia nudicaulis L. disjuncta Kuhn
Pursh. Aster acuminatus (Ledeb.) Morton Pyrola
Alnus rugosa (DuRoi) Michx. Impatiens asarifolia
Spreng. Aster macrophyllus L. capensis Meerb. Michx.
Amélanchier spp. Athyrium fi lix- Kalmia Pyrola elliptica
Betula papyrifera femina (L.) Roth angustifolia L. Nutt.
Marsh. Carex spp. Linnaea borealis Pyrola virens
Cornus alternifolia L. Chenopodium L. Scheigger
Cornus stolonifera album L. Lonicera Ribes
Michx. Chiogenes hispidula candensis Bartr. glandulosum
Corylus cornuta (L.) T. & G. Lycopodium Grauer
Marsh. Circaea alpina L. lucidulum Michx. Ribes lacustre
Nemopanthus Clintonia borealis L. annotinum L. (Pers.) Poir.
mucronatus (L.) Trel. (Ait.) Raf. L. clavatum L. Ribes triste
Picea glauca Cornus Canadensis L. L. complanatum Pallas
(Moench)Voss Coptis groenlandica L. Rosa acicularis
Picea mariana (Mill.) (Oeder) Fern. L. obscurum L. Lindl.
BSP. Corallorhiza Maïanthemum Rubus idaeus L.
Populus tremuloides maculata Raf. canadense Desf. Rubus
Michx. Diervilla lonicera Mertansia pubescens Raf.
Prunus spp. Mill. paniculata (Ait.) Solidago
Salix spp. Dryopteris spinulosa G Don. rugosa Mill.
Sorbus americana (O.F.Muel.) Watt. Mitella nuda L. Streptopus Marsh. Epilobium Monotropa roseus Michx.
Taxus candensis angustifolium L. unifl ora L. Thelipteris
Marsh. Equisetum sylvaticum Osmunda noveboracensis
Thuja occidentalis L. L. claytoniana L. Dryopteris
Viburnum cassinoides Fragaria virginiana Oxalis Montana phegopteris (L)
L. Duchesne Raf. C. Chr.
Galium trifl orum Petasites palmatus
Appendix 2. Mountain maple biomass equations according to Aubin et Hély.
Total biomass (gram)
ln (total biomass) = –2.7348 + 2.7071 · ln (diameter) [R2 = 0.9793]
Correction factor = 1.034
Appendix 3. Large-leaved aster biomass equations according to Légaré.
Total biomass (gram / 1 m2)
log10 (aster biomass) = –0.18 + 0.69 log10 (percentage cover of aster / 1 m2) [R2 = 0.9000]