Private Placements by Small Public Entities: Canadian Experience
36
0
0
Texte intégral
(2) CIRANO Le CIRANO est un organisme sans but lucratif constitué en vertu de la Loi des compagnies du Québec. Le financement de son infrastructure et de ses activités de recherche provient des cotisations de ses organisations-membres, d’une subvention d’infrastructure du Ministère du Développement économique et régional et de la Recherche, de même que des subventions et mandats obtenus par ses équipes de recherche. CIRANO is a private non-profit organization incorporated under the Québec Companies Act. Its infrastructure and research activities are funded through fees paid by member organizations, an infrastructure grant from the Ministère du Développement économique et régional et de la Recherche, and grants and research mandates obtained by its research teams. Les partenaires du CIRANO Partenaire majeur Ministère du Développement économique, de l’Innovation et de l’Exportation Partenaires corporatifs Banque de développement du Canada Banque du Canada Banque Laurentienne du Canada Banque Nationale du Canada Banque Royale du Canada Banque Scotia Bell Canada BMO Groupe financier Caisse de dépôt et placement du Québec DMR Fédération des caisses Desjardins du Québec Gaz de France Gaz Métro Hydro-Québec Industrie Canada Investissements PSP Ministère des Finances du Québec Power Corporation du Canada Raymond Chabot Grant Thornton Rio Tinto Alcan State Street Global Advisors Transat A.T. Ville de Montréal Partenaires universitaires École Polytechnique de Montréal HEC Montréal McGill University Université Concordia Université de Montréal Université de Sherbrooke Université du Québec Université du Québec à Montréal Université Laval Le CIRANO collabore avec de nombreux centres et chaires de recherche universitaires dont on peut consulter la liste sur son site web. Les cahiers de la série scientifique (CS) visent à rendre accessibles des résultats de recherche effectuée au CIRANO afin de susciter échanges et commentaires. Ces cahiers sont écrits dans le style des publications scientifiques. Les idées et les opinions émises sont sous l’unique responsabilité des auteurs et ne représentent pas nécessairement les positions du CIRANO ou de ses partenaires. This paper presents research carried out at CIRANO and aims at encouraging discussion and comment. The observations and viewpoints expressed are the sole responsibility of the authors. They do not necessarily represent positions of CIRANO or its partners.. ISSN 1198-8177. Partenaire financier.
(3) Private Placements by Small Public Entities: Canadian Experience* Cécile Carpentier†, Jean-Marc Suret‡ Résumé / Abstract Au Canada, la majorité des placements privés sont émis par de petites entreprises en émergence, non rentables. Les problèmes d’asymétrie de l’information et d’anti-sélection sont particulièrement sévères. Les placements privés sont toutefois une source de financement très importante pour ces entreprises. Contrairement aux offres publiques, les placements privés sont émis dans le cadre du régime d’exemption, auprès d’investisseurs agréés dont on considère qu’ils ont les connaissances requises pour veiller à leurs intérêts financiers. L’objectif de l’étude est de déterminer dans quelle mesure les placements privés procurent un taux de rendement équitable aux investisseurs et si les investisseurs agréés sont en mesure d’apprécier correctement la valeur de ce type d’investissement. La réponse est négative. Mots clé : Placement privé, petites entreprises, réglementation des valeurs mobilières, politiques publiques, financement. In Canada, most of the private placements are offered by small and unprofitable entrepreneurial ventures -- for which the asymmetry of information and adverse selection problems are particularly acute. Private placements are a very important source of equity for these emerging businesses. In contrast with the public offering process, placements of shares are made in the exempt market with accredited or sophisticated investors. It is assumed that these investors would be knowledgeable enough to protect their own interests. The aim of this paper is to analyze the extent to which such private placements can be considered “fair”, i.e. if they provide investors with a fair rate of return and if accredited investors are indeed able to price these placements correctly in a context of large asymmetry of information. The answer is clearly negative. Keywords: Private placements, SME, securities regulation, public policies, financing. *. in Douglas J. Cumming, ed., Companion to Private Equity (Wiley, Chapter 8, forthcoming). Professor, Laval University and CIRANO Fellow, Faculty of Administrative Science, School of Accountancy. ‡ Corresponding author: Professor, Laval University and CIRANO Fellow, Faculty of Administrative Science, School of Accountancy, Pavilion Palasis-Prince, 2325 de la Terrasse, Laval University, Québec (Québec) Canada, G1V 0A6, phone: 418 656 7134, fax: 418 656 7746, email: Jean-Marc.Suret@fsa.ulaval.ca. †.
(4) INTRODUCTION The specificities of the Canadian securities market render the analysis of private placements particularly insightful in this country. First, Canada applies very lax listing requirements, allowing tiny capitalization companies to list at a pre-revenue stage (Carpentier et al. 2009). Most of the private placements are offered by these companies -- in essence, entrepreneurial ventures -for which the asymmetry of information and adverse selection problems are particularly acute. Second, public companies tend to use private placements more frequently than seasoned equity offerings as a financing source, probably owing to the lax regulation of this activity. Private placements seem to be a very important source of equity for these emerging businesses, which allows the analysis of a large number of placements. Third, hedge funds and other institutional investors that are strongly involved in the private equity activity in the U.S. are only marginally active in Canada, where individual investors are the main buyers of private placements. In contrast with the public offering process, placements of shares are made in the exempt market with accredited or sophisticated investors, and mandatory disclosure is dispensed with because it is assumed that these investors would be knowledgeable enough to protect their own interests. The question of whether such investors can indeed invest wisely in emerging companies should be analyzed. Lastly, in Canada, private placements are mainly composed of ordinary stocks, in contrast with the U.S., where structured private investments in public equity (PIPEs) make up a large proportion of private placements. The valuation problems associated with the specificities of structured PIPEs are then largely absent. This situation provides a unique opportunity to analyze the information and pricing dynamics around private placements, which are quite different from PIPEs in the U.S. The aim of this chapter is to analyze the extent to which this financing tool can be considered “fair”, i.e. if it provides investors with a fair rate of return and if accredited investors are indeed able to price these placements correctly in a context of large asymmetry of information. We observe a strong rally before the announcement and a significant negative abnormal return following the placement. This long-run underperformance persists even when the return is adjusted for the discount, providing an estimation of the rate of return of private equity investors. This indicates that, on average, the private investors overpaid for the shares they acquired during private placements. The implicit assumption behind the exempt distribution is that the. 1.
(5) sophisticated investors are informed and skilled enough to accurately appraise the stocks in which they invest. Our results evidence that this is not the case, particularly for growth and hard to value stocks, and that investors do not earn a fair rate of return. This chapter is organized as follows. In the next section, we present the Canadian securities market and regulation of private placement. We then examine the characteristics of issuers and their operating performance (Section 3), the returns surrounding the private placements (Section 4) and the discount (Section 5). In each case, we provide evidence taken from the population of private placements we analyzed and we attempt to explain the observed phenomenon in light of previous conceptual work and our knowledge of the specificities of the Canadian market. In the last section, we summarize and discuss our results in terms of policy, regulation and firm financing.1 THE CANADIAN CONTEXT To understand the characteristics of the private placement market in Canada, two main dimensions should be discussed: the Canadian securities market and the regulation. The Canadian Stock Market The stock market in Canada is devoted to small capitalization stocks. There are two important stock exchanges in Canada: Toronto Stock Exchange (TSX) and TSX Venture Exchange (TSXV). The first exchange is the main market, but it can be roughly considered a junior market, according to international criteria. The distribution of market capitalizations is similar to that observed on the Alternative Investment Market in London. The TSXV is considered a public venture capital market. Overall, only 245 companies listed in Canada do not fall in the small or micro capitalization categories, as defined by the Advisory Committee on Smaller Public Companies to the U.S. Securities and Exchange Commission (SEC). The very low initial listing requirements, the frequency of backdoor listings and the existence of a public venture capital market that feeds the main stock market with a large number of small firms at a pre-revenue or. 1. Some authors introduce a clear distinction between PIPEs and private placements in the U.S., even if these placements are done by public companies. PIPE investors receive warrants, price resets and other cash-flow rights that can differentiate their returns from those of shareholders (Chaplinsky and Haushalter 2006). Such a distinction is not required in Canada, where private placements are not identical to PIPEs in the U.S. Accordingly, we use the term ‘private placements’ to refer to private placements by public firms in Canada.. 2.
(6) pre-earning stage explain this particular situation. Carpentier and Suret (2009) illustrate that during the 1986-2006 period, the median pre-issue shareholders’ equity and gross proceeds of Canadian firms newly listed on the TSXV were CAN$260,000 and CAN$650,000 respectively. Moreover, more than 49% of issuers report no revenues and 80% report negative earnings. The majority of Canadian IPOs can be considered penny stock IPOs, while in most countries, minimal listing requirements exclude micro-capitalization and start-up companies from the stock exchange, even in so called junior markets. Their financial needs are generally modest and do not justify a public offering. This can explain the relative frequency of private placements. A second relevant dimension in the analysis of Canadian private placements is the relative importance of the resources and oil and gas sectors. At the end of 2004, TSX and TSXV mining companies had an aggregate market capitalization of US$140 billion, and represented over 50% of the world’s listed mining companies, according to data provided by the exchanges. More than 50% of the private placements originated from companies involved in the natural resource sector, where the financing tradition differs from those prevailing in other sectors. Regulation of Private Placements in Canada Regulation is another explanation for the popularity of private placements. The rules governing the exempt market are generally more lax in Canada than in the U.S. Several rounds of regulatory changes have been implemented in Canada, notably in 2001 and in 2006. The changes introduced in Ontario in 2001 through rule 45-501 and the shortening of lock-up periods implemented concomitantly in all Canadian provinces may have reduced the barriers for issuing private equity. These changes have mainly impacted private corporations.2 As this chapter is devoted to the private placements of public companies, we simply describe the main elements of the regulation of the types of transactions existing during our period of analysis. Prior to 2001, the legislation in many Canadian provinces, including Ontario, offered two exemptions from the requirement to issue a prospectus and register: the private company exemption and the $150,000 exemption, where people with $150,000 to invest were deemed sophisticated enough to make investment decisions without the need for a prospectus. Following the recommendations of the Ontario Securities Commission (OSC) Task Force on Small Business (Ontario Securities. 2. For an analysis of the impact of this regulatory change, see Carpentier et al. (2008).. 3.
(7) Commission 1996), the Ontario Government implemented significant changes to the securities regulation. In effect, Rule 45-501 replaces several previous exemptions with a closely held business issuer exemption and an accredited investor exemption. The accredited investor exemption permits issuers to raise any amount from any person or company that meets specified qualification criteria. Accredited investors include banks, loan and trust companies, insurance companies, the federal, provincial and municipal governments and their agencies and international counterparts, mutual funds and non-redeemable funds that distribute securities under a prospectus or to accredited investors, certain pension funds and charities, individuals (together with their spouses) with a net worth of at least $1,000,000, persons (together with their spouses) having had in the last two years and expecting in the next year a net income of not less than $200,000 individually or $300,000 as a couple, corporations and other entities having net assets of at least $5,000,000, directors, officers and promoters of an issuer and the issuer's controlling shareholders. Issuers are not required to provide accredited investors with an offering memorandum or other disclosure document. Further, several securities exchange commissions, including the OSC, have adopted the new Multilateral Instrument 45-102 Resale of Securities (MI 45-102). Essentially, this rule harmonizes certain provincial and territorial resale restrictions applicable to securities distributed under prospectus exemptions. The MI 45-102 also changes the resale restriction periods. Under the previous rule, securities acquired in a private placement are subject to a four-month holding period if the issuer is a qualifying issuer (i.e. if its securities are listed on an exchange). If the issuer is not a qualifying issuer, resale is restricted for twelve months. MI 45-102 reduces the restricted period from 12 to 4 months for the securities of a nonqualifying issuer. On September 14, 2005, the Canadian Securities Administrator's (CSA) National Instrument 45106 (NI 45-106) entitled “Prospectus and Registration Exemptions” became effective in most provinces. This rule was an effort to harmonize and consolidate the various prospectus and registration exemptions available across the country. This rule sets the minimum investment exemption uniformly across Canada. Securities can be sold on an exempt basis to any purchaser if the purchaser, acting as principal, acquires securities with an acquisition cost of not less than $150,000, which is paid in cash at closing. According to this regulation, firms can use the accredited investor exemption to raise any amount, at any time, from any person or company that. 4.
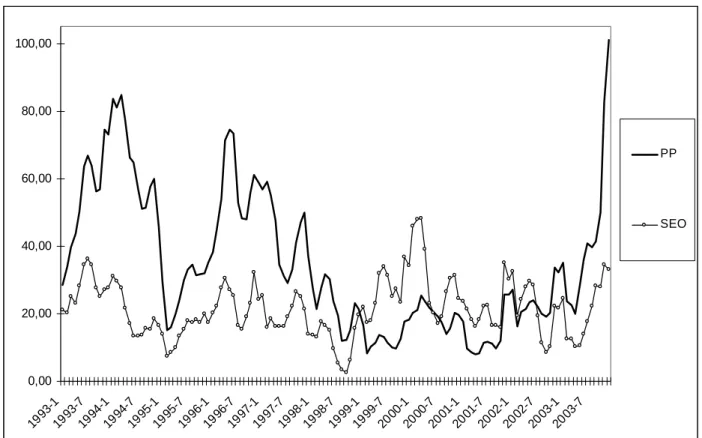
(8) qualifies as an accredited investor. To summarize, in Canada, numerous individuals and institutions can participate in private placements, and the resale restrictions are minimal. PRIVATE PLACEMENTS AND THE ISSUERS Data We collected information on 4,592 private placements from the Financial Post database, and provide similar information for seasoned equity offerings (SEOs) for comparison purposes. Our data span the 1993-2003 period. Table 1 illustrates that Canadian firms have issued more private placements than public SEOs. During the 1993-2003 period, private placements represented 61.60% of all Canadian post-initial public offering (IPO) placements. The gross proceeds raised by private placements are generally less than those raised in the public market. The median private placement is CAN$3 million, versus CAN$8.87 million for SEOs. We have probably overlooked a significant number of small size placements because private placements lower than CAN$1.5 million are not referenced in the database. The total proceeds obtained via private placements represent CAN$35.68 billion, i.e. 21.66% of the total post-IPO offerings. **Insert Table 1 about here** Table 1 shows strong variation in the number of private placements, from a high of 685 in 1996 to a low of 149 in 1999. The number of SEOs fluctuates to a lesser extent, and there is some indication of a switching effect: the year 1999 is a trough for private placements, but a peak for SEOs. To verify this possibility, we present the monthly numbers of both categories of financing in Figure 1. Apart from during the 1999-2000 period of the technology bubble, both categories exhibit a similar pattern. For Canadian public companies, private placements can be seen as a complement, rather than a substitute, to public financing. **Insert Figure 1 about here** Which Firms Issue Private Placements? Empirical studies report that the U.S. PIPE issuers are generally small capitalization firms with mean market value around $120 million and median value around $40 million. Kim (2002) states that more than 86% of PIPEs between January 1, 2001 and October 5, 2002 were issued by companies with assets below US$250 million. Brophy et al. (2005) report a median book value of assets of $25 million. The book-to-market ratio is a proxy for the growth opportunities of a firm.. 5.
(9) This ratio is lower for firms with more growth opportunities and higher for firms with fewer growth options. In the U.S., the median book-to-market ratio for companies issuing PIPEs is around 0.34 according to Krishnamurthy et al. (2004, p.12). Brophy et al. (2005) and Hertzel et al. (2002) find a median book-to-market ratio of 0.23 and 0.26 respectively. Companies issuing PIPEs seem to be growth-oriented. In Canada, private placements are often raised by small capitalized firms traded on the TSXV. However, during the 1993-2003 period, firms listed on the main board issued 1,500 private placements; approximately 70% of the TSX listed companies used this type of financing during this period. Accordingly, private placements are not limited to junior stocks and exchanges; they have entered into very widespread use among the vast majority of Canadian listed stocks. Table 2 presents the main characteristics of the Canadian issuers of private placements, and allows a comparison with U.S. studies. This table indicates that the issuers are generally small firms, with a median shareholders’ equity of CAN$10.69 million and total assets of CAN$15.17 million. This is in line with the characteristics of the Canadian market. Accordingly, the median gross proceeds are limited to CAN$3 million. The median book-to-market estimated at the end of the year preceding the placements is 0.49. This median book-to-market is higher than the one reported by Brophy et al. (2005) in their sample of 3,793 companies (0.23). Canadian private placement issuers seem to be smaller and to have fewer growth opportunities than the American companies issuing PIPEs. This can be traced to the fact that, in the U.S., private placements are more concentrated in the technology sector than in Canada. **Insert Table 2 about here** Industry Clustering There is evidence of industry clustering among companies issuing private placements. Hertzel et al. (2002) show that in their sample of 619 PIPEs, 55% of companies belong to six manufacturing and services industries (chemicals and allied products, electric and electronics equipment, holding and other investment offices, instruments and related products, industrial machinery and equipment and business services). Dresner and Kim (2003) show that PIPEs in the U.S. are primarily issued by technological and health companies, particularly biotechnological and pharmaceutical firms. Table 2 presents the industrial distribution of our sample of Canadian private placements over the 1993-2003 period, and shows that 68.07% of the private placements. 6.
(10) (60.29% of the total gross proceeds) are issued by natural resources companies. The other important issuing sectors are the technologies and biotechnologies sector, with 17.32% of the private placements (18.09% of the raised amounts). Canadian private placements are largely concentrated in the primary sector, which differs from the U.S. situation. Disparate industrial structures in both countries partly explain these differences. Faruqui et al. (2003) assert that the primary industry accounts for 8.2% of nominal output and 7.3% of hours worked in Canada, whereas these figures are 3.6% and 3.6% respectively in the U.S. We also calculate that 15.6% of public U.S. firms operate in the resources sector, whereas the corresponding proportion is 38% in Canada. Accordingly, this difference cannot totally explain the large concentration of private placements in the primary sector in Canada In Panel C of Table 2, we report the intended use of proceeds, where data were available. In line with the high proportion of issuers involved in activities linked to natural resources, 52.10% of private placements are assumed to finance exploration projects. Close to 30% of placements are levied to finance working capital (corporate uses) and only 18.81% finances investment projects. In Canada, emerging companies thus issue private placements to finance their development or their exploration projects. Financing Strategies and Clustering of Issuers Issuers and private placements constitute a very heterogeneous universe in Canada. Alongside a few large placements of half a billion dollars and more, we note hundreds of very small issues, which explain the median size of around CAN$3 million. Moreover, some issuers are occasional users of the private equity market, while others carry out private placements on a regular basis. In Table 3, we present a distribution of the issuers (Panel A) and of the placements (Panel B) to paint a better defined picture of this phenomenon. In Panel A, we observe that the four most active issuers (group 1) collectively attracted more than CAN$4 billion that is 11.50 % of the total amount of the private equity placements issued by public companies in Canada during the studied period. The mean market capitalization of these issuers is CAN$6.97 billion.3 This group is mainly composed of financials (Fairfax, Great-West Lifeco and Newcourt Credit Group) and of Falconbridge in the resources sector.. 3. We estimate the market capitalizations on a pre-money basis, before the most recent private placement.. 7.
(11) The second group consists of 37 issuers that each issued from CAN$100 million to CAN$500 million, for a total of CAN$5.77 billion. Together, the 41 most important issuers included in groups 1 and 2 levied approximately a quarter of the private equity gross proceeds, and launched four placements, on average, during the 10 years analyzed. Seventeen of these issuers belong to the resource sector, and 9 can be considered technology companies. The 401 firms included in group 3 issued four private placements in 10 years, on average; this type of financing has became commonplace for these firms. Each issuer in this group obtained an average amount of CAN$39 million from private equity investors during this period. These companies account for the bulk (44%) of the total gross proceeds, and the largest share of the placements (31.23%). The issuers are mid-sized companies (according to Canadian criteria), with a mean (median) market capitalization of CAN$188 ($88) million. Issuers in group 4 are small-sized, with a mean (median) market capitalization of CAN$47 ($25) million. They raised two placements, on average, for a total amount of CAN$10 million per firm, and a total for this group of CAN$8.06 billion. Lastly, group 5 consists of very small issuers whose median capitalization is about CAN$8 million. Collectively, they obtained CAN$2 billion from private equity issuers, and the average amount per issuer is CAN$2.3 million. The bulk of private placements are launched by medium-sized companies, which use this mode of financing on a regular basis. Smaller issuers are very active, as estimated by the number of placements, but the total proceeds are small. **Insert Table 3 about here** Operating Performance In the U.S., PIPEs are often considered as a financing mode for distressed or heavily constrained companies (Chaplinsky and Haushalter 2006; Gombola et al. 2006; Anderson and Rose 2007). We analyze the operational characteristics of Canadian issuers, both before and after the announcement. In each case, we collected the main accounting data for the 7 years surrounding the private placements, to analyze the evolution of this performance after the financing. Table 4 summarizes the results for each year from -3 to +3; the year 0 is the year of the private placement. In Panel A, we report the main statistics related to revenues, Panel B presents statistics on the operating income before depreciation (OIBD), and Panel C describes the raw and. 8.
(12) adjusted return on assets (ROA), estimated as follows. First, we purged the Canadian universe, by omitting issuing firms for the three years surrounding any equity issue. From this sample, we then estimated the median of the ratio for six size groups (estimated by the book value of equity) and by sector (3 digits, or 2, if the number of observations is lower than six). The abnormal performance of a firm is estimated by its raw return minus the median ratio of its size and sector matching group. Pre-issue performance The proportion of firms that report no revenues decreases from 46.94% to 39.36% at year 0 (the issue year). More than four out of every ten private issuers report no revenues at time -1, but the proportion decreases by the issue time. The issuers that do not report revenues are generally in the resources or technology sectors. Canadian issuers of private placements are indeed in the development stage, or are involved in exploration activities. However, the slight increase in the amount of operating revenues before the placements is consistent with an attempt to time these placements to coincide with a slight improvement in the numbers. However, the increase in revenues does not translate into a significant improvement in profitability. The median OIBD is largely negative before the placement and the proportion of negative OIBD fluctuates around 66%. This proportion increases up to year -1, and decreases slightly at the placement time. Reported values illustrate that a large proportion of Canadian issuers are in the early stages of development. The median raw ROA ratio, estimated after depreciation, is strongly negative. Although negative, the median ROA is high relative to the results reported for PIPEs in the U.S. The high proportion of resources and exploration firms explains this situation. They have few operations before the placement, and the net income is only slightly negative. The median ROA at time t=0 for technological firms is -32%, a result similar to the values reported by the U.S. studies. This result is in line with the observation of Hertzel et al. (2002) that PIPEs tend to follow periods of relatively poor operating performance. We also provide the industry-adjusted performance ratios, which indicate that while clearly negative, the operating performance of issuers is generally better than that of comparable non-issuer firms. This can partially explain why private investors agree to participate in these placements. **Insert Table 4 about here** Private Canadian issuers exhibit a negative median ROA, and a large proportion report negative 9.
(13) operating income. However, the proportion of firms reporting no revenues decreases before the placement, and the ROA is slightly higher than that of comparable firms. This can explain the relative optimism of private investors, who usually overprice the stocks that are sold during private placements, as evidenced by our analysis of the long-run performance following private placements. The post-placement performance Both sales and OIBD decrease after private placements. The proportion of no sales (negative OIBD) is 38.82% (66.60%) after the issue, but increases to 42.5% (66.94%) at the end of the third year following a private placement. The issuers we analyze fail to improve both their operations and their operating income in spite of a significant injection of equity. The median raw ROA decreases sharply after the placement. This effect is more evident when the ratio is adjusted for the sector and size effects. The median adjusted ROA falls from 3.02% at the time of the placement to -0.29% at year 3. There is a significant decrease in relative performance from the offering year to each of the following years for private placement issuers. In line with several studies on issues in the U.S., we observe a significant decrease in operating performance following private placements. One possible interpretation of this pattern is that managers use windows of opportunity, associated, for example, with a temporary increase in operational performance, to issue new equity. RETURNS SURROUNDING PRIVATE PLACEMENTS In this section we present the methodology used to estimate the abnormal return. We then examine the pre- and post-issue return of the individual investors. We conclude by analyzing the differences between the long-run performance, and discuss our results. The Estimation of Abnormal Returns The estimation of abnormal returns over the long-run is a difficult task. Event-time models such as cumulative abnormal returns or buy-and-hold returns (BHAR) suffer from numerous problems, especially when the studied events are clustered in time. As depicted in Figure 1, this is indeed the case with private placements. For this reason, we mainly focus on abnormal returns obtained through the alphas of the Three Factor Pricing Model (TFPM) developed by Fama and French (1993), but we complement the analysis by the estimation of the event-time abnormal. 10.
(14) returns. We estimate the following regression for each period analyzed (the year preceding the private placement, and one, two and three years after) R p ,t − R f ,t = α p + β p ( Rm,t − R f ,t ) + s p SMBt + h p HMLt + e p ,t. (1). The dependent variable of the regression is the monthly excess return of the portfolios (Rp,t - Rf,t), which corresponds for a given month t to the returns of the portfolio of private and public issuers (Rp,t) less the risk-free rate (the monthly rate of 91-day Canadian Government Treasury bills, Rf,t). The independent variables are the excess market return and two zero-investment portfolios constructed to mimic the risk factors common to all securities. SMB and HML are constructed according to Fama and French (1993). βp, sp, hp represent the loadings of the portfolio on each risk factor: the market, SMB (size) and HML (book-to-market ratio). The parameter (α) indicates the monthly average abnormal return of our private issuer sample. Market, risk factors and portfolio returns are value-weighted and capped. Following Loughran and Ritter (2000), we scrutinize the performance of private issuer portfolios using purged risk factors, to improve the power of the long-run performance tests.4 We eliminate returns from issuing firms during the 36month post-issue period in order to reduce benchmark contamination. We complement the analysis of post-event performance with the study of individual returns, at the issuer level using the BHAR method (namely the investor’s experience measure). These returns are estimated against reference portfolios composed of firms of comparable size and book-to-market ratio.5 To construct the reference portfolios, we extract Canadian firms’ book equity from the accounting database and estimate the book-to-market ratios after matching the stock market and accounting databases. To construct the size control portfolio, all Canadian stocks are ranked each month according to their market capitalization, and three portfolios are formed. Independently, all Canadian stocks are also ranked according to their book-to-market ratios, and three portfolios are formed. The returns of the nine monthly rebalanced portfolios are calculated as the value-weighted average of the individual-firm monthly returns in each of the size/book-to-market intersections. Each issuer is then assigned a control portfolio based on its 4. The intuition behind the notion of purged factor is that the performance cannot be correctly estimated if the benchmark is affected by the phenomenon analyzed, in this case the abnormal performance following private placements. Our results are materially the same when non-purged factors are examined. 5 Several authors use the control firm benchmark in lieu of or as a complement to the portfolio benchmark. We opt for portfolios. The characteristics of our sample are very particular, including a high proportion of firms at an early development stage, and with a limited life expectancy. The choice of a control firm could engender random results, in case of delisting and when the returns reach extreme values.. 11.
(15) market capitalization and book-to-market ratio over the performance test period examined. BHARs are based on the calculation of the average abnormal return from a buy-and-hold strategy from the RM month (1) to the month q (36):. BHAR 1 to q = ∑. Nq. w i*,q BHAR i ,1 to q i =1. q. q. s =1. s =1. , where BHAR i, 1 to q = ∏ (1 + Ri , s ) -∏ (1 + Rbi , s ). (2). Thus, BHARs measure the average multiyear returns from a strategy of investing in all firms issuing private placements and selling at the end of a particular holding period, versus a comparable strategy using a benchmark (Rbi). The Pre-Issue Return of the Public Investors We report, in Table 5, the results of the analysis of the pre-announcement run-up. The variable of interest is the alpha. This value indicates the monthly abnormal return when size and book-tomarket effects are accounted for. To simplify the interpretation of this result, we also report the annual equivalent abnormal return and the total abnormal return. We note a significant value weighted over-performance of 22.82% in the year preceding the announcement of the private placement. Our results are consistent with the price run-up observed during the year preceding the issue of U.S. private placements (Hertzel et al. 2002; Marciukaityte et al. 2005). We attempt to determine whether the abnormal performance is uniformly distributed over the months preceding the issue, or is concentrated in particular months. In the first case, it can be extrapolated that the market was optimistic about the firm (for reasons to be determined) and that the managers used this optimism to “time” the issue. If the latter situation prevails, and if the rally is concentrated in the few months preceding the announcement, then the timing hypothesis becomes less plausible. We examine four mutually exclusive windows: [-12;-10], [-9;-7], [-6;-4] and [-3;0]. The alpha coefficients corresponding to the [-12;-10] and [-9;-7] windows are not statistically significant, while that for the [-6;-4] window is positive and statistically significant, at 1.39%. The alpha coefficient of the [-3; 0] window is highly significant and reaches a monthly 3.29%, equivalent to an annual abnormal return of 39.48%. This analysis shows that most of the price run-up is concentrated in the last three months of the pre-announcement period. The concentration of the price run-up in the months immediately preceding the issue and the time necessary to decide on and organize an issue constitute challenging evidence against the timing hypothesis.. 12.
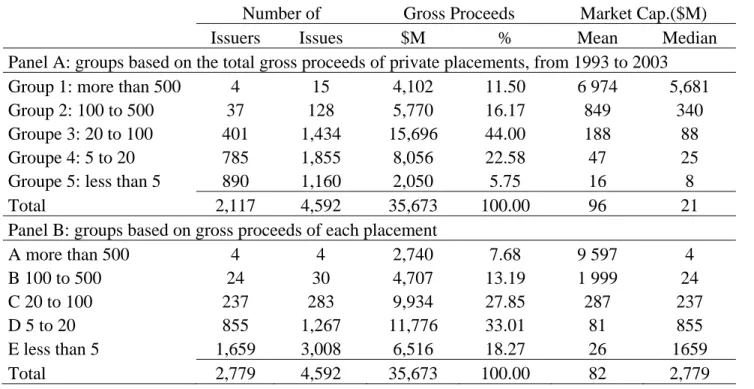
(16) **Insert Table 5 about here** To add to the evidence related to pre-issue run-ups, we examine the trading volumes. We observe strong signs of abnormal trading volume before the announcement date: this sharp increase in trading volume coincides precisely with stock price increases. We illustrate the evolution of the median relative trading volume in Figure 2. The average trading volume across the [-48; -37] period is used as a benchmark. For a given month t, the relative volume is expressed by the observed total trading volume divided by the benchmark. During month -1, before any official announcement of the placement, the median relative trading volume is 2.65 and the average is 8.7. Corresponding median (mean) values for month -3 are 2.11 (7.87). To verify the possibility of simultaneous events, we study the 70 private placements exhibiting the strongest increase in market value before the announcement in 2003. We examine all the official releases around the event date, as available in SEDAR and in article reference systems, but we do not detect any public announcement that could explain the observed excitement over the stocks. For this subsample, we also analyze the level of insider activity, using the trades summarized in SEDI.6 We note a strong increase in trading by insiders before the announcement. This result is consistent with the findings of Hauser et al. (2003) concerning insider trades before the announcement of placements aimed at limiting the dilution effect However, insider trading alone is not sufficient to explain the excess trading volume. First, after several months of rising prices, the insider trading activity escalates significantly at month -4. Second, the ratio of sell to buy of insiders is around 3. Insiders appear to use the temporary overvaluation around the announcements to realize significant gains.7 Our observations are consistent with opportunistic behavior of insiders after an unexpected increase in prices, and with the lack of fundamentals explaining the price increases in the year before the announcement. Our evidence seems in line with the hypothesis that the placement is a cause rather than a consequence of stock price increases. 6. SEDI stands for the System for Electronic Disclosure by Insiders, established by the applicable securities regulatory authorities. It has been available only since 2001, and does not allow electronic downloading of data, meaning that data must be collected. Accordingly, the analysis of insider trading around private and public equity issues has been left for further study, and we do not test for the significance of our estimations. 7 We estimate the gains and losses of each category of insiders between t-12 and t+12, where t is the announcement date. We assume that the acquisition cost of the shares owned at t-12 is the t-12 market price. We also assume that the selling price of the shares owned at t+12 is the market price at this moment. During the 25 months, we account for each transaction at the price recorded in SEDI. Each category of insiders appears as a winner, except for the “new insiders,” who become insiders by buying parts of the private placements.. 13.
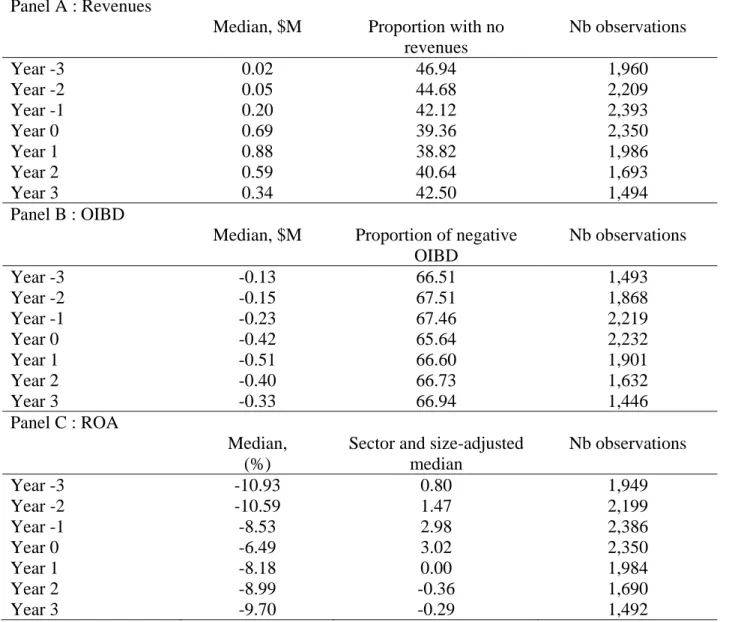
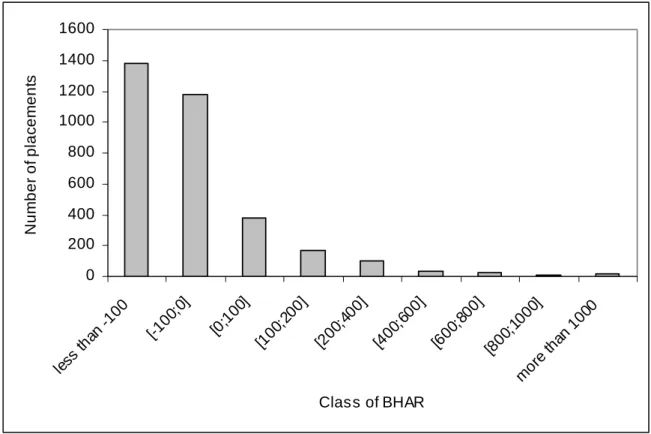
(17) **Insert Figure 2 about here** The Post-Issue Return of the Public Investors Panel B of Table 5 shows the monthly underperformance of the private issuers over the threeyear period following the issue based on alphas. The monthly abnormal return is -0.87%, for an annual return and a three-year equivalent of -10.47% and -31.42%, respectively. The aftermarket performance of private issuers over a three-year horizon is significantly negative, and the shares lose a third of their value during this period. A comparison with the abnormal returns estimated during shorter periods indicates that the performance decreases with the years. The aftermarket performance of private issuers tends to be worse three years after the issue than it is one or two years after the issue. The one-year post-issue abnormal performance is -8.32% versus -10.47% per year for the three-year performance. Our results are consistent with the three-year aftermarket performance observed for U.S. private equity placements (Hertzel et al. 2002; Brophy et al. 2005; Marciukaityte et al. 2005). This stock market performance is also consistent with the decrease in operating performance after the placement, which we document in the previous section. However, the previous results report average effects. We analyze the distribution of abnormal returns at the firm level, using the BHAR method. The results are stated in Figure 3. The adjusted return is lower than 100% in a sizeable proportion of private placements (41.84%). Such returns occur, for example, when the stock price falls sharply during a period where the market return is positive. A large proportion of private placements (35.95%) exhibits negative adjusted returns between -100% and 0. The total proportion of negative adjusted returns is 77.79%. On the opposite end of the distribution, a few private placements generate very large returns over the three years. We estimate that 2.49% of private placements are followed by returns in excess of 400%, and the proportion of outstanding returns over 1000% is 0.5%. Such a distribution is very close to the one observed in lotteries, and the stock issued during private placements in Canada can very likely be qualified as lottery stocks. These low-priced stocks exhibit high volatility and a poor expected return on average. They generate very high returns in a very limited number of situations. **Insert Figure 3 about here**. 14.
(18) Analysis of Differences in Long-Run Performance In the similar field of SEOs, several studies evidence that the long-run underperformance is essentially limited to small sub-samples of the issuer population. Eckbo et al. (2000, p.253) argue that the SEO issuers’ underperformance is driven primarily by relatively small-sized stocks. Gombola et al. (1999) note that issuers with greater growth opportunities are associated with worse post-SEO long-term performance. Brown et al. (2006) observe that overvalued (undervalued) SEO firms perform worse (better) than their benchmark in the post-issue period. Given the large heterogeneity in the private placements and the issuers, we attempt to determine whether patterns can be evidenced in the long-run performance of private placement issuers and if, as for SEOs, the performance is driven by certain sub-samples. We do not report the detailed results in tables, but we can summarize the results of this part of the analysis as follows. We investigate whether the glamour/value profile of issuing firms explains cross-sectional differences in long-run performance. We use the book-to-market ratio as a criterion to discriminate between glamour and value firms. We rank private issuers according to this criterion, and divide firms into two groups, using their respective medians as a breakpoint. We estimate the alpha coefficient for each sub-sample. The difference in performance between glamour and value issuers is very significant: glamour issuers statistically underperform value issuers. The underperformance of private issuers disappears for value issuers. The underperformance is negative but not significant over the threeyear horizon following the issue. By contrast, the underperformance is negative and very significant for glamour issuers: -29.88% over three years. The categorization into glamour and value issuing firms helps us to discriminate between a non-significant post-issue underperformance for value issuing firms and a very significant underperformance for glamour issuers. The long-run underperformance following private placements mainly concerns the glamour firms, and can be traced to the fact that most of the value of these issuers is composed of growth opportunities, rendering valuation mistakes more probable. This result is consistent with previous evidence obtained from samples of SEOs issuers. Discussion The poor market performance following private placements is consistent with the lack of improvement in the operating performance evidenced in the previous section. However, the. 15.
(19) reasons the shareholders are unduly optimistic at the private placement date are unclear and are generally in line with an irrational pricing of a subsample of private placements. Several authors contend that the return of private equity investors is normal because of the discount they receive when they negotiate the private placement. We analyze this hypothesis in the section devoted to the discount. Barclay et al. (2007) evidence a negative return for their sample of 559 private placements between 1979 and 1997, using an event-time methodology. They show that this negative abnormal performance is mainly driven by passive placements, and argue that managerial entrenchment could account for many private placements: managers would issue private placements with a discount to investors who would not intervene in business management, for which they would be rewarded. Another possible explanation is that the distribution of returns of private equity issuers is highly skewed. In such a case, the preference for skewness can explain the abnormal low performance. Finally, Canadian private equity issuers are strongly financially constrained and, in several cases, in a distress situation. For the shareholders, the announcement of a private placement is equivalent in a sense to an easing of the constraint, a lower probability of failure, certification by outside, and likely knowledgeable, investors of the potential of the firm, or a combination of these elements. Overreaction to these pieces of information can explain long-run underperformance. DISCOUNTS As private placements are generally sold at a discount, the long-run return available to private equity investors may differ from the return of investors that are not involved in the placement (i.e. public investors). For example, Krishnamurthy et al. (2005) find that although the shareholders not participating in the placement experience post-issue negative long-term abnormal returns, the participating investors purchase the shares at a discount and earn normal returns. Accordingly, we examine the previous evidence and explanation of the discount, and estimate the returns for both categories of investors in Canadian private placements. Previous Evidence and Explanations Private placements are generally issued at a discount, i.e. at a price lower than the market price of the equivalent public stock. In the U.S., the discount varies between 9% and 20%. Some placements (approximately 20%), however, are carried out at par, or with a premium. The estimated discounts depend partly on the nature of the securities issued. According to Kim. 16.
(20) (2002), when nonconvertible ordinary stocks are issued without warrant, the discount is 9%; it reaches 22% when fixed price warrants are issued jointly. Wu (2004) maintains that the discount could be related to the costs incurred to motivate informed investors to reveal positive information. Under tacit contracts, the discount rewards investors that reveal information that would have been in their best interest not to disclose. The effect of a private placement dominated by informed investors is then positive. The discount could also be connected to the assumptions of self-dealing or entrenchment. The effect of a private placement dominated by informed investors would then be negative. Barclay et al. (2007) document a significantly lower discount for PIPEs carried out by active investors (-1.8% on average and -7.5% in median) compared with those done by passive investors (-20.8% and -19.5%). They conclude that the price discount rewards investor passivity. The authors also show that, in the medium term, post-issue returns are significantly negative, which confirms the assumption of entrenchment. In the same vein, Dai (2007) shows that venture capitalist and hedge funds differ in their willingness to monitor management. For example, hedge funds do not sit on the board of the company in which they invest, and cash out shortly, whereas VCs sit on the board and usually stay invested longer than one year. Dai finds that the mean discount of venture capital-led PIPEs is significantly lower (3%) than the mean discount of hedge fund-led PIPEs (15.4%). Krishnamurthy et al. (2004, p.18) posit that the discount could also compensate for the lack of liquidity of the private placements, because of the two-year restriction on the resale of non-registered securities. The discount for stocks subject to such a resale restriction is 34% compared with 19.44% for other stocks. However, because this discount also exists for stocks not subject to resale restrictions, the authors conclude that the lack of liquidity does not suffice to explain it. In Canada, Maynes and Pandes (2008) associate the discount with the lack of liquidity and information asymmetry. They show that private placements with shortened resale restrictions made by firms with less information asymmetry are offered with smaller price discounts. They affirm the importance of liquidity in the market for private placements. Our objective is not to explain the discounts, but rather to estimate this discount as part of our calculation of the return earned by the private equity investors. Measure and Stylized Facts In keeping with common practices, we calculate the discount using the issue price of the private placement and the market price 10 days after the announcement date. First, Table 6 presents the 17.
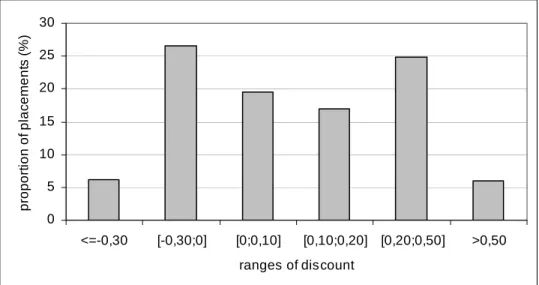
(21) main parameters of the distribution of discounts on an annual basis to evidence changes over time. The median of the distribution is 9.09%, which is close to the mean (10.54%). The discounts observed in Canada are lower than those reported in the U.S. However, the crosssectional and time variations in discounts are very large. Discounts are considerable in 19931994, and then in 2000, when the median discount reaches 11.76%. In 1998, 2001 and 2002, the median discount is less than or equal to 5%. In 2001, 47.95% of private placements command a premium. The crash of the technologies sector occurs later in Canada than in the U.S., and most of the private placements are observed before the decrease in technological values (September). This can explain the low level of discount, as investors were very optimistic during this period. The interquartile range shows that, for each year, the dispersion of discount is also very wide. The 25th percentile is generally negative, indicating a premium, while the 75th percentile reveals that 25% of private placements are sold at a discount higher than 25%. For the whole period, the proportion of private placements sold at a premium is 28.37%. The proportion is higher than the one reported in the U.S. but is in the same range as the proportion reported in New Zealand by Anderson (2006). Figure 4 illustrates the very large dispersion of the discount across the placements. The explanation of these differences has been left for further studies. **Insert Figure 4 about here** Discount and Long-Run Performance In this section we analyze the relation between long-run performance and the discount. We observe a significant negative relation between both measures. The group of issuers that posts positive long-run abnormal performance also exhibits lower discounts. The difference in discount between the two groups based on the long-run performance is 4.5%. This is consistent with the fact that private equity investors negotiate the discount as a partial compensation for the paltry performance of the stocks in the future. It is worth exploring whether this discount is large enough to provide a “fair” rate of return. To estimate the return obtained by the private investors, we adjust the buy-and-hold return estimated at the firm level for the discount. If BHARi is the abnormal return for the public investor in firm i that sold a private placement at a discount of 20%, the abnormal return for the private investor is BHARAi = [(1+ BHARi) x (1+0.20) – 1]. We estimate this return for each placement. After three years, the average abnormal returns of the public investors, according to this method, is -21.80% and the median of the individual abnormal returns is -80.48%. Corresponding values 18.
(22) for the sophisticated investors that participate in the private placement are -15.84% and. -. 78.17%. This evidences that the private investors are unable to price the placements correctly, and that their long-run return is abnormally low, from both the economic and statistical standpoints. The discount is too low to provide these investors with a fair rate of return. Even for private investors that obtain shares at a reduced price, private placements are not a good investment, on average and for a very large proportion of the population. One possible explanation for this result, which contrasts with the U.S. situation, is that in Canada most of the private placement investors are individuals. They seem to be unable to correctly appraise the value and risk of these placements. CONCLUSION We analyze the various dimensions of private placements by Canadian issuers, which generally concern small and emerging companies, operating mainly in sectors associated with natural resources or technology. These issuers exhibit poor operating performance at the placement time. At the end of the fiscal year preceding the placement, 67.46% of Canadian private placement issuers report negative operating income, even before depreciation. Private placements appear to be a very important source of equity for these small and medium-sized businesses, and the number of private offerings largely surpasses the number of public seasoned equity offerings. The number of firms reporting revenues increases before the event, yet the operating performance, already poor at the placement time, deteriorates after the placement. The return pattern surrounding the private placements is in line with the observation of previous studies in the U.S. We observe a strong rally before the announcement and a significant negative abnormal return following the placement. The long-run underperformance subsists even when the return is adjusted for the discount. This indicates that on average, the private investors overpaid for the shares they acquired during private placements. These results raise three important questions. First, did the managers of emerging firms time the market with private placements, as evidenced in several previous studies of public offerings? Second, are exempt investors able to correctly assess the value of private placements, as the exempt system implicitly assumes? Third, why do public and private investors willingly keep or even acquire stocks of private equity issuers if the average adjusted long-run return is abnormally low? The answer to the first question is mixed. There are signs of a slight revenue increase before the placement, but this increase has no effect at the operating income level. After the placement,. 19.
(23) all indicators of operating performance decrease sharply. Such a pattern is consistent with the timing proposition, as is the return pattern surrounding the placements. However, the following observations are less consistent with the timing proposition. The increase in operating performance is very slight, and most of the issuers report a loss at the placement time. This situation has nothing in common with the strong performance observed before the announcement of U.S. seasoned equity offerings, for which timing is an explanation often invoked. Second, the issuers generally lack the financial slack required to effectively time the market. Without the placement, most of them would be out of business in the month following the placement and would hardly be able to defer the financing round. Third, the pre-announcement rally is observed only during the few months immediately before the announcement, when the placement decision has already been made and the discussions with potential investors already held. The rally, like the increase in trading volume we observe at this time, can probably be explained by the rumour of a private placement that relaxes the financial constraints binding the issuer. According to Gray and Kitching (2005)8: “private placements offer securities to a limited group of investors through an exempt distribution. In a private placement, the company is exempt from certain securities laws, such as the requirement to prepare a prospectus (…), that would otherwise apply if the securities were being sold to the general public. The issuer can sell shares only to a limited group of “sophisticated” investors, such as banks, pension funds, and wealthy individuals, or to company insiders (i.e., a director, senior officer, or employee of the issuing company).” The implicit assumption behind the exempt distribution is that the sophisticated investors are informed and skilled enough to accurately appraise the stocks in which they invest. Our results evidence that this is not the case, particularly for growth and hard to value stocks. Sophisticated investors that invest in private placements in Canada realize abnormally low returns during the years following their placement, even when we disregard the lack of liquidity of these investments. Further work could examine which category of exempt investors suffers the most from investing in private placements. The last, and perhaps most important question to explore is why the former shareholders of the private placement issuer do not sell their shares at the time of the announcement, and why private investors are involved in financing transactions that provide a poor adjusted rate of return in the 8. See Gray, T. and A. Kitching, 2005, “Reforming Canadian Securities Regulation,” September 19, Library of Parliament, at http://www.parl.gc.ca/information/library/PRBpubs/prb0528-e.htm.. 20.
(24) long-run. One explanation is that stocks issued during private placements are lottery stocks, which can provide huge returns in a very few cases but a total loss in the majority of cases. The return’s distribution is highly asymmetric, but several authors demonstrated that individual investors have a preference for skewness and lottery stocks (Kumar 2007; Bali et al. 2008). This explanation seems to be the most plausible in the Canadian context.. 21.
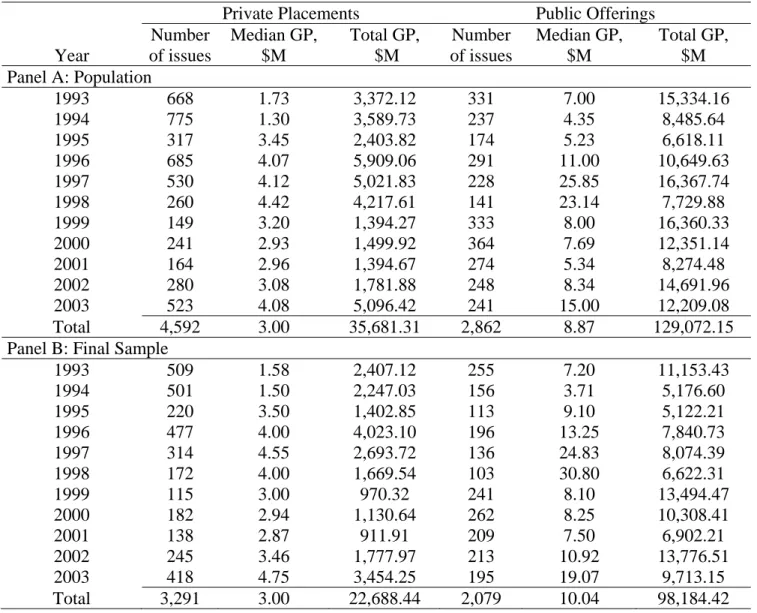
(25) Table 1 Annual Statistics on Canadian Private Placements and Public Offerings by Issuers Listed on the Canadian Stock Exchanges from 1993 to 2003. Panel A reports the population of 4,592 Canadian private placements and 2,862 public offerings that occurred between January 1993 and December 2003. All issues are equity issues reported by the Financial Post database which comprise common stocks and unit (equity and warrant). Panel B reports the final sample restricted to observations, with market data (DataStream) and with accounting data (Thomson’s Cancorp financials). Each of the following placements, reported as distinct in the database, is considered as a single issue: two sets of units placed within a few days; two sets of securities, issued within 5 transactions days, with one of them being a flow-through; an SEO sold simultaneously in several countries; and securities placed under the same conditions and at the same price with several investors, within five transaction days. This method reduces the sample by 396 issues. We include in the analysis companies with market data for the 3 months before and after the placement date. Gross proceeds (GP) are expressed in millions of Canadian dollars ($M).. Number Year of issues Panel A: Population 1993 668 1994 775 1995 317 1996 685 1997 530 1998 260 1999 149 2000 241 2001 164 2002 280 2003 523 Total 4,592 Panel B: Final Sample 1993 509 1994 501 1995 220 1996 477 1997 314 1998 172 1999 115 2000 182 2001 138 2002 245 2003 418 Total 3,291. Private Placements Median GP, Total GP, $M $M. Number of issues. Public Offerings Median GP, Total GP, $M $M. 1.73 1.30 3.45 4.07 4.12 4.42 3.20 2.93 2.96 3.08 4.08 3.00. 3,372.12 3,589.73 2,403.82 5,909.06 5,021.83 4,217.61 1,394.27 1,499.92 1,394.67 1,781.88 5,096.42 35,681.31. 331 237 174 291 228 141 333 364 274 248 241 2,862. 7.00 4.35 5.23 11.00 25.85 23.14 8.00 7.69 5.34 8.34 15.00 8.87. 15,334.16 8,485.64 6,618.11 10,649.63 16,367.74 7,729.88 16,360.33 12,351.14 8,274.48 14,691.96 12,209.08 129,072.15. 1.58 1.50 3.50 4.00 4.55 4.00 3.00 2.94 2.87 3.46 4.75 3.00. 2,407.12 2,247.03 1,402.85 4,023.10 2,693.72 1,669.54 970.32 1,130.64 911.91 1,777.97 3,454.25 22,688.44. 255 156 113 196 136 103 241 262 209 213 195 2,079. 7.20 3.71 9.10 13.25 24.83 30.80 8.10 8.25 7.50 10.92 19.07 10.04. 11,153.43 5,176.60 5,122.21 7,840.73 8,074.39 6,622.31 13,494.47 10,308.41 6,902.21 13,776.51 9,713.15 98,184.42. 22.
(26) 19 93 19 -1 93 19 -7 94 19 -1 94 19 -7 95 19 -1 95 19 -7 96 19 -1 96 19 -7 97 19 -1 97 19 -7 98 19 -1 98 19 -7 99 19 -1 99 20 -7 00 20 -1 00 20 -7 01 20 -1 01 20 -7 02 20 -1 02 20 -7 03 20 -1 03 -7. Figure 1 Monthly Canadian Private Placements (PP) and Seasoned Public Offerings (SEO) in Canada, from 1993 to 2003. 100,00. 80,00 PP. 60,00. SEO. 40,00. 20,00. 0,00. 23.
(27) Table 2 Sample characteristics and distribution of the sample of private placements according to industry and use of proceeds. Panel A reports the sample characteristics. Gross proceeds, total assets and shareholders’ equity are expressed in millions of Canadian dollars ($M). Proceeds-to-size is the gross proceeds divided by the pre-money market value of equity. BTM stands for book to market, T0 for the end of the issuing year, and T-1 for the end of the preceding year. Total assets, shareholders’ equity and debt ratios are estimated on a post-money basis. Panel B reports the industrial distribution. Resources, Oil & Gas, High Tech and Other is the percentage of the total gross proceeds of private (public) issues respectively by resources, oil and gas, high tech-biotech and other companies. Panel C reports the distribution of issues according to the use of gross proceeds. Total gross proceeds (TGP) are expressed in millions of Canadian dollars ($M). # stands for the number of issues. Panel A: General characteristics Gross proceeds, $M Proceeds-to-size BTM >0 at time T-1 Total assets T0, $M Shareholders’ equity T0, $M Debt to assets T0 Panel B: sector distribution. Gross proceeds Number of issues Panel C: Use of Gross Proceeds Exploration Investment Corporate Not available. # 3,291 3,234 2,337 2,352 2,352 2,352. Mean 6.89 0.55 0.49 74.23 34.53 0.39. Median 3.00 0.27 0.22 15.17 10.69 0.22. Total 22,688.44 -. Resources 35.49% 41.36%. Oil & Gas 24.80% 26.71%. High Tech 18.09% 17.32%. Other 21.62% 14.62%. # 1,379 498 770 644. #% 52.10% 18.81% 29.09% -. TGP $M 7,436.01 5,633.26 5,915.70 3,703.46. TGP% 39.17% 29.67% 31.16% -. 24.
(28) Table 3 Distribution of private placement issuers based on the total (Panel A) and per placement gross proceeds (Panel B). Gross proceeds are expressed in millions of Canadian dollars ($M). Number of Gross Proceeds Market Cap.($M) Issuers Issues $M % Mean Median Panel A: groups based on the total gross proceeds of private placements, from 1993 to 2003 Group 1: more than 500 4 15 4,102 11.50 6 974 5,681 Group 2: 100 to 500 37 128 5,770 16.17 849 340 Groupe 3: 20 to 100 401 1,434 15,696 44.00 188 88 Groupe 4: 5 to 20 785 1,855 8,056 22.58 47 25 Groupe 5: less than 5 890 1,160 2,050 5.75 16 8 Total 2,117 4,592 35,673 100.00 96 21 Panel B: groups based on gross proceeds of each placement A more than 500 4 4 2,740 7.68 9 597 4 B 100 to 500 24 30 4,707 13.19 1 999 24 C 20 to 100 237 283 9,934 27.85 287 237 D 5 to 20 855 1,267 11,776 33.01 81 855 E less than 5 1,659 3,008 6,516 18.27 26 1659 Total 2,779 4,592 35,673 100.00 82 2,779. 25.
(29) Table 4 Main statistics related to the operating performance of private equity issuers during the seven years surrounding the announcement. Revenues and operating income before depreciation (OIBD) are expressed in millions of Canadian dollars ($M). ROA means return on assets. Panel A : Revenues Median, $M Year -3 Year -2 Year -1 Year 0 Year 1 Year 2 Year 3 Panel B : OIBD. Proportion with no revenues 46.94 44.68 42.12 39.36 38.82 40.64 42.50. Nb observations. Nb observations. -0.13 -0.15 -0.23 -0.42 -0.51 -0.40 -0.33. Proportion of negative OIBD 66.51 67.51 67.46 65.64 66.60 66.73 66.94. Median, (%) -10.93 -10.59 -8.53 -6.49 -8.18 -8.99 -9.70. Sector and size-adjusted median 0.80 1.47 2.98 3.02 0.00 -0.36 -0.29. Nb observations. 0.02 0.05 0.20 0.69 0.88 0.59 0.34 Median, $M. Year -3 Year -2 Year -1 Year 0 Year 1 Year 2 Year 3 Panel C : ROA. Year -3 Year -2 Year -1 Year 0 Year 1 Year 2 Year 3. 1,960 2,209 2,393 2,350 1,986 1,693 1,494. 1,493 1,868 2,219 2,232 1,901 1,632 1,446. 1,949 2,199 2,386 2,350 1,984 1,690 1,492. 26.
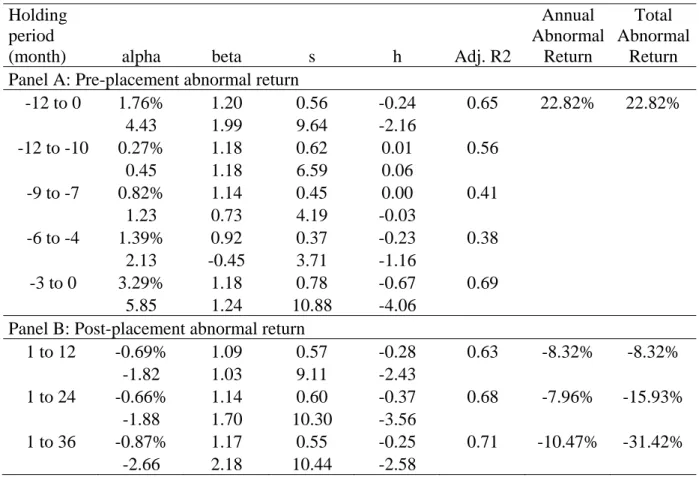
(30) Table 5 Abnormal Returns of Canadian Private Issues Using the Fama-French Three-Factor Pricing Model as a Benchmark. We estimate abnormal returns for the year preceding the private placements, during four mutually exclusive pre-event windows: [-12;-10], [-9;-7], [-6;-4], and [3;0] and for the one-, two-, and three-year horizons following a private placement. The sample comprises 3,291 private placements that occurred from January 1993 through December 2003. We examine value-weighted (monthly-rebalanced) calendar-time portfolio returns. We regress the monthly excess returns to the calendar-time portfolios, R p,t − R f ,t , on the Fama-French (1993) threefactor model:. R p ,t − R f ,t = α p + β p ( R m ,t − R f ,t ) + s p SMBt + h p HMLt + e p ,t. (Rp,t - Rf,) corresponds, for a given month t, to the returns of the portfolios of private and public equity issues (Rp,t) less the risk-free rate (the monthly rate of 91-day Canadian Government Treasury bills, Rf,t). βp, sp, hp are the loadings of the portfolios on each risk factor: the market (10% capped index), purged SMB (size) and purged HML (book-to-market ratio). α indicates the monthly average abnormal return of our private equity issue sample. We estimate the weighted least squares (WLS) time series regression in which the weights are proportional to the square root of the number of firms present in each month t. The t-statistics for each parameter are shown below each estimated parameter. H0 for the β coefficient is β equal to one. Holding period (month) alpha beta s Panel A: Pre-placement abnormal return -12 to 0 1.76% 1.20 0.56 4.43 1.99 9.64 -12 to -10 0.27% 1.18 0.62 0.45 1.18 6.59 -9 to -7 0.82% 1.14 0.45 1.23 0.73 4.19 -6 to -4 1.39% 0.92 0.37 2.13 -0.45 3.71 -3 to 0 3.29% 1.18 0.78 5.85 1.24 10.88 Panel B: Post-placement abnormal return 1 to 12 -0.69% 1.09 0.57 -1.82 1.03 9.11 1 to 24 -0.66% 1.14 0.60 -1.88 1.70 10.30 1 to 36 -0.87% 1.17 0.55 -2.66 2.18 10.44. h. Adj. R2. -0.24 -2.16 0.01 0.06 0.00 -0.03 -0.23 -1.16 -0.67 -4.06. 0.65. -0.28 -2.43 -0.37 -3.56 -0.25 -2.58. Annual Total Abnormal Abnormal Return Return 22.82%. 22.82%. 0.63. -8.32%. -8.32%. 0.68. -7.96%. -15.93%. 0.71. -10.47%. -31.42%. 0.56 0.41 0.38 0.69. 27.
(31) Figure 2 Evolution of the Median Relative Trading Volume of Private Issuers. We estimate the relative monthly trading volume for each of the private issuers, for the [-12; +24] month windows around the announcement, which occurs in the first day of month 0. Incomplete series of volumes are deleted, and overlapping events are omitted. For each sample, the average trading volume across the [-48; -37] period is estimated and used as a benchmark. For a given month t, the relative trading volume is given by the observed total trading volume divided by the benchmark.. 5,00 4,50. Trading Volume. 4,00 3,50 3,00 2,50 2,00 1,50 1,00 0,50 0,00. -12 -10 -8. -6 -4. -2. 0. 2. 4. 6. 8 10 12 14 16 18 20 22 24. Months. 28.
(32) Figure 3 Distribution of abnormal returns during the three years following the private placement. We estimate the relative monthly trading volume for each of the private and public issuers, for the [0; +36] month windows around the announcement, which is located in the first day of month 0. We use the buy and hold method to estimate these individual returns.. 1600. 1200 1000 800 600 400 200. 00 10. m. or. e. th an. 0; 10 0. 0]. ] [8 0. 0; 80 0 [6 0. 0; 60 0. ]. ] [4 0. 0; 40 0. ] [2 0. 0]. 0; 20 0 [1 0. [0 ;1 0. 00 ;0 ] [-1. th an. -1. 00. 0. le ss. Number of placements. 1400. Class of BHAR. 29.
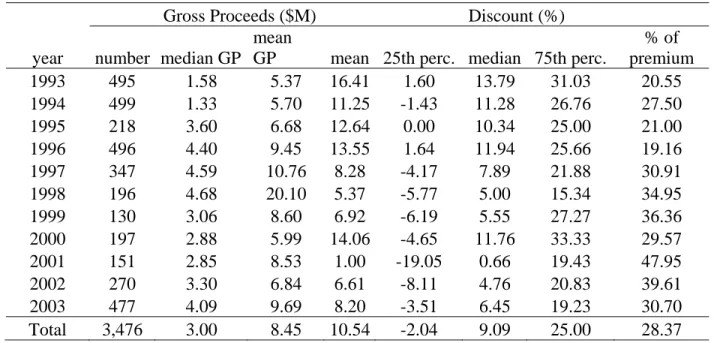
(33) Table 6 Annual distributions of private placement discounts in Canada, 1993-2003. year 1993 1994 1995 1996 1997 1998 1999 2000 2001 2002 2003 Total. Gross Proceeds ($M) mean number median GP GP 495 1.58 5.37 499 1.33 5.70 218 3.60 6.68 496 4.40 9.45 347 4.59 10.76 196 4.68 20.10 130 3.06 8.60 197 2.88 5.99 151 2.85 8.53 270 3.30 6.84 477 4.09 9.69 3,476 3.00 8.45. Discount (%) mean 25th perc. median 75th perc. 16.41 1.60 13.79 31.03 11.25 -1.43 11.28 26.76 12.64 0.00 10.34 25.00 13.55 1.64 11.94 25.66 8.28 -4.17 7.89 21.88 5.37 -5.77 5.00 15.34 6.92 -6.19 5.55 27.27 14.06 -4.65 11.76 33.33 1.00 -19.05 0.66 19.43 6.61 -8.11 4.76 20.83 8.20 -3.51 6.45 19.23 10.54 -2.04 9.09 25.00. % of premium 20.55 27.50 21.00 19.16 30.91 34.95 36.36 29.57 47.95 39.61 30.70 28.37. 30.
(34) Figure 4 Distribution of discount of 3,476 private placements, 1993-2003. We estimate the discount as follows: Disci= (P10i – POfferi) / P10i, with P10i the market price 10 trading days after the announcement, and POfferi the offer price. proportion of placements (%). 30 25 20 15 10 5 0 <=-0,30. [-0,30;0]. [0;0,10]. [0,10;0,20] [0,20;0,50]. >0,50. ranges of discount. .. 31.
(35) REFERENCES Anderson, Hamish D. 2006. "Discounted Private Placements in New Zealand: Exploitation or Fair Compensation?" Review of Pacific Basin Financial Markets and Policies 9:4, 533548. Anderson, Hamish D. and Lawrence C. Rose. 2007. "Firm Quality and the Placement Price of Private Equity." Available at SSRN: http://ssrn.com/abstract=968249. Bali, Turan, Nusret Cakicy and Robert Whitelaw. 2008. "Maxing Out: Stocks as Lotteries and the Cross-Section of Expected Returns." Working Paper, Available on SSRN. Full Text: http://ssrn.com/abstract=1262416 Barclay, Michael J., Clifford G. Holderness and Dennis P. Sheehan. 2007. "Private Placements and Managerial Entrenchment." Journal of Corporate Finance 13:4, 461-484. Brophy, David J., Paige P. Ouimet and Clemens Sialm. 2005. "PIPE Dreams? The Performance of Companies Issuing Equity Privately." NBER Working Paper No. W11011. http://ssrn.com/abstract=641065 Brown, Philip, Gerry Gallery and Olivia Goei. 2006. "Does Market Misvaluation Help Explain Share Market Long-run Underperformance Following a Seasoned Equity Issue?" Accounting and Finance 46:2, 191-219. Carpentier, Cécile and Jean-Marc Suret. 2009. The Canadian Public Venture Capital Market. Companion to Venture Capital. D. Cumming Ed, Wiley, Forthcoming. . Carpentier, Cécile, Jean-François L'Her and Jean-Marc Suret. 2009. "Stock Exchange Markets for New Ventures." Forthcoming in Journal of Business Venturing. Carpentier, Cécile, Jean-François L’Her and Jean-Marc Suret. 2008. "Does Securities Regulation Constrain Small Business Finance? An Empirical Analysis." Small Business Economics 31:4, 363-377. Chaplinsky, Susan J. and David Haushalter. 2006. "Financing Under Extreme Uncertainty: Contract Terms and Returns to Private Investments in Public Equity." Working Paper, Viginia University. http://ssrn.com/abstract=907676 Dai, Na. 2007. "Does investor identity matter? An empirical examination of investments by venture capital funds and hedge funds in PIPEs." Journal of Corporate Finance 13, 538563. Dresner, S. and K. Kim. 2003. Pipe's: A Guide to Private Investment in Public Equity, Blomberg Press. Eckbo, Espen, Ronald W. Masulis and Oyvind Norli. 2000. "Seasoned Public Offerings: Resolution of the 'New issues puzzle'." Journal of Financial Economics 56:2, 251-291. Fama, Eugene F. and Kenneth R. French. 1993. "Common Risk Factors in the Returns on Stocks and Bonds." Journal of Financial Economics 33:1, 3-56. Faruqui, Umar, Wulong Gu, Mustapha Kaci, Mireille Laroche and Jean-Pierre Maynard. 2003. "Differences in Productivity Growth: Canadian-U.S. Business Sectors, 1987-2000." Monthly Labor Review 126:4, 16-29. Gombola, M., F. Y. Liu and D. W. Chou. 2006. "Distress Risk and Stock Returns Following Private Placements of Equity." Eastern Finance Association, New Orleans, . Gombola, Michael J., Hei Wai Lee and Feng-Ying Liu. 1999. "Further Evidence on Insider Selling Prior to Seasoned Equity Offering Announcements: The Role of Growth Opportunities." Journal of Business Finance & Accounting 26:5/6, 621-650.. 32.
(36) Hauser, Shmuel, Elli Kraizberg and Ruth Dahan. 2003. "Price Behavior and Insider Trading Around Seasoned Equity Offerings: the Case of Majority-owned Firms." Journal of Corporate Finance 9:2, 183-199. Hertzel, Michael, Michael Lemmon, James S. Link and Lynn Rees. 2002. "Long-Run Performance Following Private Placements of Equity." The Journal of Finance 57:6, 2595-617. Kim, Kurt. 2002. "PIPEs Marketplaces: A Guided Tour." from http://www.privateraise.com/downloads/PIPEs%20Marketplace%20%20A%20Guided%20Tour.pdf. Krishnamurthy, Srinivasan, Paul Spindt, Venkat Subramaniam and Tracie Woidtke. 2004. "Does Investor Identity Matter in Equity Issues? Evidence from Private Placements." Journal of Financial Intermediation, In press. Krishnamurthy, Srinivasan, Paul Spindt, Venkat Subramaniam and Tracie Woidtke. 2005. "Does Investor Identity Matter in Equity Issues? Evidence from Private Placements." Journal of Financial Intermediation 14:2, 210-238. Kumar, A. 2007. "Who Gambles in the Stock Market." AFA 2006 Boston Meetings Paper Available at SSRN: http://ssrn.com/abstract=686022. Marciukaityte, Dalia, Samuel H. Szewczyk and Raj Varma. 2005. "Investor Overoptimism and Private Equity Placements." Journal of Financial Research 28 4, 591-605. Maynes, Elizabeth and Ari Pandes. 2008. "Private Placements and Liquidity." http://ssrn.com/paper=1106668 Ontario Securities Commission. 1996. Task Force on Small Business Financing – Final Report. Corporate Relations Branch. Ontario Securities Commission. Toronto: 120 p. Wu, YiLin. 2004. "The Choice of Equity-Selling Mechanisms." Journal of Financial Economics 74, 93-119.. 33.
(37)
Figure

+7
![Figure 2 Evolution of the Median Relative Trading Volume of Private Issuers. We estimate the relative monthly trading volume for each of the private issuers, for the [-12; +24] month windows around the announcement, which occurs in the first day of month](https://thumb-eu.123doks.com/thumbv2/123doknet/7720337.248315/31.918.114.788.264.742/evolution-relative-trading-private-issuers-estimate-relative-announcement.webp)
Documents relatifs
The takeover offer is an altemative mechanism that is widely used by private equity bidders in order to complete public-to-private deals in Europe. In a private equity transaction,
So, positional preferences on public good contribution might lead to a decrease in social welfare because of an overall negative effect on positional externalities
So, positional preferences on public good contribution might lead to a decrease in social welfare because of an overall negative effect on positional externalities when
For finitely generated group that are linear over a field, a polynomial upper bound for these functions is established in [BM], and in the case of higher rank arithmetic groups,
The analysis presented below describes the regulatory framework for PPPs in LAC, presents a comparative analysis of the role of the main public stakeholder in
joli (jolie), pretty mauvais (mauvaise), bad nouveau (nouvelle), new petit (petite), little vieux (vieille), old.. ordinal
Second, we provide empirical evidence that the choice of an appropriate family of models is often more important—and sometimes much more important, especially when the size of
We introduce a family of DG methods for (1.1)–(1.3) based on the coupling of a DG approximation to the Vlasov equation (transport equation) with several mixed finite element methods
