hanced LNAPL recovery in layered soils
M´elanie Longpr´e-Girard, Richard Martel, Thomas Robert, Ren´e Lefeb-vre, Jean-Marc Lauzon
PII: S0169-7722(16)30182-6
DOI: doi:10.1016/j.jconhyd.2016.09.001
Reference: CONHYD 3243
To appear in: Journal of Contaminant Hydrology
Received date: 17 March 2016 Revised date: 8 August 2016 Accepted date: 1 September 2016
Please cite this article as: Longpr´e-Girard, M´elanie, Martel, Richard, Robert, Thomas, Lefebvre, Ren´e, Lauzon, Jean-Marc, 2D sandbox experiments of surfactant foams for mobility control and enhanced LNAPL recovery in layered soils, Journal of Contaminant
Hydrology (2016), doi: 10.1016/j.jconhyd.2016.09.001
This is a PDF file of an unedited manuscript that has been accepted for publication. As a service to our customers we are providing this early version of the manuscript. The manuscript will undergo copyediting, typesetting, and review of the resulting proof before it is published in its final form. Please note that during the production process errors may be discovered which could affect the content, and all legal disclaimers that apply to the journal pertain.
ACCEPTED MANUSCRIPT
1
2D sandbox experiments of surfactant foams for mobility control and
enhanced LNAPL recovery in layered soils
Mélanie Longpré-Girarda, Richard Martela*, Thomas Roberta, René Lefebvrea, Jean-Marc Lauzonb
a
Centre Eau Terre Environnement, Institut national de la recherche scientifique, 490 rue de la Couronne, Québec, Québec, Canada, G1K 9A9
*corresponding author: [email protected] b
TechnoRem Inc., 4701 Rue Louis B Mayer, Laval, Québec, Canada, H7P 6G5
Keywords : sandbox, foam, surfactant, p-xylene, LNAPL recovery, mobility control
Abstract
The ability of surfactant foam to enhance mobility control and LNAPL recovery in a heterogeneous porous media was investigated through sandbox experiments with p-xylene used as LNAPL. A layered heterogeneous porous media was represented in a 2D sandbox filled with two layers of coarse and medium silica sand. Based on previous tests, the surfactant solution used was Ammonyx Lo at a concentration of 0.1% (w/w). The sandbox experimental program included tracer tests done under both uncontaminated and contaminated conditions, foam injection under uncontaminated conditions and surfactant solution and foam injection under contaminated conditions. Tracer tests indicated that the permeability contrast between sand layers was increased by LNAPL contamination. Foam injection under uncontaminated conditions presented a S-shaped front that indicated a better mobility control than the piston-shaped front obtained during tracer tests. During foam injection, complete sweep of the sandbox was achieved with 1.8 pore volume (PV) compared to 2.8 PV during tracer injection, thus indicating better mobility control with foam. Pre-flush of the contaminated sandbox with surfactant solution initiated p-xylene mobilization but no free phase was recovered at the effluent. A negligible p-xylene residual saturation was reached following foam injection in the contaminated sandbox. However, mass balance indicated a total recovery of only 48% of the initial p-xylene, thus indicating an underestimation of the recovery by volatilization. Recovery by volatilization was corrected, which gave the following proportions of LNAPL recovery mechanisms: 19% by mobilization, 16% by dissolution and 65% by volatilization. Results show the potential efficiency of foam remediation of LNAPL source zones in heterogeneous porous
ACCEPTED MANUSCRIPT
2
media. Still, further developments are needed prior to field scale application, which could benefit from in situ foam production that would simplify on-site operations.
1.
Introduction
In a context of enhanced NAPL recovery in shallow saturated soils, the use of conventional in situ methods such as dewatering and venting or bioslurping may not be suitable depending on site-specific characteristics. In the case of a volatile and viscous contaminant, non-conventional methods such as surfactant solution injection may constitute a better option. A major challenge in enhanced NAPL recovery in contaminated soil with surfactant solutions is to uniformly sweep the contaminated zone and contact every pocket of contaminated soil present within the targeted zone. To avoid these problems, water-soluble polymers can be coupled with the surfactant solution in order to improve mobility (Martel et al., 1998, 2004; Robert et al., 2006). Polymers can enhance mobility control through their shear-thinning behavior and by increasing the washing solution viscosity (Lake, 1989). First, an increase in viscosity slows down the movement of injected fluids in the higher permeability zones. In parallel, the increase of shear stress within lower permeability layers causes a decrease in viscosity, promoting the flow of the shear-thinning polymer solutions and foams. The result is a more stable advancing front in heterogeneous media. Polymer solutions behavior in porous media was extensively studied for their mobility control properties (e.g. Martel. 1995; Martel et al., 1998; Martel et al., 2004; Silva et al., 2012; Robert et al., 2006). However, there are documented issues associated with the use of polymers: preparation of polymer solutions, reaction of polymers with groundwater or washing solution chemicals, pore plugging (Robert et al., 2006). In fact, their use in the environmental industry is not widespread.
Foams can replace polymers as they also enhance mobility control with their shear-thinning properties and high viscosity, plus they present several advantages over polymers. Foam injection enhances mobility control in two distinct ways (Falls et al., 1989): by decreasing water relative permeability with the presence of air and by increasing the apparent viscosity. Hirasaki and Lawson (1985) studied the behavior of foam bubbles in smooth capillaries and found that foam increases viscosity because of the shear force between the gas/liquid interface and the pore walls, which slows the advance of the bubble. Moreover, Falls et al. (1989) found that viscosity was not only enhanced by shear stress but was also increased by the force required to push lamellae through constricted pore throats when flowing through porous media. Moreover,
ACCEPTED MANUSCRIPT
3
foams can enhance mobility control of the surfactant solution by lowering the relative permeability of the coarse layers due to the presence of air (Hirasaki et al., 1989; Falls et al., 1989). Surfactant and polymers being expensive, another advantage of foams is that unit volumes of foam include high proportions of air (Rothmel, 1998; Zhong et al, 2010), which can lower the amount of surfactant required to remediate a site (Roy et al 1995a and 1995b). Furthermore, a suitable foam can be obtained with very low concentrations of surfactant (Géraud et al., 2016). Based on these advantages, the use of foam appears promising for the remediation of LNAPL contaminated soils (Szafranski et al., 1998).
This study was done in the context of the application of foam to remediate shallow LNAPL-contaminated soils by p-xylene. A previous study had allowed the selection of a suitable surfactant for foam production and had shown the conditions needed for the production and injection of foam (Longpré-Girard, 2015). The general objective of the present study was to better understand the processes related to foam remediation, specifically the flow of foam in layered soils with contrasts in hydraulic properties. The steps followed in the study were: 1) the design and the evaluation of the flow properties of a 2D sandbox filled with two sands with different grain sizes; 2) the testing of foam injection in this sandbox to evaluate foam behavior in layered porous media; and 3) the contamination of the sandbox with p-xylene, followed by surfactant and foam injection to assess the remediation efficiency and identify the processes involved (displacement, dissolution, volatilization).
All tests used homogeneous clean silica sand, distilled water and a single surfactant solution (no mixtures). Pure p-xylene dyed with Oil-Red-O for visual observation was used in the contaminated experiments. Since this work was carried out in the context of a field application, practical considerations imposed the following constraints on the approach: 1) use a low surfactant concentration to lower costs; 2) use a low injection pressure to prevent soil heaving; and 3) aim for the creation of a stable foam front to avoid fingering and loss of LNAPL during LNAPL recovery.
2.
Theory
Following a spill, NAPL is trapped in aquifer at variable saturation because of capillary, buoyancy and viscous forces (Van Geel and Sykes, 1997). Three recovery mechanisms can take place during foam treatment: mobilization, dissolution and volatilization. In the context of foam injection for the treatment of LNAPL-contaminated soil, the focus should be on
ACCEPTED MANUSCRIPT
4
mobilization, as it represents the highest ratio of LNAPL mass recovered per pore volume of foam injected in the soil. Dissolution and volatilization are also known to take place, but in this research no emphasis was put into optimizing these processes.
NAPL can be mobilized through the increase of the capillary number (Nc), which is the ratio of
viscous over capillary forces, defined as follows:
Equation 1
Where, q is fluid flux (m/s), µ is fluid viscosity (Pa·s), σ is interfacial tension (mN/m) and θ is the contact angle (°) representing the effect of wettability. Nc values between 1x10⁻⁵ and 5x10⁻⁵ were
considered by Pennell et al. (1996) as thresholds for the initiation of tetrachloroethylene (PCE) mobilization in contaminated silica sand columns and a value of 1x10⁻³ was needed to obtain complete displacement. The increase in viscous forces is achieved by increasing the injected fluid viscosity and its velocity in the porous media whereas the decrease in capillary forces is possible through interfacial tension reduction by surfactants. Therefore, maximizing Nc
enhances the possibilities of contaminant displacement by foam. In this regard, each step of this study was carried out in order to maximize Nc. Replacing water by foam in porous media favors
NAPL mobilization because it increases viscosity and decreases interfacial tension by at least one order of magnitude. Interfacial tensions and foamability were measured for several surfactants and the best candidate with the lowest interfacial tension with the contaminant and the best foamability was selected previously (Longpré-Girard, 2015). The best surfactant found was used for these 2D sandbox tests in this paper.
The solubility of NAPL in the liquid phase of foam is increased by surfactant with a concentration above its critical micelle concentration (CMC). The relationship between the interfacial tension and the amount of NAPL solubilized is given by the Chun-Huh equation (Huh, 1979; Pope and Bavière, 1991):
or Equation 2
where, c is typically equal to 0.3, and D is the dissolution ratio relating the volume of NAPL solubilized in the micellar phase to the volume of surfactant.
Volatilization of the NAPL by foam injection is occurring because foam is a mixture of liquid and air. P-xylene being volatile, volatilization may enhance its recovery in a significant way. In this
ACCEPTED MANUSCRIPT
5
study, as p-xylene is the only compound dissolved in water, its volatilization can be evaluated considering its vapor pressure (Pv) and the Ideal Gas Law, which is defined as follows:
Equation 3
Where V is volume (m³), n is the number of moles, R is the ideal gas constant (8.31 J/Kmol) and T is temperature (°K).
3.
Methodology
3.1 2D sandbox experimental setup
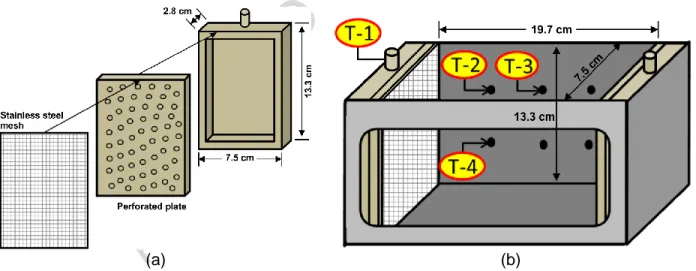
The sandbox design was based on Martel et al. (1998). Glass, stainless steel, Teflon and nylon were selected for the sandbox construction to avoid interaction with p-xylene. The number of moving parts and potential leaking joints was minimized in order to reduce possible leakage of injected fluids under high pressure. Also, thick walls were used to reduce possibilities of deformation. The sandbox consists of a stainless steel box (1.5 cm thick walls) opened on top with an internal volume of 2.5 L and a tempered glass window (1.5 cm thick) on the front side that allows visualization of all experiments (Figure 1). Pictures of every test were taken with a digital camera (Nikon, Coolpix P510), which allowed the analysis of test results. The sandbox is closed on top by a 2.1 cm thick nylon plate overlaid with a 0.65 cm stainless steel plate to minimize deformation.
A distribution chamber (Figure 2(a)), allowing fluid injection or recovery, was placed at each end of the sandbox (Figure 2 (b)). Both chambers were made of nylon: a perforated plate was placed over a reservoir of 10 cm by 5 cm and 1 cm deep with a threaded opening on top in which a quick-connect connector was screwed. A stainless steel screen with 250 μm openings was placed over each chamber to prevent the loss of fines. Clay (crafting quality, Vallauris) was placed around both chambers to seal gaps between the sides of distribution chambers and the sandbox walls. Threaded holes were made through the sandbox back at equal distances in order to connect pressure transducers (Figure 1 (b)). Stainless steel mesh was placed over each hole in order to prevent sand loss. Four pressure transducers were disposed throughout the system to measure changes in pressure as shown in Figure 2 (b); one at the sandbox inlet (T-1), one at the first two pressure ports of the upper layer (T-2 and T-3) and one in the first pressure port of the lower layer (T-4). The pressure transducers (GP-50 model 311,
ACCEPTED MANUSCRIPT
6
InterTechnology) were linked to electronic data loggers (ES-120, Dickson) and their electric signal was then converted to pressure values with DicksonWare 9.0.8 software.
(a) (b)
Figure 1 – (a) Photo showing a general view of the sandbox setup. (b) Schematized back view of the empty stainless steel sandbox with the glass window in background.
(a) (b)
Figure 2 – (a) Schematized nylon distribution chamber details; distribution chamber closed by a perforated plate overlaid by a stainless steel mesh screen. (b) Schematized empty sandbox with distribution chambers shown. T-1 through T-4 refer to pressure transducers.
A small gap of 2.1 cm at the bottom of each distribution chamber was not covered by the perforated plate. Therefore, a nylon plate with a 2 cm thickness was placed on the sandbox bottom, which prevented any fluid flow in this part of the sandbox. Clay was disposed on this plate and scarified to minimize preferential flow paths between the plate and the layer of sand overlaying it. The same setup was installed at the upper end of the sandbox for the same reasons but the gap was filled with a 0.72 cm thick nylon plate with clay underneath making 10.5 cm for the total thickness of sand. That way, no flow dead zone could form as all the cross
ACCEPTED MANUSCRIPT
7
section of sand was in hydraulic contact with both distribution chambers at the entry and exit of the sandbox.
The glass window in front of the sandbox did not extend through the entire thickness of the sand. The two layers of sand with different grain sizes were placed in the sandbox so that their interface appeared in the center of the glass window. The coarser sand layer on top had a slightly greater thickness than the finer sand layer at the bottom due to the presence of the bottom nylon plate.
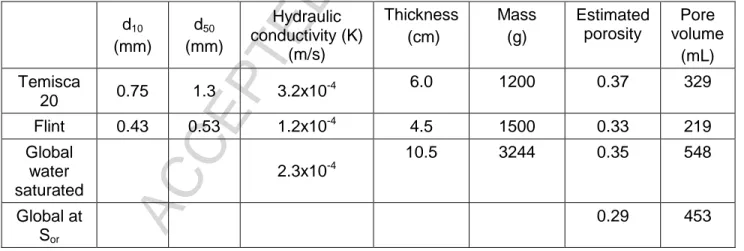
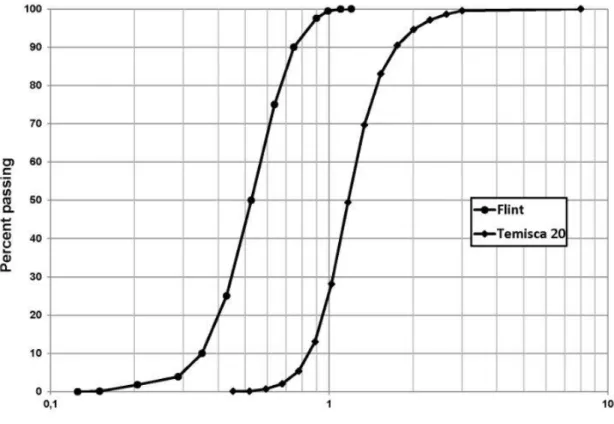
Silica sand (99.9% quartz) was used for all experiments in order to avoid interactions of surfactants and LNAPL with fines (clay and silt), organic matter or reactive minerals. Two grain size distributions were used (Table 1 and Figure 3); Temisca 20 (Opta Minerals Inc.), a coarse sand, and Flint (Bell & Mackenzie, Hamilton), a medium sand. A hydraulic conductivity ratio of 2.7 between both sands can be evaluated with the sand properties indicated in Table 1.
Table 1 – Properties of silica sands used for sandbox tests, d10 and d50 refer to grain sizes larger than 10% and 50%, respectively, of sand mass, total pore volume in the sandbox based on measurements made during sandbox filling.
d10 (mm) d50 (mm) Hydraulic conductivity (K) (m/s) Thickness (cm) Mass (g) Estimated porosity Pore volume (mL) Temisca 20 0.75 1.3 3.2x10 -4 6.0 1200 0.37 329 Flint 0.43 0.53 1.2x10⁻⁴ 4.5 1500 0.33 219 Global water saturated 2.3x10⁻⁴ 10.5 3244 0.35 548 Global at Sor 0.29 453
ACCEPTED MANUSCRIPT
8
Figure 3 – Grain size distribution curves of Temisca 20 coarse sand and Flint medium sand The horizontal effective hydraulic conductivity (Ke) of 2.3 x 10⁻⁴ m/s of the system (Table 1) was
calculated by the arithmetic mean of each layer conductivity (Ki) with its thickness (hi) (Freeze
and Cherry, 1979):
Equation 4
The filling and compaction of the sandbox were done as described by Martel and Gélinas (1996). The compaction of every 1 cm layer was made by dropping a 293 g weight from a height of 19 cm to attain a global dry density of 1.7 g/cm³ to prevent channeling (Ripple et al., 1973). Each layer was scarified after its compaction to minimize preferential flow between each layer. A total pore volume of 543 mL, corresponding to a global porosity (n) of 0.35 was measured by weighing the sandbox dry and then saturated with water. Also, pore volume was calculated using sand volumes and weights measured during the sandbox filling. With these measurements and knowing that silica has a density of 2,650 kg/m³, the volume of solids (VS)
ACCEPTED MANUSCRIPT
9
mL calculated with this method is consistent with the global pore volume of 543 mL measured by weighing the sandbox dry and saturated (Table 1).
3.2 Water and p-xylene saturation
The sandbox was sealed and purged with pressurized CO2. Then, water saturation was
established by placing the sandbox on its short side and filling it from the bottom up with degased deionized water. Replicate groundwater was used by adding 0.4 mg/L of CaCl2 to pure
water as presented in Sylva et al. (2012).
Sand contamination was done with a downward injection of p-xylene dyed with 0.9 g/L of Oil-Red-O (Sigma-Aldrich) in the saturated sandbox while placed on its short side.
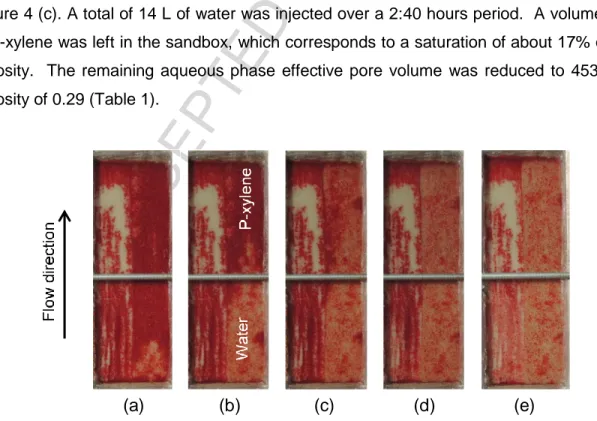
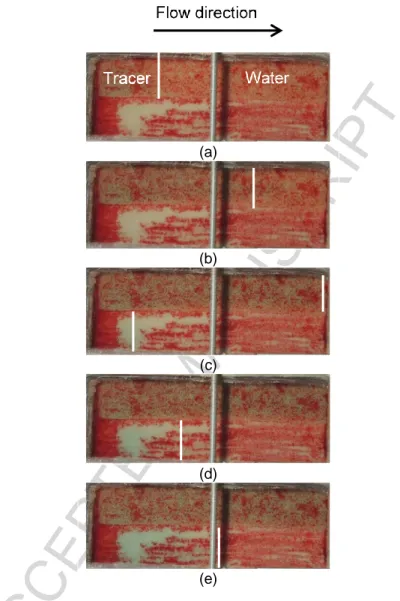
After contamination, the sandbox still placed on its short side was rinsed from bottom up with replicate groundwater to bring it to residual oil saturation (Sor). Water breakthrough occurred at 3
minutes 28 seconds, which is the time when the Temisca 20 layer was fully swept as shown in Figure 4 (c). A total of 14 L of water was injected over a 2:40 hours period. A volume of 90 mL of p-xylene was left in the sandbox, which corresponds to a saturation of about 17% of the total porosity. The remaining aqueous phase effective pore volume was reduced to 453 mL, for a porosity of 0.29 (Table 1).
Figure 4 – Photos of p-xylene saturated sandbox placed on its short side and rinsed from bottom to top with water to bring it to residual oil saturation, after (a) 9 mL, (b) 20 mL, (c) 70 mL, (d) 150 mL and (e) 14 L of water injection.
ACCEPTED MANUSCRIPT
10
3.3 Tracer tests
Tracer tests were used to illustrate the permeability contrast and to determine the effective ratio of hydraulic conductivities between the two sand layers in the sandbox. These tests were done in the uncontaminated and contaminated sandbox in order to evaluate the impact of residual LNAPL saturation on these parameters. Tracer solution was injected in the uncontaminated sandbox at a constant flow rate of 14.0 mL/min with a peristaltic pump (model 7553-70, Cole Parmer). Two tracers were dissolved in the same solution; amaranth (Sigma-Aldrich) as a visual tracer and potassium bromide (Laboratoire Mat) as a conductive tracer. Both tracers do not adsorb on silica sand and no interactions were observed between them. Samples of 40 mL were taken at the outlet for all test duration. Bromide ion concentration was measured with a bromide electrode (Orion model, Thermo Scientific).
For the tracer test in the contaminated sandbox, two tracers were used; bromide and a blue food coloring. Amaranth could not be used because of the already red coloring of p-xylene with Oil-Red-O making the visual tracking of amaranth impossible. Food coloring was used only for the purpose of visually tracking tracer progression during the experiment because it is adsorbed on silica sand. Therefore, there is a delay between food coloring progression and bromide progression through the sandbox. The injection rate of the tracer solution was 13.8 mL/min.
3.4 Foam injection
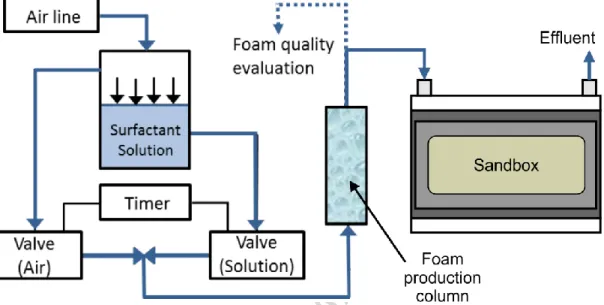
The foam injection system used for sandbox experiments was the same as the one developed and applied for previous sand column tests (Longpré-Girard, 2015). A stainless steel tank (6.6 L, 18 cm diameter, 26 cm height, 5 mm thick) was filled with surfactant solution and connected to the pressurized air line controlled by a pressure regulating valve (0.64 cm diameter, 300 psi, Parker) (Figure 5). Then, both air and surfactant solution lines were connected to two valves (0.5 cm diameter, shutoff valve 104R, Asco) that opened alternatively at fixed time steps. This setup allowed air and surfactant solution injection at the same pressure. Five seconds of surfactant solution injection alternating with ten seconds of air injection were selected for foam production to create a stable injection pressure and to avoid heating of the electric valves with short alternate openings. After flowing through the valves, air and surfactant solution were mixed in a „‟T‟‟ shaped tube before going through a foam production column, which is an acrylic column filled with 2 mm diameter glass beads with 250 μm opening stainless steel screens between each 2.5 cm glass bead layers. This column allowed the purging of foam until it was
ACCEPTED MANUSCRIPT
11
stable and the measurement of its quality before it entered the sandbox. Foam was flowed through the sandbox and filmed at a high resolution with a digital camera (Nikon, Coolpix P510).
Figure 5 - Experimental setup for foam production and injection into the sandbox. Sampling and analytical methods
After the tracer test, a foam test was carried out. The surfactant used was Ammonyx Lo from Stepan at a concentration of 0.1% on a weight basis (w/w) based on the work of Longpré-Girard (2015). The foam production column was purged with foam until foam quality was stable then the foam production column outlet was connected to the sandbox inlet. The sandbox was saturated with water prior to foam injection. Injection pressure was increased throughout the experiment in order to maintain an advancing foam front.
LNAPL recovery in the contaminated sandbox was done in two steps: 1) injection of liquid surfactant solution and 2) foam injection. Previous column tests indicated that a pre-flush with surfactant solution having the same concentration as foam prior to foam injection facilitated the formation of a clear stable foam front (Longpré-Girard, 2015). For this reason, 1 L of liquid surfactant was injected in the contaminated sandbox prior to foam treatment. A peristaltic pump was used for the injection of surfactant solution at a constant flow rate of 14.0 mL/min. This pre-flush is comparable to a liquid surfactant treatment, so it was interpreted as such. After liquid surfactant injection, foam was injected in the contaminated sandbox. Injection pressure was increased throughout the experiment in order to keep the foam front advancing.
Liquid effluents were recovered. Free LNAPL recovery was monitored through time, and discrete aqueous phase samples were taken periodically to estimate dissolved p-xylene concentrations.
ACCEPTED MANUSCRIPT
12
Air was also sampled at the sandbox outlet to assess volatilized organic compounds (VOC) concentrations. For the purpose of air sampling, the output tubing was placed in the opening of a Mason jar without touching the liquid that was accumulating at the bottom of the jar. A parafilm paper was then placed over the jar opening in order to seal it as best as possible. Air samples were taken by piercing a small hole in the parafilm with a needle and sampling the air within the headspace over the liquid. VOC concentration was measured with a Portable gas chromatograph (GC Voyager, Photovac). Air flow rate was estimated by the travel time of foam lamellae between two marks on the sandbox outlet transparent tubing. Knowing the volume contained in the tubing between these two marks, air flow rate could be estimated.
Because of the long-term nature of the test, overnight pauses had to be made during foam injection for laboratory security purposes. At the end of each day, the inlet of the sandbox was closed to stop foam injection and the outlet was kept open to release some of the pressure. Then, the outlet was also shut to prevent leakage. When foam injection was restarted at the beginning of each day, the same injection pressure was used as when the test was stopped. All tests were carried out in the same sandbox model. Therefore, the sandbox was rinsed using water after the tracer test, and it was rinsed, dryed and resaturated after each foam tests using successively water, air, CO2 and replicate groundwater.
The contaminated test was the last test carried out before opening the model for soil sampling. Both layers of sand were sampled in three different regions (based on sand color): 1) clean zones, 2) slightly contaminated zones and 3) strongly contaminated zones. In each zone, at least one grab sample and one composite sample made up of 16 subsamples of 5 g were taken. Each sample was put in 10 mL of methanol to dissolve p-xylene and analyzed with gas chromatography mass spectrography (GC/MS). Method EPA 8260B was used with a PerkinElmer Turbomatrix Headspace 40 trap connected by an inert heated transfer line to a PerkinElmer Clarus 500 GC-MS. Analyses were done using a DB-5MS UI 30 m x 0.25-mm i.d. and a 0.25-m film thickness. Results were converted in mg of contaminant per kg of dry soil. Following soil sampling, each sampled zone was retrieved individually from the model and dried. Combining those dry weight measurements with the measured p-xylene concentrations for each sample zone, it was possible to quantify the total mass of p-xylene remaining in the sandbox.
ACCEPTED MANUSCRIPT
13
4.
Results and discussion
4.1 Tracer tests
In the uncontaminated sandbox, the flow of the tracer solution in each of the two sand layers exhibited a piston-like shape and a significant delay was observed between the two fronts (Figure 6). Results showed a slight delay between the total breakthrough times of amaranth (115 minutes) and bromide (123 minutes), most likely resulting from minor amaranth sorption to the sand particles. However, results obtained from the visual tracer tests were still considered useful since the test apparatus was designed for visual assessment of the processes. The visual tracer swept the coarser Temisca 20 (T20) sand first, where complete sweep was obtained after the injection of 0.79 PV. The medium Flint sand was completely swept after the injection of 2.75 PV. The result of such delay is an increase in the total volume of solution that is needs to be injected in the sandbox to completely sweep both sands.
Another tracer test was carried out in the presence of a p-xylene residual saturation of 0.17, and showed a similar behavior (Figure 7), with the Flint sand layer fully swept after the injection of 2.86 PV.
ACCEPTED MANUSCRIPT
14
Figure 6 – Photos of tracer test in the uncontaminated sandbox, white lines indicate the position of the tracer front after (a) 0.5 PV, (b) 1 PV, (c) 1.5 PV, (d) 2 PV and (e) 2.75 PV (PV is based on the total pore volume in the entire sandbox). (a) (b) (c) (d) (e)
ACCEPTED MANUSCRIPT
15
Figure 7 – Photos of the tracer test carried out in the contaminated sandbox, the white lines indicate the position of the tracer front after (a) 0.5 PV, (b) 1 PV, (c) 1.5 PV, (d) 2 PV and (e) 2.9 PV (1PV is 453 mL).
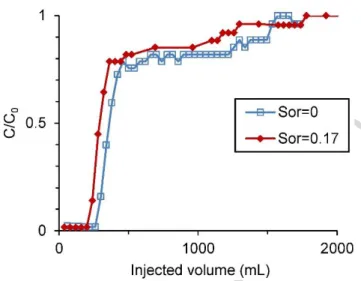
The impact of Sor on the permeability contrast and resulting sweep delay by the bromide tracer
solutions is illustrated in Figure 8. Both curves exhibit a bimodal shape caused by the permeability contrast between the coarse and medium sand layers. The shape of these curves prevents the use of standard tracer test analytical solutions, such as Ogata-Banks (Ogata, 1970), for their interpretation. The first sharp increase in bromide concentration observed on both curves is attributed to the bromide tracer breakthrough in the coarse T20 sand. Once this layer was fully swept, a plateau is observed on both curves, where bromide concentration flowing from the coarse sand layer is diluted by the clear water exiting from the medium sand layer. Once the tracer is breaking through the medium sand layer, the tracer concentration increases again to reach the injection concentration.
(a)
(b)
(c)
(d)
ACCEPTED MANUSCRIPT
16
Figure 8 – Uncontaminated and contaminated sandbox bromide tracer breakthrough curves.
The permeability ratio between the two sand layers was estimated from the tracer breakthrough curves. In the uncontaminated sandbox, a stabilized tracer mass flux exiting the Temisca sand of 29.12 mg/min was calculated by multiplying the first plateau concentration (204.5 mg/L) by the total injection flow rate (14 mL/min). By dividing this mass flux by the injection concentration (254 mg/L), we obtain the flow rate inside the Temisca sand (11.5 mL/min). The flow rate in the Flint sand (2.5 mL/min) was then calculated by subtracting this Temisca sand flow rate to the total injection flow rate. Using Darcy‟s Law, a pressure gradient of 0.15 and the respective sectional areas and flow rates of each sand layer, it was then possible to calculate the permeability ratio between the two sand layers (Table 2). The same approach was used to evaluate the permeability ratio between the two sand layers in the contaminated sandbox. In that case, the respective flow rates in the Temisca sand and Flint sand was 11.7 mL/min and 2.0 mL/min.
The pressure gradient monitored during tracer injection in the contaminated sandbox allowed the estimation of a global effective permeability of 1.97x10⁻¹¹ m² for the whole sandbox (Darcy‟s Law).
Table 2 – Effective permeability and permeability ratio between sand layers in contaminated and uncontaminated sandboxes Theoretical Uncontaminated sandbox Tracer at Sor=0 Uncontaminated sandbox Tracer at Sor=0.17 Contaminated sandbox Effective Permeability (m²) 2.35x10-11 NM* 1.97x10-11
ACCEPTED MANUSCRIPT
17 Permeability Ratio
between Sand Layers
3.3 3.0 4.4
* NM: Not measured.
Permeability contrasts calculated with the theoretical values and with tracer test measurements in the uncontaminated sandbox are consistent with values of 3.3 and 3.0 respectively. Considering the larger permeability contrast between the two sand layers after p-xylene contamination, creating a favorable mobility control with foam injection becomes even more important in order to fully sweep the entire sandbox.
4.2 Foam test in uncontaminated sandbox
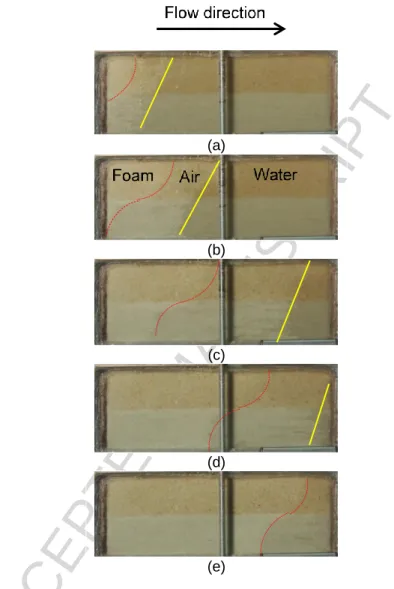
Compared to the tracer test with water (Figure 6), Figure 9 indicates that foam injection created a more uniform front advancing at the same velocity in both coarse and medium sand layers but at a slower velocity in both layers than in the tracer test experiment with water Also, a total of 1.80 PV of liquid surfactant was required during the foam flood to fully sweep both sand layers (compared with 2.86 PV required during the tracer test). These observations represent major improvements in sweep efficiency when compared with water and tracer injection.
Two drawback occurred during foam flooding: (1) Injection pressure had to be constantly increased during the test from 150 cm H2O to 525 cm H2O (14.7 kPa to 51.5 kPa) in order to
keep the foam front advancing; and (2) foam collapse was observed ahead of the foam stable front due to the creation of a preferential air flow path most likely located along the upper part of the sandbox. As previously observed during foam injection in column tests (Longpré-Girard, 2015), two foam fronts were observed (Figure 9) a first, uneven foam front with poor sweep efficiency (yellow solid line) followed by a second more stable front with better sweep efficiency (red dotted curve). The first front presented some fingering but advanced at the same velocity in both layers. The second foam front has a clear “S” shape. Air started exiting the sandbox in the early stage of foam injection (2 minutes 50 seconds), thus indicating the presence of a preferential air flow path.
ACCEPTED MANUSCRIPT
18
Figure 9 – Photos of foam injection experiment in uncontaminated sandbox after (a) 1 min, (b) 5 min, (c) 29 min, (d) 59 min and (e) 2 hours 5 min. Yellow and red lines represent the positions of two foam-liquid fronts.
4.3 Surfactant pre-flush
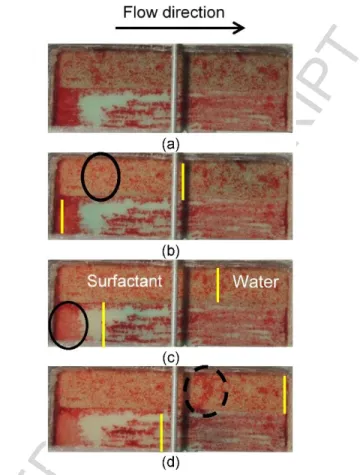
Surfactant pre-flush of the contaminant sandbox is comparable to a 100% liquid surfactant flood. Therefore, a capillary number of 3.4x10⁻⁵ could be estimated with Equation 1. This value falls within the range of critical capillary numbers of 2x10⁻⁵ to 5X10⁻⁵ evaluated by Pennell at al. (1996) at which mobilization of PCE in silica sand was initiated. However, only a negligible mass of p-xylene was recovered during surfactant injection. In Figure 10 (d), the dotted black ellipse highlights a zone of LNAPL moving towards the sandbox upper part, which indicates LNAPL mobilization and a resulting upward movement caused by the density contrast between the LNAPL and surfactant solution. Trapping of p-xylene in the upper part of the sandbox caused by
(a)
(b)
(c)
(d)
(e)
FIGURE 9–PHOTOS OF FOAM INJECTION EXPERIMENT IN UNCONTAMINATED SANDBOX AFTER
(A)1 MIN,(B)5 MIN,(C)29 MIN,(D)59 MIN AND (E)2 HOURS 5 MIN.
(a)
(b)
(c)
(d)
(e)
FIGURE 9–PHOTOS OF FOAM INJECTION EXPERIMENT IN UNCONTAMINATED SANDBOX AFTER
ACCEPTED MANUSCRIPT
19
design problems may explain the negligible recovery of p-xylene free phase during liquid surfactant injection, even though some mobilization occurred.
Figure 10 - Photos of contaminated sandbox pre-flushed with liquid surfactant prior to foam treatment, (a) initially and after (b) 0.55 PV, (c) 1.1 PV and (d) 2.2 PV. (1 PV is 453 mL). Dotted black ellipse shows evidence of LNAPL upward mobilization behind the surfactant fronts (indicated by yellow lines).
The tracer test with a bromide solution was done prior to surfactant injection. Both injections, with and without surfactant, had similar flow rates and both solutions had the same viscosity. The only difference between both tests was the lowering of interfacial tension going from 23.87 mN/m during tracer test to 0.79 mN/m during surfactant injection. The black ellipses on Figure 10 (b) and (c) highlight regions that were partially cleaned by surfactant injection. There is still contamination left, as red coloring is present after the passing of liquid surfactant front, but the faded red color indicates a lowering of p-xylene concentration at these locations.
4.4 Foam injection
Foam injection followed the surfactant pre-flush. Figure 11 gives a general idea of the efficiency of foam treatment of the sandbox contaminated with xylene. The complete removal of
p-ACCEPTED MANUSCRIPT
20
xylene from the regions swept by foam is obvious just by the drastic change in color. Soil samples confirmed this observation, as p-xylene concentrations were below the detection limit of 16.3 mg/kg of dry sand in the swept sand region. This detection limit is below the maximum concentration cirteria of 50 mg/kg for xylenes in soils for commercial and industrial sites in Québec, Canada (MEQ, 1998).
Figure 11 – Photos of foam treatment of contaminated sandbox (a) 34 min (b) 2h 30 min (c) 12 h (d) 26 h (e) 46 h.
A total of 15 L of surfactant solution were required to bring the foam front to the position shown in Figure 11 (e), whereas 1 L was needed in the uncontaminated test to sweep the entire sandbox with foam. This difference may be explained by the foam collapse at the front when in contact with p-xylene (Farajzadeh et al., 2012: Li, 2011), causing the separation of air and surfactant solution. The air rised and caused the air slugs observed at the effluent and the
(a) (b) (c) (d) (e) Foam (a) (b) (c) (d) (e)
FIGURE 9–PHOTOS OF FOAM INJECTION EXPERIMENT IN UNCONTAMINATED SANDBOX AFTER
ACCEPTED MANUSCRIPT
21
surfactant solution flowed ahead of the foam front. This surfactant solution went through successive mixings with p-xylene which caused a phenomena similar to multiple contact miscibility which is used in EOR to generate a miscible displacement of the oil phase. The successive contacts between the surfactant solution and p-xylene could have induced miscibility of p-xylene that accumulated ahead of the foam front (Lake, 1989). The p-xylene bank thus miscibly displaced is indicated by the darkened red coloring shown in Figure 11.
Based on free-phase recovery and concentrations measured in the liquid and gas phases, it was possible to assess the p-xylene mass in the effluent that was mobilized (free phase), dissolved (aqueous phase) or volatilized (gas phase). Figure 12 shows the recovery achieved by each mechanism individually and combined. Volatilization started gradually whereas dissolution was constant throughout the experiment and mobilization was achieved by steps. The mobilization of 3.4 g of p-xylene that occurred at the beginning of treatment was due to mobilization during surfactant injection that was not recovered prior to foam injection. The steps that shape mobilization recovery are the results of the sampling method which consists of filling 1 L containers and transferring them into a 1L Teflon separatory funnel to measure the free-phase that was mobilized in each sample.
P-xylene concentration in air was first measured after 4.4 PV of liquid phase had exited the sandbox. Therefore, an extrapolation of the first results was extended to the period before 4.4 PV. Volatilization attained a plateau at the end of injection because of the lowering of p-xylene concentration in the sandbox.
The recovery curve obtained for dissolution was extrapolated over the entire test duration from four p-xylene concentration measurements measured in four effluent samples (597 to 617 mg/L: mean 610 mg/L). As these concentrations were similar to p-xylene concentrations measured at equilibrium with foam in two samples (575 and 653 mg/L: mean 614 mg/L), indicating that the liquid effluent was at equilibrium with the p-xylene inside the sandbox.
ACCEPTED MANUSCRIPT
22
Figure 12 – P-xylene recovery with each mechanism and combined. PV is 548 mL.
Table 3 gives an overview of the recovery achieved by each mechanism. With 19% of the removal, mobilization was the most efficient mechanism. However, the total mass recovered by all mechanisms only represented 48% of the initial p-xylene mass in the sandbox. This is not consistant with sand samples analysis performed at the end of the test, which indicated a remaining mass of only 0.263 g (0.29% of initial contamination). There is thus a gap of 51% (44 g of p-xylene) of the initial contamination between estimated mass recovery and remaining concentration in the sandbox. Recovery by mobilization and dissolution were evaluated with precise analytical methods having only small uncertainties. However, some technical problems caused a large uncertainty on the mass recovered by volatilization. Air volume could be evaluated only when air velocity in the output tubing was slow enough for the bubbles to be seen. Therefore, when the test was restarted after an overnight stop, for example, air flow rate was very rapid and could not be measured until it had slowed down. Air volume exiting the system was thus underestimated, which caused a large gap in mass balance.
Table 3 shows the inferred mass balance if volatilization includes both the measured volatilized p-xylene (10 g) and p-xylene missing from the mass balance (44 g). A volume of 0.85 m³ of contaminated air (63.5 mg/L) at atmospheric pressure and flowing through the chamber at a rate of 241 mL/min at atmospheric pressure during the whole test duration would have been required for the recovery of these 54 g of p-xylene. Such an air flow rate is considered very realistic under the test conditions, which supports the hypothesized mass balance. In the context of future experimentations with foam treatment, an improved air flow measurement system would be necessary.
ACCEPTED MANUSCRIPT
23
Table 3 – P-xylene recovery for each remediation mechanism and hypothesized recovery with corrected volatilization
Measured Hypothesized
Recovery (g) Recovery (%) Recovery (g) Recovery (%)
Mobilization 17 19 17 19
Dissolution 14 16 14 16
Volatilization 10 12 54 65
Total 41 47 85 100
Foam injection had to be stopped overnight because of the length of the test. These stops allowed observation of density contrasts as shown in Figure 13.
Figure 13 – Photos of foam injection in the contaminated sandbox after an overnight stop. The black line is the position of the front before the overnight pause, the yellow line is the foam front actual position. Photos show (a) initial conditions after the overnight stop and (b) 1 min, (c) 5 min, (d) 15 min and (e) 55 min after foam injection had resumed.
ACCEPTED MANUSCRIPT
24
When the injection was stopped, the sandbox inlet and outlet were closed to minimize volatilization. Pressure then homogenized in the sandbox, foam collapsed and fluids redistributed themselves based on their relative densities: surfactant solution accumulated at the base of the sandbox, p-xylene placed itself over liquid surfactant and air occupied the upper part of the sandbox. Infiltration fingers as shown in Figure 13 (a) were then formed. When foam injection was initiated again after the overnight stop, a foam front would form again with its typical “S” shape and push back the p-xylene that had moved downward during the injection discontinuation until it had taken its place back where it was the day before.
4.5 Inverted test
After foam injection, a sandbox test was done with an inverted configuration to confirm some assumptions with regard to foam stability and air by-passing. The coarse Temisca 20 sand was placed below the medium Flint sand.
A water tracer test was carried out in this configuration without contamination. The white ellipse on Figure 14 (a) highlights an air bypass that occurred in the upper part of the Temisca 20 layer. This bypass could explain why, during the previous foam test, air always exited the sandbox before the foam front attained the output. However, in the first configuration of sand, the Temisca 20 sand being on the upper part of the sandbox, the zone where bypass occurred could not be seen because the glass window did not cover the whole surface of sand filling. The contact of foam with water present in the sandbox at the beginning of foam injection seems to make the foam unstable with liquid surfactant separating from air. The presence of liquid surfactant is clear in Figure 14 (d) where the black ellipse highlights a zone where the colored original water with tracer is diluted by liquid surfactant coming from the foam. This implies a loss of pressure with air exiting the sandbox before the foam front attains the outlet.
A glass window on the entire thickness of sand in the sandbox could be an improvement that would at least allow a visual assessment of bypasses. It implies that the entire tested zone could be seen, therefore indicating if any accumulation of contaminant or air occurred in the sandbox upper part. Also, it could allow a simplification of results interpretation since observations and photos of the sandbox would be more representative of the whole experiment.
ACCEPTED MANUSCRIPT
25
Figure 14 – Photos of foam injection in inverted configuration sandbox (coarser layer under finer layer), the black line indicates the foam front locations after (a) 7 sec, (b) 46 sec, (c) 4 min and (d) 1 hour after the start of injection in a non-contaminated sandbox.
5.
Conclusions
This study aimed to better understand foam behavior in layered soil contaminated with LNAPL. Foam injection has many potential advantages that make it a promising LNAPL remediation technology: mobility control achieved by an increase in viscosity and shear-thinning behavior, lowering of interfacial tension with the presence of surfactant for enhanced LNAPL mobilization and the incorporation in foam of a significant portion of air, thus lowering the amount of liquid surfactant solution required, and promoting the volatilization of LNAPLs. These advantages also include potential cost reductions compared to the use of surfactant solutions alone.
2D sandbox tests were carried out in order to evaluate p-xylene recovery with Ammonyx Lo 0.1% w/w in a porous media made up of two layers of silica sand with two different grain sizes and permeabilities. (a) (b) (c) (d) F lo w d ire c tio n Foam Water Medium Coarse (a) (b) (c) (d) (e)
FIGURE 9–PHOTOS OF FOAM INJECTION EXPERIMENT IN UNCONTAMINATED SANDBOX AFTER
ACCEPTED MANUSCRIPT
26
Water injection with tracers indicated delayed piston-shape flows in the sand layers. When compared with test results obtained prior to contamination, p-xylene residual saturation caused an increase in the permeability ratio between both layers. Contamination reduced permeability in the medium sand layer more than in the coarse sand layer, further highlighting the necessity of increasing mobility control during LNAPL recovery. In fact, permeability in a finer layer is expected to be more reduced than in the coarser one because pores are smaller and more easily clogged in the fine layer; being so, the necessity of increase mobility control is more critical in the medium sand layer.
The foam test performed inside the uncontaminated sandbox showed a major improvement in sweeping both layers with a foam front exhibiting a “S” shape spreads over both sand layers, where the front was advancing at the same velocity in both sand layers. The permeability contrast between sand layers was therefore compensated by the mobility control capacity of foam.
Liquid surfactant injection in the contaminated sandbox did not perform well, even if the capillary number of 3.42x10⁻⁵ was theoretically high enough to mobilize some of the p-xylene residual saturation but not enough to entirely clean the sandbox based on the results obtained by Pennell et al., 1996 with PCE. This shows that the critical capillary number required for initiating the mobilization of paraxylene in silica sand is greater than the one required for PCE.
Foam injection in the contaminated sandbox, however, was efficient to clean both layers of the sandbox while advancing in an “S” shape front similar to what was observed during the uncontaminated foam test. Mobilization, volatilization and dissolution took place during foam treatment of the contaminated sandbox. However, a large uncertainty was related to the evaluation of volatilization because of difficulties in the evaluation of air flow rate. So, the total of mass recovered by all mechanisms only represents 48% of the initial p-xylene mass in the sandbox. This is not consistent with sand samples at the end of the test, which indicated a remaining mass of only 0.263 g (0.29% of initial contamination). Assuming that the missing mass was related to volatilization, it was possible to assess the proportions of recovery mechanisms: volatilization would then be responsible for 65% of the total recovery whereas mobilization and dissolution would be responsible for 19% and 16% respectively. A more precise air flow measurement system would be necessary for further testing.
These results show how efficient foam injection can be for the treatment of p-xylene in heterogeneous porous media. This technology needs more laboratory research before field application. Other laboratory sandbox tests are suggested at small (liter) and middle (m3) scales
ACCEPTED MANUSCRIPT
27
with foam generated in situ and with an injection and pumping system that use density contrasts to mobilize NAPL vertically and horizontally. For field applications, a soil vapor extraction system in the unsaturated zone would most likely be required in combination with foam injection since volatilization is a major VOC removal mechanism associated to foam flooding.
A video is associated with the paper and shows the oil recovery observed during this laboratory sandbox experiment.
6.
Acknowledgements
Funding of this study was provided by a NSERC-CRD grant (412730-11) in partnership with TechnoRem Inc and a NSERC-discovery grant (326975-2011) of Dr. Richard Martel. The authors would like to gratefully acknowledge INRS personnel: the help of Mr. Luc Trépanier and Mr. Guillaume Lefrançois in conceiving the experimental setup, Mrs. Uta Gabriel for her advices during sandbox contamination, Mr. Richard Lévesque for sample analyses and Mr. Marco Boutin for figures and tables formatting.
ACCEPTED MANUSCRIPT
29
REFERENCES
Falls, A.H., Musters, J.J., and Ratulowski, J., 1989. The apparent viscosity of foams in homogeneous bead packs. SPE Reservoir Engineering, 155-164.
Farajzadeh, R., Andrianov, A., Hirasaki, G.J., Krastev, R., Rossen, W.R., 2012. Foam–oil interaction in porous media: implications for foam assisted enhanced oil recovery, Adv. Colloid Interface Sci., 183, 1–13.
Freeze, R.A., Cherry, J.A., 1979. Groundwater: Englewood Cliffs, NJ, Prentice-Hall, 604 p. Géraud, B., S. A. Jones, I. Cantat, B. Dollet, and Y. Méheust (2016), The flow of a foam in a
two-dimensional porous medium, Water Resour. Res., 52, 773–790, doi:10.1002/2015WR017936
Hirasaki, G.J., 1989. The steam-foam process. J. Pet. Technol., 41 (5), 449-456.
Hirasaki, G.J., Lawson, J.B., 1985. Mechanism of foam flow in porous media: apparent viscosity in smooth capillaries. SPEJ, 25 (2), 176–190.
Huh, C. 1979 Interfacial Tensions and Solubilizing Ability of a Microemulsion Phase That Coexists with Oil and Brine,” Journal of Colloid and Interface Science, Vol. 71, No. 2, pp. 408-426.
Lake, L.W. 1989 Enhanced oil recovery. Englewood Cliffs (NJ): Prentice Hall, 550 p.
Li, R.F., 2011. Study of Foam Mobility Control in Surfactant Enhanced Oil Recovery Processes in 1-D, Heterogeneous 2-D, and Micro Model Systems. PhD Thesis, Rice University, Houston, Texas.
Longpré-Girard, M., 2015. Étude en laboratoire d‟injection de mousse pour le traitement de sols contaminés aux hydrocarbures. M.Sc. thesis, INRS, August 2015.
Longpré-Girard, M., Martel, R., Robert, T., Lefebvre, R., Lauzon, J.-M., 2016. Surfactant foam selection for enhanced LNAPL recovery in contaminated aquifers. TPIM-D-16-00120, submitted to Transport in Porous Media.
Martel, K.E., 1995. Utilisation de solutions de polymères pour améliorer l‟efficacité de balayage des solutions tensioactives développées pour la restauration d‟aquifères contaminés aux hydrocarbures immiscibles lourds. Thèse M.Sc., Département de géologie et génie géologique, Université Laval, Québec, Canada, 119 p.
Martel, K.E., Martel, R., Lefebvre, R., Gélinas, P., 1998. Laboratory study of polymer solutions used for mobility control during in situ NAPL recovery. Ground Water Monitoring and Remediation, 18(3), 103-113.
Martel, R., Hébert, A.R., Lefebvre, R., Gélinas, P.J., Gabriel, U., 2004. Displacement and sweep efficiencies in a DNAPL recovery test using micellar and polymer solutions injected in a five-spot pattern. Journal of Contaminant Hydrology, 75, 1–29.
Martel, R., Gélinas, P.J., 1996. Surfactant solutions developed for NAPL recovery in contaminated aquifers, Groundwater, 34, 143-154.
Ministère de l‟Environnement du Québec (MEQ), 1998 et mises à jours subséquentes. Politique de protection des sols et de réhabilitation des terrains contaminés. Direction des
ACCEPTED MANUSCRIPT
30
politiques du secteur industriel – service des lieux contaminés. Les Publications du Québec, Sainte-Foy. 124p.
Ogata, A., 1970. Theory of dispersion in a granular medium. U.S. Geological Survey Professional Paper 411-I, p.134.
Pennell, K.D., Pope, G.A., Abriola, L.W., 1996. Influence of viscous and buoyancy forces on the mobilization of residual tetrachloroethylene during surfactant flooding. Environmental Science and Technology, 30 (4), 1328-1335.
Pope, G.A., Bavière M., 1991. Reduction of capillary forces by surfactants. In: M. Bavière (Editor), Basic Concepts in Enhanced Oil Recovery Processes. Barking, UK, Elsevier Science Publishers Ltd.
Ripple, C.D., James, R.V., Rubin, J., 1973. Radial particle-size segregation during packing of particle into cylindrical containers. Power Tech., 8, 165-175.
Robert, T., Martel, R., Conrad, S.H., Lefebvre, R., Gabriel, U., 2006. Visualization of TCE recovery mechanisms using surfactant-polymer in a two dimensional heterogeneous sand model. Journal of Contaminant Hydrology, 86, 3-31.
Rothmel, R.K., Peters, R.W., St. Martin, E., Deflaun, M.F., 1998. Surfactant foam biodegradation of in situ treatment of TCE DNAPLs. Environ. Sci. Technol., 32, 1667-1675.
Roy, D., S. Kongara, and K. Valsaraj, 1995a. Application of surfactant solutions and colloidal gas aphron suspensions in flushing naphthalene from a contaminated soil matrix, J. Hazard. Mater., 42(3), 247–263.
Roy, D., R. R. Kommalapati, K. T. Valsaraj, and W. D. Constant, 1995b. Soil flushing of residual transmission fluid: Application of colloidal gas aphron suspensions and conventional surfactant solutions, Water Res., 29(2), 589–595.
Silva, J.A.K., Smith, M.M., Munakata-Marr, J., McCray, J.E., 2012. The effect of system variables on in situ sweep-efficiency improvements via viscosity modification. Journal of Contaminant Hydrology, 136–137, 117–130.
Szafranski, R., J. Lawson, G. Hirasaki, C. Miller, N. Akiya, S. King, R. Jackson, H. Meinardus, and J. Londergan (1998), Surfactant/foam process for improved efficiency of aquifer remediation, Prog. Colloid Polymer Sci., 111, 162–167.
Van Geel, P.J. and J.F. Sykes, 1997. The importance of fluid entrapment, saturation hysteresis and residual saturations on the distribution of a lighter-than-water non-aqueous phase liquid in a variably saturated sand medium. Journal of Contaminant Hydrology, Volume 25, Issues 3–4, pp. 249-270
Zhong, L., J. Szecsody, F. Zhang, and S. M. Mattigod, 2010. Foam delivery of amendments for vadose zone remediation: Propagation performance in unsaturated sediments, Vadose Zone J., 9, 757–767.
ACCEPTED MANUSCRIPT
31
Highlights (à faire)
Fading of a script alone does not foster domain-general strategy knowledge. Performance of the strategy declines during the fading of a script.
Monitoring by a peer keeps performance of the strategy up during script fading. Performance of a strategy after fading fosters domain-general strategy knowledge. Fading and monitoring by a peer combined foster domain-general strategy knowledge.