© Dandan Miao, 2019
Bottom-up Photochemical Synthesis of Structurally
Defined Graphene Nanoribbons and Conjugated
Polymers
Thèse
Dandan Miao
Doctorat en chimie
Philosophiæ doctor (Ph. D.)
Québec, Canada
Résumé
Le graphène peut être considéré comme l'un des matériaux les plus prometteurs pour les composants électroniques pratiques en raison de ses excellentes propriétés de transport de charge, de sa surface spécifique très élevée, de sa conductivité thermique excellente et de sa grande résistance mécanique. Cependant, ce graphène bidimensionnel est un semiconducteur à bande interdite nulle, ce qui limite son application pratique dans les dispositifs électroniques. L'une des méthodes les plus prometteuses pour ouvrir une bande interdite est le confinement structurel du graphène en bandes étroites, définies comme des nanorubans de graphène (GNR). La bande interdite des GNR peut être contrôlée avec précision par la largeur et la configuration des bords, ce qui donne aux GNR des propriétés optiques et électroniques réglables.
La synthèse ascendante en solution est l’une des stratégies les plus prometteuses pour préparer des GNR structurellement bien définis avec des propriétés optiques et électroniques ajustables. Contrairement aux méthodes descendantes, la stratégie ascendante permet un contrôle précis de la largeur et de la configuration des bords des GNR. Une stratégie couramment utilisée, la réaction de cyclodéshydrogénation catalysée par l'acide de Lewis, appelée réaction de Scholl, a été largement utilisée pour synthétiser une grande variété de GNR bien définis sur des précurseurs de polyphénylène. Cependant, la réaction de Scholl présente de sérieux inconvénients qui limitent la portée et la polyvalence de cette réaction. Le premier est sa faible régiosélectivité qui entraîne des défauts de structure et affecte les propriétés des GNR. Ensuite, les réarrangements indésirables et l'utilisation d'un catalyseur métallique peuvent conduire à la formation de sous-produits. De plus, l'introduction de groupes fonctionnels sensibles aux oxydants et d'hétérocycles riches en électrons est difficile à réaliser en raison des conditions de réaction difficiles, qui limitent la diversité des propriétés structurelles et électroniques des GNR.
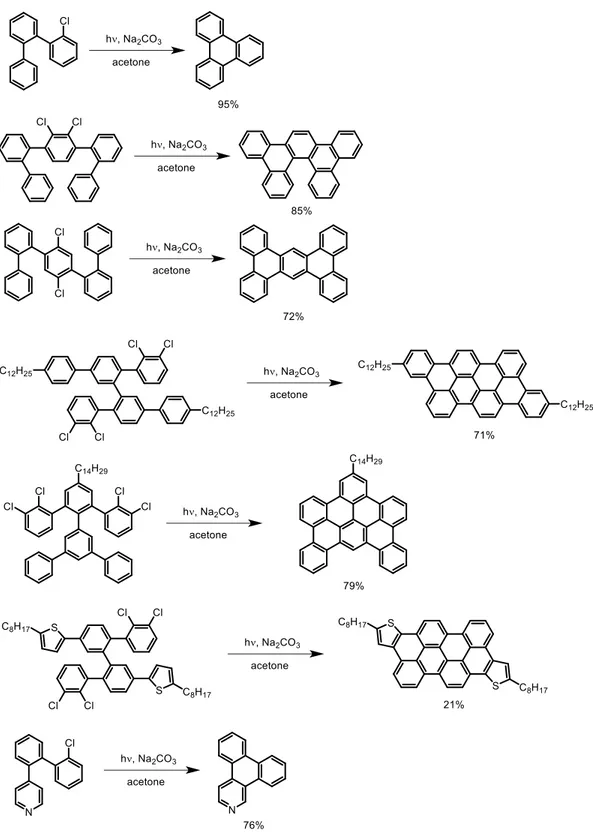
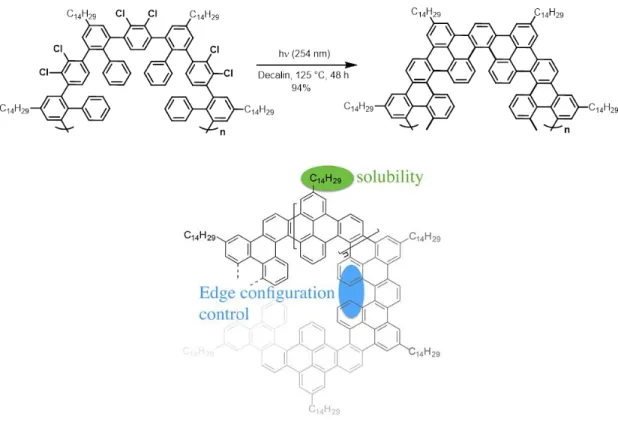
Notre groupe a récemment développé une synthèse de nanographènes et de GNR à l'aide de la réaction de cyclodéhydrochloration photochimique (CDHC) sur des précurseurs de
III
polyphénylène polychlorés. La réaction CDHC possède une haute régiosélectivité et se déroule sans réarrangement ni formation de sous-produits. De plus, la réaction CDHC est conduite sans catalyseur métallique ni oxydant dans des conditions très douces, permettant ainsi l’introduction de différents groupes fonctionnels et hétérocycles sur le GNR afin de moduler leurs propriétés optoélectroniques. En comparant avec la réaction de Scholl, la réaction CDHC permet de mieux contrôler les configuration de bord des GNR. Cette thèse présente en détail l'utilisation de la réaction CDHC pour la préparation de GNR et étudie avec soin les propriétés structurelles et optoélectroniques des GNR produits. Tout d'abord, les GNR asymétriques et latéralement symétriques ont été préparés pour démontrer la régiosélectivité, le contrôle des configuration de bord et l'efficacité de la réaction photochimique CDHC. Ensuite, les GNR à bord thiophène ont été synthétisés pour montrer la polyvalence de la réaction CDHC et étudier l'influence de l'introduction de groupes fonctionnels riches en électrons sur les structures et les propriétés optoélectroniques des GNR. Ensuite, les polymères échelle conjugués (CLP) contenant des unités pyrrole riches en électrons ont été synthétisés pour montrer la compatibilité de la réaction du CDHC avec des groupes fonctionnels très riches en électrons et le rendement élevé de la réaction du CDHC. Enfin, divers dérivés d'ullazine fusionnés avec des hétérocycles riches en électrons ou pauvres en électrons ont été préparés et une série de polymères donneurs-accepteurs conjugués (D-A CP) ont été synthétisés et ces polymères ont été utilisés avec succès dans les cellules solaires à polymères et ont présenté des performances très prometteuse, indiquant l’efficacité, la polyvalence et le caractère pratique de la réaction photochimique CDHC.
Abstract
Graphene is considered as one of the most promising materials for practical electronic components because of its outstanding charge transport properties, very high specific surface area, excellent thermal conductivity, and high mechanical strength. However, this two dimensional graphene is a zero band gap semiconductor, which limits its practical application in electronic devices. One of the most promising methods to open a band gap is the structural confinement of graphene into narrow strips, which is defined as graphene nanoribbons (GNRs). The band gap of GNRs can be precisely controlled by the width and edge configuration, providing GNRs with tunable optical and electronic properties.
Bottom-up, solution-phase synthesis is one of the most promising strategies to prepare structurally well-defined GNRs with tunable optical and electronic properties. Unlike the top-down methods, the bottom-up strategy allows a precise control over the width and edge configuration of GNRs. One of the most commonly used strategy, the Lewis acid catalyzed cyclodehydrogenation reaction, known as the Scholl reaction, has been widely used to synthesize a large variety of well-defined GNRs on polyphenylene precursors. However, the Scholl reaction possesses some serious drawbacks that limit the scope and versatility of this reaction. First is its poor regioselectivity that results in structural defects to affect the properties of GNRs. Then the undesired rearrangements and the use of a metal catalyst can lead to the formation of by-products. Moreover, the introduction of oxidant-sensitive functional groups and electron-rich heterocycles is difficult to achieve due to the harsh reaction conditions, which limits the diversity of structural and electronic properties of GNRs.
Recently, our group reported the synthesis of nanographenes and GNRs using the photochemical cyclodehydrochlorination (CDHC) reaction on polychlorinated polyphenylene precursors. The CDHC reaction possesses high regioselectivity and it proceeds without rearrangements or the formation of side-products. Furthermore, the CDHC reaction is conducted without metal catalyst and oxidant under very mild conditions, thus enabling the
V
introduction of different functional groups and heterocycles onto the GNRS to modulate their optoelectronic properties. And comparing with the Scholl reaction, the CDHC reaction provides better control over the edge configuration of the GNRs. This paper investigates in detail the usefulness of the CDHC reaction for the preparation of GNRs and carefully studies the structural and optoelectronic properties of the GNRs produced. First the laterally symmetrical and unsymmetrical GNRs were prepared to demonstrate the regioselectivity, edge configuration control, and efficiency of the photochemical CDHC reaction. Then the thiophene-edged GNRs were synthesized to show the versatility of the CDHC reaction and study the influence of the introduction of electron-rich functional groups on the structures and optoelectronic properties of GNRs. Then, the conjugated ladder polymers (CLPs) containing electron-rich pyrrole units were synthesized to show the compatibility of the CDHC reaction with very electron-rich functional groups and the high efficiency of the CDHC reaction. Finally various -extended ullazine derivatives fused with electron-rich or electron-poor heterocycles were prepared and a series of conjugated donor-acceptor polymers (D-A CPs) were synthesized and these polymers were successfully employed in the polymer solar cells and exhibited very promising performances, indicating the efficiency, versatility and practicality of the photochemical CDHC reaction.
Table of Content
Résumé... II Abstract ... IV Table of Content... VI List of Tables ... XI List of Figures ... XII List of Schemes ... XXIII List of Abbreviations ... XXIV Acknowledgements ... XXVII Foreword ... XXIX
Introduction ... 1
Chapter 1. Regioselective Synthesis of Graphene Nanoribbons by Photochemical Cyclodehydrochlorination ... 36
1.1. Résumé ... 37
1.2. Abstract ... 37
1.3. Introduction ... 37
1.4. Results and Discussion ... 40
1.4.1. Synthesis ... 40
1.4.2. Size-exclusion chromatography (SEC) analysis ... 41
1.4.3. 1H NMR analysis ... 43
1.4.4. FT-IR analysis ... 44
1.4.5. XPS analysis ... 44
1.4.6. UV-vis and photoluminescence analysis ... 46
1.5. Conclusion... 47
1.6. Acknowledgements ... 47
1.7. Supporting Information ... 49
VII 1.7.2. Apparatus ... 49 1.7.3. Synthesis ... 51 1.7.4. NMR Spectra ... 60 1.7.5. FT-IR analysis ... 69 1.7.6. XPS analysis ... 70
1.7.7. UV-vis and photoluminescence analysis ... 72
Chapter 2. Toward Thiophene-Annulated Graphene Nanoribbons ... 73
2.1. Résumé ... 74
2.2. Abstract ... 74
2.3. Introduction ... 74
2.4. Results and Discussion ... 76
2.4.1. Synthesis ... 76
2.4.2. Size-exclusion chromatography (SEC) analysis ... 78
2.4.3. 1H NMR analysis ... 79
2.4.4. UV-vis and photoluminescence analysis ... 80
2.4.5. DFT calculations ... 84
2.4.6. Raman analysis and DFT calculations ... 85
2.5. Conclusion... 86
2.6. Acknowledgements ... 86
2.7. Supporting Information ... 87
2.7.1. Materials and Methods ... 87
2.7.2. Apparatus ... 87
2.7.3. Synthesis ... 89
2.7.4. NMR Spectra ... 103
2.7.5. UV-visible and photoluminescence analysis ... 117
2.7.6. Lifetime measurements ... 119 2.7.7. Computational methods for structures, isomers, transition states and energies of
pT-GNR and oT-GNR ... 121
2.7.8. Computational methods for simulation of Raman spectra ... 122
2.7.9. DFT models for simulating the Raman spectra of pT-GNR and oT-GNR ... 122
2.7.10. Assignment of the D and G modes of oT-GNR and pT-GNR ... 123
Chapter 3. Photochemical Synthesis of Conjugated Ladder Polymers Containing Pyrrole Units ... 126
3.1. Résumé ... 127
3.2. Abstract ... 127
3.3. Introduction ... 127
3.4. Results and Discussion ... 129
3.4.1. Synthesis ... 129
3.4.2. Size-exclusion chromatography (SEC) analysis ... 130
3.4.3. 1H NMR analysis ... 131
3.4.4. XPS analysis ... 132
3.4.5. UV-vis and photoluminescence analysis ... 134
3.4.6. Electrochemical properties... 136
3.4.7. Chemical titration... 136
3.5. Conclusion... 136
3.6. Acknowledgements ... 137
3.7. Supporting Information ... 138
3.7.1. Materials and Methods ... 138
3.7.2. Apparatus ... 138
3.7.3. Synthesis ... 140
3.7.4. NMR Spectra ... 144
3.7.5. XPS analysis ... 148
3.7.6. UV-vis and photoluminescence analysis ... 150
IX
3.7.8. Chemical titration of H-CLP ... 152
Chapter 4. Photochemical synthesis of -extended ullazine derivatives as new electron donors for efficient conjugated D-A polymers ... 153
4.1. Résumé ... 154
4.2. Abstract ... 154
4.3. Introduction ... 155
4.4. Results and Discussion ... 156
4.4.1. Synthesis of ullazine derivatives ... 156
4.4.2. Optical properties of ullazine derivatives ... 158
4.4.3. Synthesis of polymers ... 158
4.4.4. Size-exclusion chromatography (SEC) analysis and thermal properties of P1, P2 and P3 ... 160
4.4.5. Optical properties of the polymers ... 160
4.4.6. Electrochemical properties... 163
4.4.7. Organic photovoltaics properties ... 164
4.5. Conclusion... 167
4.6. Acknowledgements ... 168
4.7. Supporting Information ... 169
4.7.1. Materials and Methods ... 169
4.7.2. Apparatus ... 169
4.7.3. Fabrication and characterization of polymer solar cells ... 171
4.7.4. Synthesis ... 172
4.7.5. NMR Spectra ... 184
4.7.6. UV-visible and photoluminescence analysis ... 198
4.7.7. Size-exclusion chromatography ... 200
4.7.8. Thermal gravimetric analysis (TGA) and differential scanning calorimetry (DSC) thermal analysis ... 201
4.7.9. Cyclic voltammetry ... 202
4.7.10. Tapping mode atomic force microscopy ... 204
Conclusion and Outlook... 205
XI
List of Tables
Table 4.1. Yields, molecular weights and dispersity indexes of polymers P1, P2 and P3…….160 Table 4.2. Photophysical and electrochemical properties of the polymers………163 Table 4.3 Photovoltaic device parameters of all the polymer solar cells………...164
List of Figures
Figure I.1. Graphene is an atomic-scale hexagonal lattice made of carbon atoms………...2 Figure I.2. Three edge structure graphene nanoribbons: armchair GNR, zigzag GNR and “cove”-type GNR………..3 Figure I.3. The relationship between the reciprocal of energy gap Eg and the width of GNRs…4
Figure I.4. a) Schematic illustration of FMN-assisted graphene dispersion using a sonochemical method. b) AFM image of GNRs with the lateral width sub 10 nm. c) AFM image of GNRs with width narrower than 20 nm and d) width distributions of GNRs produced by sonochemical method………...6 Figure I.5. a) Schematic illustration of the unzipping of CNTs to prepare GNRs. b) The proposed chemical mechanism of CNTs unzipping………..7 Figure I.6. Schematic illustration of the unzipping of CNTs through the polymer-protected Ar plasma etching method………..8 Figure I.7. a-f) Schematic illustration of the lithography process to obtain GNRs by an oxygen plasma etching with a nanowire as the protection mask. g, h) AFM images of a nanowire protection mask on top of the graphene before (g) and after (h) oxygen plasma etching. i) AFM image of the obtained GNRs after sonication removing the nanowire mask. j-k) AFM images of branched and crossed GNRs from merged and crossed nanowire masks………...9 Figure I.8. a) Schematic illustration of the steps for surface-assisted synthesis of GNRs. b) Reaction schemes for N = 7 armchair GNR and chevron-type GNR, as well as their STM images………..11 Figure I.9. a) Surface-assisted synthesis of laterally extended N = 13 armchair GNR and its STM image. b, c) Surface-assisted synthsis of N-doped GNRs and their STM images……….12 Figure I.10. Solution-mediated synthesis of N = 9 armchair GNRs through A2B2-type Suzuki polymerization and its STM image……….14 Figure I.11. Solution-mediated synthesis of laterally extended GNRs through AA-type
XIII
Yamamoto polymerization………..15 Figure I.12. Solution-mediated synthesis of laterally and longitudinally extended GNRs through AB-type Diels-Alder polymerization………..16 Figure I.13. Solution-mediated synthesis of N-doped GNRs through A2B2-type Suzuki polymerization……….17 Figure I.14. Unexpected regioselectivity of an intramolecular Scholl reaction that leads to the formation of highly congested [5]helicenes………18 Figure I.15. Scholl reaction of 3,3’,4,4’-tetramethoxybiphenyl………..19 Figure I.16. Synthesis of GNRs by alkyne benzannulation……….20 Figure I.17. Synthesis of pyrene, peropyrene, and teropyrene derivatives through two-fold and four-fold alkyne benzannulation promoted by Brønsted acids………21 Figure I.18. Synthesis of GNRs through alkyne benzannulation promoted by Brønsted acids……….22 Figure I.19. Bottom-up synthesis of GNRs through thermal polydiacetylene aromatization….23 Figure I.20. Reaction process of Mallory photocyclization reaction………..24 Figure I.21. Two donor-acceptor cove-edge GNRs………25 Figure I.22. Diagram of the photochemical CDHC reaction process……….26 Figure I.23. Planarization of o-phenylene tetramers by photochemical CDHC reaction (top) and Scholl reaction (bottom)………..26 Figure I.24. Several heterocycles structures synthesized by photochemical CDHC reaction…27 Figure I.25. Synthesis of NGs using the photochemical CDHC reaction………...…29 Figure I.26. Synthesis of helically coiled GNRs using the photochemical CDHC reaction…..30 Figure I.27. Regioselective synthesis of GNR1 and GNR2 by the photochemical CDHC reaction………33 Figure I.28. Structures of pT-GNR and oT-GNR.………...33 Figure I.29. Structures of the conjugated ladder polymers L-CLP and H-CLP………..34 Figure I.30. Schematic illustration of the synthesis of ullazine derivatives through the CDHC
reaction and the structure of the D-A CPs………...35
Figure 1.1. Size exclusion chromatography traces for P1 (𝑀n̅̅̅̅: 17.1 kg mol-1 , 𝑀w̅̅̅̅̅: 22.8 kg mol-1, dispersity index (Đ): 1.3, Xn: 34, black trace), GNR1 (𝑀n̅̅̅̅ = 19.0 kg mol-1, 𝑀w̅̅̅̅̅ = 31.7 kg mol-1, dispersity index (Đ): 1.7, red trace), P2 (𝑀n̅̅̅̅: 14.1 kg mol-1 , 𝑀w̅̅̅̅̅: 28.0 kg mol-1 , dispersity index (Đ): 1.9, Xn: 20, blue trace), and GNR2 (𝑀n̅̅̅̅ = 16.6 kg mol-1, 𝑀w̅̅̅̅̅ = 38.5 kg mol-1, dispersity index (Đ): 2.3, pink trace).………43
Figure 1.2. a) 1H NMR spectra of precursor P1 (top) and GNR1 (bottom) in TCE-d2 at 383 K. b) 1 H NMR spectra of precursor P2 (top) and GNR2 (bottom) in TCE-d2 at 383 K.………..45
Figure 1.3. a) FT-IR spectrum of precursor P2 (blue lines) and GNR2 (red lines). b), c), d) FT-IR spectrum of P2 (blue lines) and GNR2 (red lines) zoomed………..46
Figure 1.4. UV-vis absorption spectra of a) P1 and GNR1 and b) P2 and GNR2 in both THF and thin films. Insets: Photoluminescence spectra of a) GNR1 and b) GNR2 in THF solution (ex = 300 nm); dilute solution (left) and spin-cast film (right) of a) GNR1 and b) GNR2 in THF under UV light (= 365 nm)………...48
Figure 1.5. 1H NMR spectrum of compound 1 in CDCl3………60
Figure 1.6. 13C NMR spectrum of compound 1 in CDCl3………...60
Figure 1.7. 1H NMR spectrum of compound 2 in CDCl3………61
Figure 1.8. 13C NMR spectrum of compound 2 in CDCl3………...61
Figure 1.9. 1H NMR spectrum of compound 3 in CDCl3………62
Figure 1.10. 13C NMR spectrum of compound 3 in CDCl3……….62
Figure 1.11. 1H NMR spectrum of compound 4 in CDCl3………..63
Figure 1.12. 13C NMR spectrum of compound 4 in CDCl3……….63
Figure 1.13. 1H NMR spectrum of compound 5 in CDCl3………..64
Figure 1.14. 13C NMR spectrum of compound 5 in CDCl3……….64
Figure 1.15. 1H NMR spectrum of compound 6 in CDCl3………..65
Figure 1.16. 13C NMR spectrum of compound 6 in CDCl3……….65
XV
Figure 1.18. 13C NMR spectrum of compound 7 in CDCl3……….66
Figure 1.19. 1H NMR spectrum of P1 in TCE-d2 at 383 K……….67
Figure 1.20. 1H NMR spectrum of GNR1 in TCE-d2 at 383 K………...67
Figure 1.21. 1H NMR spectrum of P2 in TCE-d2 at 383 K……….68
Figure 1.22. 1H NMR spectrum of GNR2 in TCE-d2 at 383 K………...68
Figure 1.23. a) FT-IR spectrum of precursor P1 (blue lines) and GNR1 (red lines). b), c), d) FT-IR spectrum of P1 (blue lines) and GNR2 (red lines) zoomed………..69
Figure 1.24. XPS spectrum of P1. The presence of oxygen is due to the sample holder made of a silicon-based polymer………...70
Figure 1.25. XPS spectrum of GNR1. The presence of oxygen is due to the sample holder made of a silicon-based polymer………...70
Figure 1.26. XPS spectrum of P2. The presence of silicon and oxygen is due to the sample holder made of a silicon-based polymer………..71
Figure 1.27. XPS spectrum of GNR2. The presence of oxygen is due to the sample holder made of a silicon-based polymer………...………71
Figure 1.28. UV-vis absorption (black) and photoluminescence excitation (red, monitored at em = 500 nm) spectra of GNR1 in THF solution………..72
Figure 1.29. UV-vis absorption (black) and photoluminescence excitation (red, monitored at em = 500 nm) spectra of GNR2 in THF solution………..72
Figure 2.1. Structures of pT-GNR and oT-GNR………..76
Figure 2.2. Size exclusion chromatography traces for P1 (𝑀n̅̅̅̅: 9 700 g mol-1 , 𝑀w̅̅̅̅̅: 13 900 g mol-1, dispersity index (Đ): 1.4, Xn: 13), pT-GNR (𝑀n̅̅̅̅ = 20 800 g mol-1, 𝑀w̅̅̅̅̅ = 38 200 g mol-1, dispersity index (Đ): 1.8), P2 (𝑀n̅̅̅̅: 9 500 g mol-1 , 𝑀w̅̅̅̅̅: 17 100 g mol-1 , dispersity index (Đ): 1.8, Xn: 13), and oT-GNR (𝑀n̅̅̅̅ = 27 700 g mol-1, 𝑀w̅̅̅̅̅ = 81 700 g mol-1, dispersity index (Đ): 2.9).………..79
Figure 2.3. a) 1H NMR spectra of precursor P2 (top) and oT-GNR (bottom) in CDCl3 at 60 °C. b) 1H NMR spectra of precursor P1 (top) and pT-GNR (bottom) in CDCl3 at 60 °C………….82
Figure 2.4. UV-vis absorption spectra of a) P1 and pT-GNR and b) P2 and oT-GNR in both solution (THF, solid lines) and solid state (dashed lines). Insets: Photoluminescence spectra of a)
pT-GNR (ex = 400 nm) and b) oT-GNR (ex = 300 nm) in THF solution………..83
Figure 2.5. Free energy of different conformers of oT-GNR and their transition states as determined by DFT calculations………..84
Figure 2.6. FT-Raman spectra of oT-GNR and pT-GNR compared with results from DFT calculations. The G and D features characteristic of graphene nanoribbons are identified…....85
Figure 2.7. 1H NMR spectrum of compound 1 in CDCl3………..103
Figure 2.8. 13C NMR spectrum of compound 1 in CDCl3……….103
Figure 2.9. 1H NMR spectrum of compound 2 in CDCl3………..104
Figure 2.10. 13C NMR spectrum of compound 2 in CDCl3………...104
Figure 2.11. 1H NMR spectrum of compound 3 in CDCl3………105
Figure 2.12. 13C NMR spectrum of compound 3 in CDCl3………...105
Figure 2.13. 1H NMR spectrum of compound 4 in CDCl3………106
Figure 2.14. 13C NMR spectrum of compound 4 in CDCl3………...106
Figure 2.15. 1H NMR spectrum of compound 5 in CDCl3………107
Figure 2.16. 13C NMR spectrum of compound 5 in CDCl3………...107
Figure 2.17. 1H NMR spectrum of compound 6 in CDCl3………108
Figure 2.18. 13C NMR spectrum of compound 6 in CDCl3………...108
Figure 2.19. 1H NMR spectrum of compound 7 in CDCl3………109
Figure 2.20. 13C NMR spectrum of compound 7 in CDCl3………...109
Figure 2.21. 1H NMR spectrum of compound 8 in CDCl3………110
Figure 2.22. 1H NMR spectrum of compound 9a in CDCl3………..111
Figure 2.23. 13C NMR spectrum of compound 9a in CDCl3……….111
Figure 2.24. 1H NMR spectrum of compound 9b in CDCl3………..112
Figure 2.25. 13C NMR spectrum of compound 9b in CDCl3……….112
XVII
Figure 2.27. 13C NMR spectrum of compound 10a in CDCl3………...113
Figure 2.28. 1H NMR spectrum of compound 10b in CDCl3………114
Figure 2.29. 13C NMR spectrum of compound 10b in CDCl3………...114
Figure 2.30. 1H NMR spectrum of Precursor P1 in CDCl3 at 60 °C………..115
Figure 2.31. 1H NMR spectrum of pT-GNR in CDCl3 at 60 °C………115
Figure 2.32. 1H NMR spectrum of Precursor P2 in CDCl3 at 60 °C……….116
Figure 2.33. 1H NMR spectrum of oT-GNR in CDCl3 at 60 °C………116
Figure 2.34. UV-visible (black) and photoluminescence excitation (red, monitored at em = 550 nm) spectra of pT-GNR in THF solution. The intensity scale of the excitation spectrum is arbitrary……….117
Figure 2.35. UV-visible (black) and photoluminescence excitation (red, monitored at em = 500 nm) spectra of oT-GNR in THF solution. The intensity scale of the excitation spectrum is arbitrary.……….117
Figure 2.36. UV-vis absorption spectra of model compound 4, oligomer 8 and oT-GNR in THF solution………..118
Figure 2.37. UV-vis absorption spectra of compound 7 and oligomer 8 in THF, insert is the photoluminescence spectrum of oligomer 8 in THF (ex = 250 nm)……….118
Figure 2.38. Lifetime data for oT-GNR……….119
Figure 2.39. Lifetime data for pT-GNR……….120
Figure 2.40. Optimized geometry of pT-GNR displayed according to different angle……….121
Figure 2.41. Simulated Raman spectra (left panel) of pT-GNR and oT-GNR based on the tetramer molecular models shown in the right panel. The C and H atoms, which assume a mass of 100 amu in the “heavy end-groups” models are highlighted in light magenta……….123 Figure 2.42. Analysis of the D and G normal modes of the oT-GNR model (heavy end-groups). Red arrows represent displacement vectors; CC bonds are represented as green and blue lines of different thicknesses according to their relative stretching (shrinking). Rings are starred which undergo the same vibrational pattern expected for G and D modes in graphene. Lighter color
stars denote rings for which the match of the expected vibrational pattern is perturbed……..124
Figure 2.43. Analysis of the D and G normal modes of the pT-GNR model (heavy end-groups). The two G modes are associated to the doublet which is observed also in the experiment (1590 cm-1, 1610 cm-1, Figure 3.6). The G mode in the left panel is longitudinal with respect to the polymer chain axis and it is computed at lower wavenumber (1636 cm-1, unscaled) than the other G mode (1654 cm-1, unscaled). Red arrows represent displacement vectors; CC bonds are represented as green and blue lines of different thicknesses according to their relative stretching (shrinking). Rings are starred which undergo the same vibrational pattern expected for G and D modes in graphene. Lighter color stars denote rings for which the match of the expected vibrational pattern is perturbed………..124
Figure 3.1. Structures of the conjugated ladder polymers L-CLP and H-CLP………..129
Figure 3.2. Size exclusion chromatography traces for P1 (𝑀n̅̅̅̅: 16.6 kg mol-1 , 𝑀w̅̅̅̅̅: 29.4 kg mol-1, dispersity index (Đ): 1.8, Xn: 34), L-CLP (𝑀n̅̅̅̅ = 18.5 kg mol-1, 𝑀w̅̅̅̅̅ = 30.7 kg mol-1, dispersity index (Đ): 1.7), P2 (𝑀n̅̅̅̅: 15.8 kg mol-1 , 𝑀w̅̅̅̅̅: 23.3 kg mol-1 , dispersity index (Đ): 1.5, Xn: 32), and H-CLP (𝑀n̅̅̅̅ = 12.8 kg mol-1, 𝑀w̅̅̅̅̅ = 20.4 kg mol-1, dispersity index (Đ): 1.6, Xn: 31)………..131
Figure 3.3. a) 1H NMR spectra of precursor P1 (top) and L-CLP (bottom) in TCE-d2 at 383 K. b) 1 H NMR spectra of precursor P2 (top) and H-CLP (bottom) in TCE-d2 at 383 K………133
Figure 3.4. UV-vis absorption spectra of a) P1 and L-CLP and b) P2 and H-CLP in both solution (THF, solid lines) and solid state (dashed lines). Insets: Photoluminescence spectrum in THF solution (a) ex = 300 nm, b) ex = 292 nm)………..135
Figure 3.5. Changes of UV-vis-NIR spectra observed during chemical titrations of L-CLP with TBPA. Inset: Color changes (from orange to green) after adding different equivalents of TBPA into the L-CLP solution……….137
Figure 3.6. 1H NMR spectrum of compound 1 in CDCl3………..144
Figure 3.7. 13C NMR spectrum of compound 1 in CDCl3……….144
XIX
Figure 3.9. 13C NMR spectrum of compound 2 in CDCl3……….145
Figure 3.10. 1H NMR spectrum of polymer P1 in TCE-d2 at 383 K……….146
Figure 3.11. 1H NMR spectrum of polymer L-CLP in TCE-d2 at 383 K………..146
Figure 3.12. 1H NMR spectrum of polymer P2 in TCE-d2 at 383 K……….147
Figure 3.13. 1H NMR spectrum of polymer H-CLP in TCE-d2 at 383 K………..147
Figure 3.14. XPS spectrum of P1. The presence of oxygen is due to the sample holder made of a silicon-based polymer……….148
Figure 3.15. XPS spectrum of L-CLP. The presence of oxygen is due to the sample holder made of a silicon-based polymer……….148
Figure 3.16. XPS spectrum of P2. The presence of oxygen is due to the sample holder made of a silicon-based polymer………...………..149
Figure 3.17. XPS spectrum of H-CLP. The presence of oxygen is due to the sample holder made of a silicon-based polymer………...149
Figure 3.18. UV-vis absorption (black) and photoluminescence excitation (red, monitored at em = 540 nm) spectra of L-CLP in THF solution. The intensity scale of the excitation spectrum is arbitrary……….150
Figure 3.19. UV-vis absorption (black) and photoluminescence excitation (red, monitored at em = 540 nm) spectra of H-CLP in THF solution. The intensity scale of the excitation spectrum is arbitrary……….150
Figure 3.20. Film Cyclic Voltammetry of L-CLP………..151
Figure 3.21. Film Cyclic Voltammetry of H-CLP……….151
Figure 3.22. Changes of UV-vis-NIR spectra observed during chemical titrations of H-CLP with TBPA. Inset: Color changes (from orange to green) after adding different equivalents of TBPA into the H-CLP solution………..152
Figure 4.1. UV-vis absorption spectra of compounds 5, 7, 9 and 11 in chloroform solution…158 Figure 4.2. UV-vis-NIR absorption spectra of P1, P2, and P3 in a) chloroform solution and b) as thin films………162
Figure 4.3. a) HOMO/LUMO energy levels of the inverted solar cell architecture ITO/ZnO/PEI/PC70BM:polymer/MoO3/Ag used in this work. b) Current density-voltage (J-V) curves of P1 (P2, P3):PCBM (C60 and C70). c) Current density-voltage (J-V) curves of
P3:(PC60BM, PC70BM and ITIC)………..165
Figure 4.4. AFM images obtained in tapping mode (5 5 µm 2) of P3:PC70BM blend films without DIO (on top) and with DIO (on the bottom)………167
Figure 4.5. 1H NMR spectrum of compound 1 in CDCl3………..184
Figure 4.6. 13C NMR spectrum of compound 1 in CDCl3……….184
Figure 4.7. 1H NMR spectrum of compound 2 in CDCl3………..185
Figure 4.8. 13C NMR spectrum of compound 2 in CDCl3……….185
Figure 4.9. 1H NMR spectrum of compound 3 in CDCl3………..186
Figure 4.10. 13C NMR spectrum of compound 3 in CDCl3………...186
Figure 4.11. 1H NMR spectrum of compound 4 in CDCl3………187
Figure 4.12. 13C NMR spectrum of compound 4 in CDCl3………...187
Figure 4.13. 1H NMR spectrum of compound 5 in CDCl3………188
Figure 4.14. 13C NMR spectrum of compound 5 in CDCl3………...188
Figure 4.15. 1H NMR spectrum of compound 6 in CDCl3………189
Figure 4.16. 13C NMR spectrum of compound 6 in CDCl3………...189
Figure 4.17. 1H NMR spectrum of compound 7 in CDCl3………190
Figure 4.18. 13C NMR spectrum of compound 7 in CDCl3………...190
Figure 4.19. 1H NMR spectrum of compound 8 in CDCl3………191
Figure 4.20. 13C NMR spectrum of compound 8 in CDCl3………...191
Figure 4.21. 1H NMR spectrum of compound 9 in CDCl3………192
Figure 4.22. 13C NMR spectrum of compound 9 in CDCl3………...192
Figure 4.23. 1H NMR spectrum of compound 10 in CDCl3………..193
Figure 4.24. 13C NMR spectrum of compound 10 in CDCl3……….193
XXI
Figure 4.26. 13C NMR spectrum of compound 11 in CDCl3……….194
Figure 4.27. 1H NMR spectrum of compound 12 in CDCl3………..195
Figure 4.28. 13C NMR spectrum of compound 12 in CDCl3……….195
Figure 4.29. 1H NMR spectrum of P1 in TCE-d2 at 383 K………...196
Figure 4.30. 1H NMR spectrum of P2 in TCE-d2 at 383 K………...196
Figure 4.31. 1H NMR spectrum of P3 in TCE-d2 at 383 K………...197
Figure 4.32. UV-vis absorption spectra of the compounds 4-7 (a) and 8-11 (b) in chloroform solution………..198
Figure 4.33. Photoluminescence spectra of the compounds 5, 7, 9 and 11 in chloroform solution (ex = 348 nm, 400 nm, 422 nm and 388 nm, respectively)………..199
Figure 4.34. Size exclusion chromatography traces for P1 (𝑀n̅̅̅̅: 12.5 kg mol-1 , 𝑀w̅̅̅̅̅: 22.5 kg mol-1, dispersity index (Đ): 1.8, black trace), P2 (𝑀n̅̅̅̅: 16.8 kg mol-1 , 𝑀w̅̅̅̅̅: 47.0 kg mol-1 , dispersity index (Đ): 2.8, red trace) and P3 (𝑀n̅̅̅̅: 21.4 kg mol-1 , 𝑀w̅̅̅̅̅: 55.6 kg mol-1 , dispersity index (Đ): 2.6, blue trace)……….200
Figure 4.35. TGA plots of P1, P2 and P3 at a scan rate of 10 °C min-1 under nitrogen atmosphere……….201
Figure 4.36. DSC plots of P1, P2 and P3 at a scan rate of 20 °C min-1 under nitrogen atmosphere……….201
Figure 4.37. Film Cyclic Voltammetry of P1………202
Figure 4.38. Film Cyclic Voltammetry of P2………202
Figure 4.39. Film Cyclic Voltammetry of P3………203
Figure 4.40. AFM images obtained in tapping mode (5 × 5 μm2) of P1, P2 and P3 blend with PC60BM films without DIO (on top) and with DIO (on the bottom)………204
Figure 4.41. AFM images obtained in tapping mode (5 × 5 μm2) of P3:ITIC blend film…….204
Figure C.1. Regioselective synthesis of GNR1 and GNR2 by the photochemical CDHC reaction………..205
Figure C.3. Structures of the conjugated ladder polymers L-CLP and H-CLP………207 Figure C.4. Structures of the ullazine derivatives and the schematic illustration of the structures of the D-A CPs………...207 Figure C.5. Synthesis of wider all phenyl-GNR, electron-rich GNR, and electron-poor GNR by the photochemical CDHC reaction………209 Figure C.6. Synthesis of GNR with a permanent dipole moment represented by the grey arrows………210
XXIII
List of Schemes
Scheme 1.1. Different reaction pathways for the CDHC and Scholl reactions on the same structural precursors. The newly formed bonds are shown in red……….………..39 Scheme 1.2. Synthesis of model compound 4, GNR1 and GNR2………..42 Scheme 2.1. Synthesis of piceno[5,6-b:8,7-b’]dithiophene model compound 4, oligomer 8,
pT-GNR, and oT-GNR……….77
Scheme 3.1. Synthesis of model compound 2, L-CLP and H-CLP………...130 Scheme 4.1. Synthetic routes of the ullazine derivatives………..157 Scheme 4.2. Synthetic routes to the D-A polymers………...159
List of Abbreviations
AFM = Atomic Force Microscopy
APPI = Atmospheric Pressure Photo-Ionization BHJ-PSCs = Bulk Heterojunction Polymer Solar Cells Bu4NPF6 = Tetrabutylammonium hexafluorophosphate C-C = Carbon-Carbon
CDHC = Cyclodehydrochlorination CNTs = Carbon Nanotubes
CLPs = Conjugated Ladder Polymers CV = Cyclic Voltammetry
CVD = Chemical Vapor Deposition d = Doublet
D-A CPs = Donor-Acceptor Conjugated Polymers dba = Dibenzylideneacetone
DCM = Dichloromethane
DFT = Density Functional Theory DIO = Diiodooctane
DMF = Dimethylformamide DP = Degree of Polymerization DPP = Diketopyrrolopyrrole
dppf = 1,1'-Bis(diphenylphosphino)ferrocene DSC = Differential Scanning Calorimetry DSSCs = Dye-sensitized Solar Cells
dtbpf = 1,1′-Bis(di-tert-butylphosphino)ferrocene
Eelec
g = Electrochemical Bandgap
Eopt
g = Optical Bandgap
FETs = Field-Effect Transistors FF = Fill Factor
FMN = Flavin Mononucleotide FT-IR = Fourier-transform Infrared GNRs = Graphene Nanoribbons GO = Graphene Oxide
GONRs = Graphene Oxide Nanoribbons GSs = Graphene Sheets
XXV
h = Hour
HOMO = Highest Occupied Molecular Orbital HRMS = High Resolution Mass Spectra
Ion/Ioff = On-Off ratio
ICT = Intramolecular Charge Transfer IID = Isoindigo
ITO = Indium Tin Oxide
Jsc = Short-circuit Current Density
J-V = Current density-voltage
LC-MS = Liquid Chromatography-Mass Spectrometry LUMO = Lowest Unoccupied Molecular Orbital m = Multiplet
MWCNTs = Multi-Walled Carbon Nanotubes NGs = Nanographenes
NIR = Near-Infrared
NMR/RMN = Nuclear Magnetic Resonance/ Résonance Magnétique Nucléaire OFETs = Organic Field-Effect Transistors
OLEDs = Organic Light Emitting Diodes OPVs = Organic Photovoltaics
PAHs = Polycyclic Aromatic Hydrocarbons PCE = Power Conversion Efficiency PDAs = Polydiacetylenes
PDIs = Perylene Diimides PEI = Polyethylenimine
P3HT = Poly(3-hexylthiophene) PMMA = Poly(methyl methacrylate)
PmPV = Poly(m-phenylene-co-2,5-dioctoxy-p-phenylenevinylene) PPh3 = Triphenylphosphine
PVP = Polyvinylpyrrolidone RMS = Root-Mean-Square s = Singlet
SCE = Saturated Calomel Electrode SDS = Sodium Dodecyl Sulphate SEC = Size-exclusion Chromatography
SPhos = 2-Dicyclohexylphosphino-2′,6′-dimethoxybiphenyl SPS = Solvent Purifier System
STM = Scanning Tunnelling Microscopy SWCNTs = Single-Walled Carbon Nanotubes t = Triplet
TBPA = Tris(4-bromophenyl)ammoniumyl hexachloroantimonate TCB = 1,2,4-Trichlorobenzene
TCE = Tetrachloroethane
TEM = Transmission Electron Microscopy TFA = Trifluoroacetic acid
TfOH = Triflic acid
Tg = Glass Transition Temperature TGA = Thermogravimetric Analysis THF = Tetrahydrofuran
TLC = Thin Layer Chromatography TOF = Time-of-Flight
TPD = Thienopyrroledione UHV = Ultra-High Vacuum UV = Ultraviolet
UV-vis = Ultraviolet-visible
Voc = Open-circuit Voltage
XPhos = 2-Dicyclohexylphosphino-2′,4′,6′-triisopropylbiphenyl XPS = X-ray Photoelectron Spectroscopy
Đ = Dispersity Index
XXVII
Acknowledgements
First of all, I would like to thank Prof. Dr. Jean-François Morin. Four years ago, when I was in China, I was very interested in his research group and I applied to come to his group to do my PhD. I really appreciate him for giving me this opportunity to work in his lab and work on the graphene nanoribbons project. He is the most patient and kind professor I have ever met. I sincerely appreciate his selfless support and understanding both on my research project and on my life. Whenever I encounter problems in my research, he always gives me helpful suggestions and guidance, most importantly, he trusts me and gives me great confidence in conducting my research work. I would say, without him, I can’t finish my PhD so smoothly. I would also like to thank Dr. Maxime Daigle. When I came to the lab on the first day, I met him, my colleague Maxime Daigle, he took me to the lab, introduced me in detail the equipment and instruments of the lab. At first, I worked with him on his project, he taught me a lot, from the most basic experimental operations to how to conduct research project independently, he gave me advice and guidance, making me quickly become familiar with my project, and I could work on my project myself. He is both the best research partner and the most important friend in my life.
I would also like to thank Dr. Cyril Aumaitre. He helped me a lot in my project. He is an expert in polymer solar cells and when I did this part of work in my project, he really gave me a lot of useful suggestions and helped me to accomplish all the work. I really appreciate him for his help and guidance to achieve the exciting collaboration results.
I would also like to thank all the colleagues in the Morin’s research group. They are all kind persons and whenever I have a problem, whether in my project or in my life, they are always there to help. They often invite me to attend their party, so that I can enjoy the warmth in a foreign country, which allows me to conduct my research work more freely.
Chemistry, Materials and Chemical Engineering “G. Natta”, Politecnico di Milano) for their kindly collaboration in the Raman analysis and DFT calculations.
Finally, I would like to thank my parents and my husband Mr. Tiezhu Liu for their continuous support and understanding, which gave me confidence and strength to overcome all kinds of difficulties and complete my PhD studies.
XXIX
Foreword
The content of chapter 2 and 4 are identical to the published papers but have been reformatted to ensure the coherence of the thesis.
Chapter 2: Dandan Miaoa, Maxime Daiglea, Andrea Lucottib, Joël Boismenu-Lavoiea, Matteo Tommasini b, and Jean-François Morin*a. Toward thiophene-annulated GNRs, Angewandte
Chemie International Edition, 2018, 57, 3588-3592.
Contribution: I am the first author and I am the principal contributor. I have designed and synthesized the molecules. I also have done the characterization (NMR, UV-Vis and photoluminescence, FT-IR). I also have written the manuscript. Andrea Lucotti and Matteo Tommasini performed the Raman spectroscopy and DFT calculations. Joël Boismenu-Lavoie helped to design the model compounds. Prof. Claudine Allen helped for the measurements of quantum yields. Yannick Ledemi, Samuel Ouellet and Prof. Denis Boudreau helped for time-resolved photoluminescence spectroscopy measurements. Maxime Daigle and Jean-François Morin have contributed to the manuscript writing and edition.
Chapter 4: Dandan Miaoa, Cyril Aumaitrea, and Jean-François Morin*a. Photochemical synthesis of -extended ullazine derivatives as new electron donors for efficient conjugated D-A polymers, Journal of Materials Chemistry C, 2019, 7, 3015-3024.
Contribution: I am the first author and I am the principal contributor. I have designed and synthesized the molecules. I also have done the characterization (UV-Vis-NIR, CV). I also have written the manuscript. Cyril Aumaitre helped in the polymer solar cells application. Cyril Aumaitre and Jean-François Morin have contributed to the manuscript writing and edition.
Introduction
Graphene
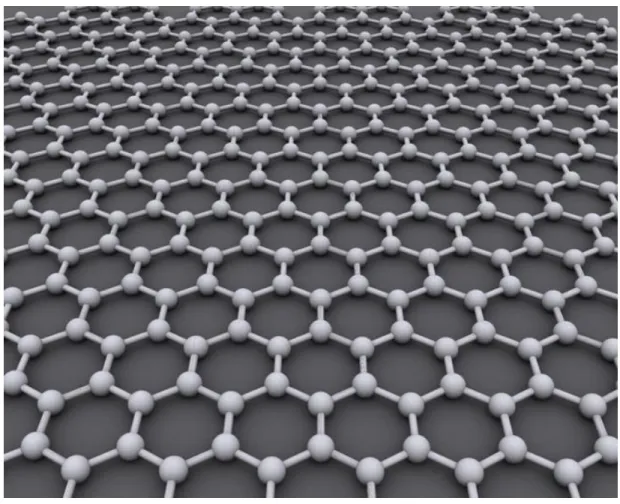
Graphene (as is shown in Figure I.1), a single layer of carbon atoms arranged in a two-dimensional honeycomb lattice. Since first isolated in 2004 by Geim and Novoselov et
al.,1,2 graphene has quickly become a hot research topic in many research areas. Many extraordinary properties of graphene have been reported, such as extremely high charge carrier mobility (> 200 000 cm2 V-1 s-1, several orders of magnitude higher than silicon),3 high specific surface area (2630 m2 g-1),4 excellent thermal conductivity (~ 5000 W m-1 K-1),5 good mechanical properties with a high Young’s modulus (1.0 TPa),6 and unexpectedly high optical transparency (~ 97.7%).7 All of these excellent properties make graphene a promising material for practical applications in future electronics8,9 and optical electronics.10-12
With all of these excellent properties and promising applications, a variety of synthetic methods have been developed for the large scale synthesis of graphene, such as solution exfoliation of graphite,13-15 chemical reduction of graphene oxide (GO),16,17 epitaxial growth on a silicon carbide (SiC) substrate,18-20 and chemical vapor deposition (CVD) on transition-metals surfaces.21-23 Chemical vapor deposition (CVD) has proven to be the most efficient synthetic method for preparing large-area, well controlled graphene sheets.
However, for the application of graphene in electronic devices, in addition to the quality and scale of synthesis, the graphene sheets need to be transfered from the metal surfaces onto the dielectric substrate.24-26 Besides, even though graphene possesses a lot of extraordinary properties, it is intrinsically semi-metallic due to its zero-bandgap nature.27 The absence of bandgap means that the conductivity in graphene cannot be switched off, which definitely hinders its semiconducting applications in electronic devices, such as field-effect transistors (FETs) devices.28 Many approaches have been employed to open a bandgap in graphene, one of the most promising methods is the quantum confinement of graphene into high aspect ratio
2
strips (with lateral width less than 50 nm), which are defined as graphene nanoribbons (GNRs). Both theoretical and experimental studies proved that large and tunable bandgap can be obtained in GNRs.29,30 Thus, GNRs have become one of the most promising materials for the next generation semiconductor electronic devices.
Figure I.1.Graphene is an atomic-scale hexagonal lattice made of carbon atoms.
Graphene Nanoribbons
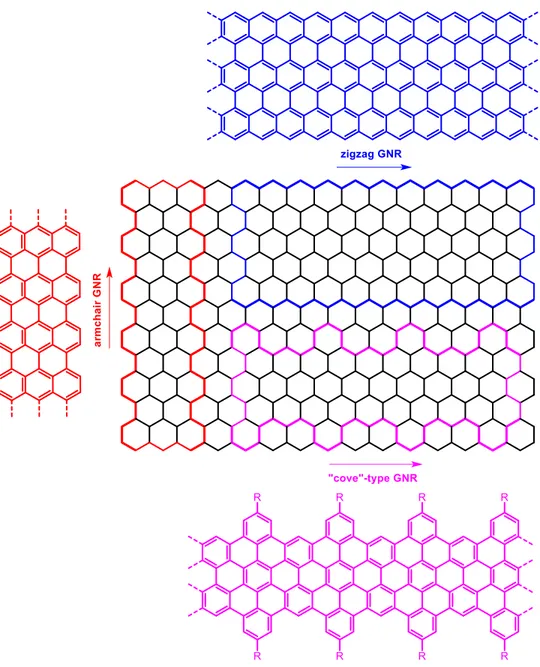
The electronic properties of graphene nanoribbons (GNRs) are critically dependent on their width and edge structures.31 According to the obtained edge structures, there are typically three types of GNRs, namely armchair GNR,32 zigzag GNR33, “cove”-type GNR34 and chiral GNR35. (as is shown in Figure I.2).
Figure I.2. Three edge structures for graphene nanoribbons: armchair GNR, zigzag GNR and “cove”-type GNR. Reproduced from Ref. [32-34].
It has already been reported that the bandgap of GNRs is inversely proportional to its lateral width,30,36,37 which means the bandgap increases as the lateral width decreases (as is shown in Figure I.3). Thus, due to the close relationship between the physical structure and electronic properties of GNRs, it is imperative to find a synthetic method in which the structure of GNRs can be precisely controlled on the atomic scale.
4
Figure I.3. The relationship between the reciprocal of energy gap Eg and the width of GNRs.
Reproduced from Ref. [30]. “Top-down” synthesis of GNRs
Initially, GNRs with various lateral widths (5 nm-500 nm) have been successfully synthesized from larger carbon materials such as graphite, carbon nanotubes (CNTs) and graphene using the so-called “top-down” approach including the sonochemical extraction of expanded graphite, unzipping of CNTs and lithography of graphene. Although these “top-down” approaches proved to be useful in preparing GNRs and studying their electronic properties, obtaining the GNRs with lateral width down to 5 nm and controlling the uniform edge structures is still challenging.
Sonochemical extraction of graphite
The first “top-down” strategy is the sonochemical extraction of expanded graphite. Dai et al38 first reported in 2008 the synthesis of GNRs with lateral width down to sub 10 nm by the
solution-phase sonication and functionalization of expanded graphite in the presence of poly(m-phenylene-co-2,5-dioctoxy-p-phenylenevinylene) (PmPV) (Figure I.4b). Cheng et al39 reported in 2010 the sonochemical cutting of the graphene sheets (GSs) in a mixture of 0.1 wt% polyvinylpyrrolidone (PVP) and 0.1 wt% sodium dodecyl sulphate (SDS) into long and narrower than 20 nm GNRs (Figure I.4c-d). In 2015, Ju et al40 reported the GNRs as small as 10 nm in width formed by the sonochemical graphene unzipping using flavin mononucleotide (FMN) as a surfactant (Figure I.4a).
The sub-10 nm wide GNRs were employed to fabricate field-effect transistors (FETs) by Dai et
al41 in 2008, and the FET devices showed on-off ratio (Ion/Ioff) up to 106 at room temperature and on-state current density as high as ~ 2000 µA/µm. The sub-10 nm wide GNRs based FETs are comparable in performance with small diameter carbon nanotubes (CNTs) devices, but the GNRs have the advantages of all-semiconducting devices. These excellent performances indicated the high quality of the obtained GNRs. However, this method suffered from low reproducibility, low yields, and uncontrollable edge structure and lateral width.
Unzipping of CNTs
The second “top-down” strategy is the longitudinal unzipping of CNTs.42-46 In 2009, Tour et
al42 first reported the unzipping of CNTs through a solution-based oxidative process (as is shown in Figure I.5). Similar to the exfoliation of graphite, multi-walled carbon nanotubes (MWCNTs) were treated with a mixture of concentrated sulfuric acid (H2SO4) and potassium permanganate (KMnO4) and the MWCNTs were unzipped in a linear longitudinal direction to generate graphene oxide nanoribbons (GONRs) with length of ~ 4 µm and lateral width of >100 nm. The subsequent reduction of GONRs with hydrazine (N2H4) was unable to remove all the oxygen-containing functionalities and even optimized method44 reported later can only produced GONRs (length of > 5 µm, width of 75-200 nm) with fewer structural defects. The structural defects affect the electronic properties of the obtained GNRs and the large lateral widths make it hard to open a bandgap.
6
Figure I.4. a) Schematic illustration of FMN-assisted graphene dispersion using a sonochemical method. Reproduced from Ref. [40]. b) AFM image of GNRs with the lateral width sub 10 nm. Reproduced from Ref. [38]. c) AFM image of GNRs with width narrower than 20 nm and d) width distributions of GNRs produced by sonochemical method. Reproduced from Ref. [39]. Later, GNRs with narrower width (10-20 nm) and smooth edges were prepared through the Ar plasma etching of MWCNTs partly embedded in a poly(methyl methacrylate) (PMMA) film (Figure I.6).43 This polymer-protected plasma etching method was applied on an aligned array of single-walled carbon nanotubes (SWCNTs) to obtain highly aligned, narrower (sub-10 nm) GNRs.45 FETs devices were fabricated based on these GNRs and an on-off ratio (Ion/Ioff) up to 103 at room temperature was obtained, indicating the high quality of GNRs obtained by this method.
Figure I.5. a) Schematic illustration of the unzipping of CNTs to prepare GNRs. b) The proposed chemical mechanism of CNTs unzipping. Reproduced from Ref. [42].
8
Figure I.6. Schematic illustration of the unzipping of CNTs through the polymer-protected Ar plasma etching method. Reproduced from Ref. [43].
Lithography of graphene
Another “top-down” strategy is the lithography of graphene. First reported in 2007 by Avouris
et al,47 graphene was patterned using electron-beam lithography first, then an oxygen plasma
etching process was applied to make GNRs with widths range from 20 to 500 nm. The electronic properties of these GNRs were studied by Kim et al30 and they observed that the bandgap scales inversely with the lateral width, demonstrating the ability of lithography to design the bandgap of GNRs. Later, in 2009, this method was optimized by using chemically synthesized nanowires as the protection mask, followed by the oxygen plasma etching to obtain GNRs with lateral width down to 6 nm (Figure I.7).48 By tuning the diameter of the nanowire and the etching time, the lateral width of GNRs can be controlled. Reported by Liu et al49 in 2011, highly aligned GNRs arrays with widths less than 10 nm were fabricated by self-masked plasma etching of wrinkle engineering CVD-graphene. FETs devices showed an on-off ratio
(Ion/Ioff) of ~ 30, suggesting a bandgap of ~ 0.1 eV. Although the lithographic of graphene possesses the advantages of generating aligned GNRs, the low reproducibility and the edge defects (roughness and disorder) are still large problems.
Figure I.7. a-f) Schematic illustration of the lithography process to obtain GNRs by an oxygen plasma etching with a nanowire as the protection mask. g, h) AFM images of a nanowire protection mask on top of the graphene before (g) and after (h) oxygen plasma etching. i) AFM image of the obtained GNRs after sonication removing the nanowire mask. j-k) AFM images of branched and crossed GNRs from merged and crossed nanowire masks. Reproduced from Ref. [48].
10
The “top-down” methods proved to be useful in preparing GNRs which exhibited excellent semiconducting properties with high on-off ratio (e.g. 106) and high mobility (e.g. 1500 cm2 V-1 s-1). However, these methods suffer from low yields, low reproductivity, different lateral widths and random edge structures, which strongly affect their electronic properties and ultimately hinders their practical applications in electronic devices. Besides, in order to open sufficient bandgaps for high on/off ratio FETs devices, the lateral width should be narrowed down to sub-5 nm,50 which is hard to be achieved by the “top-down” methods. Therefore, it is very important to find a synthetic approach where the lateral width and edge structure can be precisely controlled on the atomic scale.
“Bottom-up” synthesis of GNRs
In contrast, “bottom-up” approach enables the synthesis of various GNRs with well-defined structures, narrow lateral width (sub-5 nm), as well as heteroatom doping. Starting from carefully designed small molecules, followed by a polymerization and cyclodehydrogenation, the lateral width, edge structure and heteroatoms doping of GNRs can be precisely controlled. The “bottom-up” approach can be accomplished both on metal surfaces under ultra-high vacuum (UHV) conditions and in solution, which are surface-assisted and solution-mediated approach.
Surface-assisted approach
The surface-assisted synthesis of GNRs was first reported by Müllen and Fasel et al32 in 2010 (Figure I.8). The steps are described in Figure I.8a: the dibrominated monomer was deposited on the metal surface through vacuum sublimation, and annealed at 200 °C to generate the dehalogenated intermediates through surface-catalyzed carbon-halogen bond cleavage, which diffused along the surface and formed the carbon-carbon (C-C) bonds between each monomer to give the precursor polymer chains. Subsequently, the polyphenylene precursors were graphitized through the surface-assisted cyclodehydrogenation at higher annealing temperature
400 °C to result in the GNRs whose lateral width and edge structure are precisely controlled. By using two different monomers 10,10’-dibromo-9,9’-bianthryl and 6,11-dibromo-1,2,3,4-tetraphenyltriphenylene, N = 7 armchair GNR and chevron-type GNR were obtained (Figure I.8b). Insitu high-resolution scanning tunnelling microscopy (STM) visualization and X-ray photoelectron spectroscopy (XPS) analysis confirmed the successful synthesis of the GNRs.
Figure I.8. a) Schematic illustration of the steps for surface-assisted synthesis of GNRs. b) Reaction schemes for N = 7 armchair GNR and chevron-type GNR, as well as their STM images. Reproduced from Ref. [32].
In 2013, a wider N = 13 armchair GNR was reported by Crommie’s group.51 As is shown in Figure I.9a, from an extended dibrominated monomer, laterally extended N = 13 armchair GNR could be synthesized by the surface-assisted approach. Notably, the extended N = 13 armchair GNR have a bandgap of 1.4 eV, which is about 1.0 eV lower than the bandgap for N = 7 armchair GNR (2.3 eV), indicating the engineering of electronic properties. Moreover, except for the modifications of width and edge structures, the tuning of the electronic structures of GNRs can be achieved by heteroatom doping, including N,52-55 B,56,57 and S.58 For example, chevron-type N-doped GNRs with different degrees of N-doping were synthesized by using
12
two different N-doped monomers (Figure I.9b-c).52,53,55 Both theoretical and experimental results showed that the N-doping lowered the electronic energy levels of the GNRs while the bandgap remains unaffected. The energy levels change precisely according to the degree of N-doping, indicating that by controlling the heteroatoms doping, the electronic structures of GNRs can be precisely tuned.
Figure I.9. a) Surface-assisted synthesis of laterally extended N = 13 armchair GNR and its STM image. Reproduced from Ref. [51]. b, c) Surface-assisted synthsis of N-doped GNRs and their STM images. Reproduced from Ref. [52, 53, 55].
The surface-assisted approach enables the synthesis of atomically precise GNRs with different widths, edge structures, and heteroatoms doping. The structures of the GNRs can be clearly characterized using the insitu high-resolution STM. However, the surface-assisted approach requires a very complicated fabrication process, the yield is low, and the obtained GNRs are all bound to the metal surfaces, making it hard to transfer them onto other dielectric substrates for further studies on their electronic properties and hindering their practical application in electronic devices.
Solution-mediated approach
The solution-mediated approach enables the large-scale synthesis of structurally well-defined GNRs, and it also enables the introduction of alkyl chains at the peripheral positions to prevent the -stacking aggregation between each ribbon and allow for their liquid-phase processability. Polyphenylene precursors are prepared from precisely designed monomers through a variety of polymerization reactions like Suzuki polymerization, Yamamoto polymerization, and Diels-Alder polymerization, followed by the graphitization or planarization by oxidative cyclodehydrogenation (the Scholl reaction) to obtain GNRs with precisely controlled structures, increased solubility and heteroatoms doping.
In 2008, Müllen and co-workers first reported the solution-mediated synthesis of linear, 2D N = 9 armchair GNRs via the Suzuki polymerization followed by the Scholl reaction (Figure I.10).59 With dimethyl-octyl on the edges, the as-obtained GNRs possess improved solubility, and thus allowing for liquid-phase processing and STM analysis. The STM analysis indicated that the length of the GNRs was only up to 12 nm. The reason for obtaining such short GNRs is the low degree of polymerization due to the high steric hindrance between the two monomers, as well as the high rigid polyphenylene backbone structure.
In order to obtain the longitudinally extended GNRs, the more efficient AA-type Yamamoto polymerization was employed to synthesize high molecular weight polyphenylene precursors. In 2012, Müllen et al60 reported the synthesis of laterally and longitudinally extended GNRs on the polyphenylene precursor synthesized by AA-type Yamamoto polymerization (Figure I.11). By the high efficient AA-type Yamamoto polymerization, a polyphenylene precursor with a number-average molecular weight (𝑀n̅̅̅̅) of 44 000 g mol-1
was obtained, clearly higher molecular weight values obtained compared to the A2B2-type Suzuki polymerization. The obtained laterally extended GNRs possesses a lateral width of 1.54-1.98 nm with broad absorption extended to near-infrared (NIR) region and an optical bandgap as low as ~ 1.12 eV. The low bandgap GNRs have been successfully employed in optoelectronic devices, like
14
organic photovoltaics, as electron donor materials.61 Later in 2014, an even wider N = 18 armchair GNRs with a lateral width of ∼ 2.1 nm was reported by Müllen, Samori et al (Figure I.11).62 They blended it with poly(3-hexylthiophene) (P3HT) and fabricated the thin-film organic field-effect transistors (OFETs). They fabricated devices with various GNRs loading ratios, and notably, the device with 24% GNRs exhibited a large field-effect mobility (7.3 103 cm2 V-1 s-1), which is four-fold higher than pure P3HT. What’s more, the photoresponse of the transistors were measured to investigate the potential application of these OFETs in optoelectronics and they found the photoresponse of the GNRs-P3HT transistors was two-fold higher than that of the pure P3HT transistor. These results indicate that the performance of the device is enhanced in the presence of GNRs and this suggests the potential application of GNRs in the optoelectronic devices.
Figure I.10. Solution-mediated synthesis of N = 9 armchair GNRs through A2B2-type Suzuki polymerization and its STM image. Reproduced from Ref. [59].
Figure I.11. Solution-mediated synthesis of laterally extended GNRs through AA-type Yamamoto polymerization. Reproduced from Ref. [60, 62].
As described above, laterally extended GNRs could be successfully synthesized through the AA-type Yamamoto polymerization. However, the obtained GNRs were shorter than 50 nm, which is not long enough for the fabrication of single-GNR-based FETs devices. Thus, developing a method for the synthesis of longitudinally extended GNRs with length > 100 nm is highly required. In 2014, Müllen and co-workers63 first reported the synthesis of a “cove”-type GNRs through the AB-type Diels-Alder polymerization, with lateral width of 0.69-1.13 nm and length over 600 nm (Figure I.12). Mischa Bonn’s group applied non-contact, ultrafast terahertz (THz) photoconductivity analysis and found the GNRs had an excellent intrinsic mobility.64 Later, Chongwu Zhou’s group65 successfully deposited the GNRs on the SiO2 surface and fabricated single-GNR-based transistors, which confirmed the semiconducting property of the GNRs and demonstrated the potential application value of chemically synthesized GNRs in the future electronic devices and sensors. The laterally extended GNRs were obtained later with broad absorption into the NIR region and a lowered optical bandgap of ~ 1.2 eV.66 THz photoconductivity measurements showed it possessed excellent intrinsic
16
mobility, similar as the above narrower GNRs.64
Figure I.12. Solution-mediated synthesis of laterally and longitudinally extended GNRs through AB-type Diels-Alder polymerization. Reproduced from Ref. [63, 66].
In addition to controlling the lateral width and edge structure, heteroatoms doping is also an efficient method to modulate the electronic properties of GNRs. Jo et al67 synthesized the N-doped GNRs with different degrees of N-doping (Figure I.13). They found that with increasing the degree of N-doping, the hole mobility of the GNRs decreased while the electron mobility increased. The electron mobility of the GNRs with the highest degree of N-doping is 0.102 cm2 V-1 s-1, which is two orders of magnitude higher than that of non-doped GNRs. These results indicate that by N-doping the charge-transport behavior of the GNRs could be changed from ambipolar to n-type semiconductor.
Scholl reaction
The last and most important step in the “bottom-up” approach is the graphitization of polyphenylene precursors into GNRs. The most widely used method is the intramolecular oxidative cyclodehydrogenation reaction, which is known as Scholl reaction. Pioneered by Müllen and co-workers, various GNRs with different length, width, edge structures, as well as
heteroatoms doping have been synthesized by Scholl reaction.68-70 The obtained GNRs were successfully employed in electronic devices, like photovoltaics and field-effect transistors. However, the Scholl reaction also possesses some drawbacks, like incomplete graphitization, low regioselectivity, undesired rearrangements and incompatibility with electron-rich functional groups.
Figure I.13. Solution-mediated synthesis of N-doped GNRs through A2B2-type Suzuki polymerization. Reproduced from Ref. [67].
Müllen et al71,72 reported that when applying the Scholl reaction, the starting material could be partially cyclized because of the incomplete reactions, and the use of metal chlorides (FeCl3, AlCl3) could create hydrochloric acids, thus generating chlorinated byproducts. Another drawback of the Scholl reaction is the poor regioselectivity of cyclization,73-79 which will generate structurally undefined GNRs. For example, Durola and co-workers78 reported the unexpected regioselectivity of intramolecular Scholl reactions on pentaphenylene compounds (Figure I.14). When applying the Scholl reaction on tetrasubstituted quinquephenyl, the highly congested helicenic isomer tetrabenzanthracene was formed predominantly in 80 % yield, while the flat counterpart dibenzo[5]helicene was obtained in only 8 % yield. In 2016, Israel Agranat’s group74
reported the intramolecular Scholl reaction of 1-benzoylpyrene and found the poor regioselectivity of Scholl reaction generates the formation of 42% five-member ring product and 21% six-member ring compound. The Scholl reaction also suffers from undesired
18
rearrangements,80-84 which interfere with the construction of certain architectures. For example, in 2008 King et al81 reported the Scholl reaction of 3,3’,4,4’-tetramethoxybiphenyl. Because of the skeletal rearrangements involved by the phenyl shift, the oxidation occurred on the rearranged skeleton and an unexpected isomer was obtained, while the expected product was not formed (as is shown in Figure I.15). This indicates that the rearrangements in the Scholl reaction will affect the construction of a particular structure.
Figure I.14. Unexpected regioselectivity of an intramolecular Scholl reaction that leads to the formation of highly congested [5]helicenes. Reproduced from Ref. [78].
In addition, the harsh reaction conditions (Lewis acids, protic acids) make it hard for the introduction of oxidant-sensitive functional groups and electron-rich heterocycles, thus limiting the scope and versatility of the Scholl reaction. Therefore, only electron-poor and chemically robust pyridine, pyrimidine, naphthalene monoimide, and perylene monoimide moieties can be used as edge units to modulate the electronic properties of GNRs.52,85,86 Thus, a milder method
to prepare GNRs that will allow the introduction of a large variety of functional groups and heterocycles, both electron-poor and electron-rich, is thus highly desirable.87,88
Figure I.15. Scholl reaction of 3,3’,4,4’-tetramethoxybiphenyl. Reproduced from Ref. [81]. Synthesis of GNRs through alkyne benzannulation
In order to circumvent some of the drawbacks of the Scholl reaction, other methods with non-oxidative and relatively mild reaction conditions have been employed to synthesize GNRs,
20
like alkyne benzannulation.89-94 Alkyne benzannulation reactions can proceed by using electrophilic reagents,95-97 Brønsted acids,98-101 -Lewis acids,102-106 and radical reagents.107,108 A variety of nanographenes (NGs) and pyrenacenes (pyrene, peropyrene, teropyrene, etc., which can be viewed as GNR oligomers) have been successfully synthesized based on alkyne benzannulation. In 1994, Swager and co-workers90 reported the synthesis of a very narrow GNRs with increased solubility by a Brønsted acid (trifluoroacetic acid, TFA) catalyzed alkyne benzannulation (Figure I.16). This strategy enables the introduction of alkyl substitution (R) to increase the solubility and the obtained GNRs possesses a high molecular weight of 𝑀n̅̅̅̅ = 45 000-55 000 g mol-1. Later, Wu, Zhao et al91 synthesized more conjugated and planar pyrene-based GNRs using a similar method (Figure I.16).
Figure I.16. Synthesis of GNRs by alkyne benzannulation. Reproduced from Ref. [90, 91]. Chalifoux’s group reported the synthesis of a series of pyrene, peropyrene, and teropyrene derivatives through the alkyne benzannulation promoted by Brønsted acids.109 Since the electron-rich ethynyl aryl groups are tolerant to the reaction conditions, they thought the ethynyl thiophene moieties would also be tolerant to Brønsted acid condition and undergo

![Figure I.14. Unexpected regioselectivity of an intramolecular Scholl reaction that leads to the formation of highly congested [5]helicenes](https://thumb-eu.123doks.com/thumbv2/123doknet/3206714.91654/47.918.240.680.333.791/figure-unexpected-regioselectivity-intramolecular-reaction-formation-congested-helicenes.webp)
![Figure I.16. Synthesis of GNRs by alkyne benzannulation. Reproduced from Ref. [90, 91]](https://thumb-eu.123doks.com/thumbv2/123doknet/3206714.91654/49.918.143.771.475.848/figure-i-synthesis-gnrs-alkyne-benzannulation-reproduced-ref.webp)

![Figure I.21. Two donor-acceptor cove-edge GNRs. Reproduced from Ref. [119].](https://thumb-eu.123doks.com/thumbv2/123doknet/3206714.91654/54.918.194.731.107.600/figure-donor-acceptor-cove-edge-gnrs-reproduced-ref.webp)