OATAO is an open access repository that collects the work of Toulouse
researchers and makes it freely available over the web where possible
Any correspondence concerning this service should be sent
to the repository administrator:
tech-oatao@listes-diff.inp-toulouse.fr
This is an author’s version published in: http://oatao.univ-toulouse.fr/20405
To cite this version:
Devatine, Audrey
and Chaumat, Hélène
and Guillaume, Simon
and Tati
Tchibouanga, Bismath
and Durán Martínez, Freddy
and Julcour-Lebigue,
Carine
and Billet, Anne-Marie
Hydrodynamic study of a monolith-type reactor
for intensification of gas-liquid applications. (2017) Chemical Engineering and
Processing, 122. 277-287. ISSN 0255-2701
Official URL:
http://doi.org/10.1016/j.cep.2017.10.015
Hydrodynamic study of a monolith-type reactor for intensification of
gas-liquid applications
Audrey Devatine
⁎, Hélène Chaumat, Simon Guillaume, Bismath Tati Tchibouanga,
Freddy Durán Martínez, Carine Julcour, Anne-Marie Billet
Laboratoire de Génie Chimique, Université de Toulouse, CNRS, INPT, UPS, Toulouse, France
A B S T R A C T
Two-phase monolith-type reactors allow intensified heat and mass transfer rates, but often suffer from fluid maldistribution and undesired flow regimes in channels. A cold-flow monolith reactor (0.1 m diameter, 84 channels) is used here to assess liquid distribution and flow regimes at various air and water velocities: resistive probes give an insight of the flow patterns within 5 representative channels located at different radial positions, showing that regime transition to Taylor flow occurs in these channels simultaneously at lower gas and liquid superficial velocities than predicted by single capillary studies (namely uLand uG< 0.1 m s−1).
A full mapping of the partial liquid flow rates in the monolith channels is derived by a gravimetric method via specifically designed collectors. In the identified Taylor flow domain, liquid distribution exhibits a W-shaped profile with marked peaks at low liquid velocity (uL= 0.04 m s−1). Increasing the liquid flow rate significantly (uL= 0.1 m s−1) smooths liquid distribution, reducing the maldistribution factor by half. Gas velocity also helps phase uniformity but to a smaller extent. It is estimated that even higher fluid velocities (at least tripled) would be required to feed all channels equally. Adding stack of distribution plates of variable cell density at the top of the monolith does not enhance the quality of the liquid distribution, except at low liquid velocity.
1. Introduction
For more than a decade, structured reactors, such as monoliths
[1,2,3]and foam beds[4,5], have been recognized as promising con-tactors for three-phase catalytic reactions. Compared to conventional fixed bed reactors, the monolith technology offers several advantages, among which figure improved process safety and a low pressure drop. It also generates a higher gas-liquid mass transfer rate and a behaviour close to plug flow inside the channels if they host an intermittent series of gas bubbles and liquid slugs (known as Taylor flow). In addition to these good mass transfer properties, such devices can be implemented with a set of parallel channels in which a thermal fluid is circulated to ensure efficient cooling or heating. This allows highly endo- or exo-thermic reactions to be carried out in a compact design. Due to their specific heat and mass transfer performances, monolith reactors are very good candidates for intensified reactors. Surprisingly, application of these reactors at the industrial scale is still rare[6], the main hurdle being related to the high sensitivity of monolith performance to the inlet fluid distribution. Maldistribution of fluids over the channels in-duces various residence times for reactants in the reactor[7]and can lead, in the worst case, to channels being fed with gas only or liquid
only. It is clearly stated throughout the literature that the quality of fluid distribution depends strongly on the fluid injection system, as well as on superficial liquid and gas flow rates and the physicochemical properties of the fluids. Many injection systems exist and have been tested in various flow rate conditions, leading to variable distribution qualities (as detailed below). In this work, the hydrodynamics of gas-liquid flow in the channels of a monolith reactor is characterized and feeding systems are tested at moderate superficial velocities. Note that, as this study does not consider reaction or heat transfer aspects, it was performed in a “cold” set-up, and with tap water and air as the fluids, to facilitate experimentation.
First of all, in view of monolith reactor operation in industry, the gas and liquid flow rates that ensure Taylor flow in all channels were in-vestigated. Throughout the literature, numerous maps can be found where the flow regimes are discriminated for single capillaries, on the basis of the superficial liquid and gas velocities (or liquid and gas Weber numbers). The experimental conditions explored are reviewed
[8,2,9,10,11,12,13,14]. Diagnostics of gas-liquid flow patterns in single channels have been widely published and applied to the flow regime maps[15,11]. For that purpose, several measurement techniques have been employed: optical visualization[16]or high speed video[17];
bubble velocity when feeding a 10-channel array with a multi-capillary injector supplying gas into co-flowing liquid. Note that barrier-based distributors[53,54,55]or tree structures[56]have also been developed to ensure flow equipartition when numbering-up micro/milli-channels, but several of these systems could not prevent maldistribution. Thus homogeneous fluid distribution over the monolith channels remains an issue with conventional approaches, while the scalability of more so-phisticated designs to industrial units remains to be demonstrated. So, in this study, focusing on moderate fluid flow rates for an 84-channel monolith piece, the nozzle is chosen as the reference distributor, as it is conveniently simple for industrial use and seems efficient. However, other distribution systems will also be considered for comparison.
In addition, maldistribution is characterized for the range of liquid and gas flow rates where Taylor flow is expected in all channels studied. Note that low fluid velocities result in long residence times, which may be convenient for reactive applications of such a monolith two-phase contactor. This coupled approach − flow regime map and mal-distribution analysis – is rare. Al-Dahhan et al. [36] studied mal-distribution in a co-current upflow monolith at velocities greater than 0.27 m s−1and verified the flow regimes by tomography. Xu et al.[43] used 10 micro-conductivity probes to characterize both the regime and the liquid distribution in a co-current downflow monolith with square channels. Zhou et al.[57]placed 16 optical fibre probes in a co-current downflow monolith with square channels to analyse flow regime, gas holdup, bubble frequency, bubble velocity and bubble length simulta-neously. They proved that the Taylor flow regime in channels does not guarantee homogeneous phase distribution over channels.
In the following, the set-up and the methods will be described. Results will then be presented in terms of (i) maps for flow regimes and (ii) liquid distribution among the channels. Concluding remarks will underline the influence of flow rate range on the regime map and on distribution quality for a whole monolith, with respect to previously published results related to single channels.
2. Material and methods 2.1. Monolith set-up
The set-up is shown inFig. 1. It comprises one or more monoliths (1) and is equipped with a gas-liquid distribution chamber of 0.09 m in-ternal diameter (2), a 0.005 m3container (3) continuously fed with liquid (tap water), a gear pump (Verder VG 540-05 PT, max flow rate: 500 L h−1at 1 bar) (4), a liquid float flow meter (Brooks, R-8M-25-4FT tube, glass float, needle valve) (5) and a gas float flow meter (Brooks, R tube-6-15-A tube, sapphire float, needle valve) (6). Gas (air) was
Fig. 1. Schematic drawing of the experimental set-up. photodiodes [18]; conductance or capacitance sensors placed at the
channel wall [19,20,21]. Signal processing methods are associated with these measurement techniques: in most cases, Fourier transform and Probability Density Function are applied to the recorded data so that mean phase holdup and characteristic bubble frequencies can be de-rived. Then, the method has to be calibrated through specific mea-surements (channels filled with air or liquid) and direct visualization of the flow regimes. For single capillaries, the effect of various parameters on the transitions between flow regimes has been assessed: (i) channel geometry (circular, triangular, rectangular) [22,16] and channel dia-meter [23,24,15,16,25,26], (ii) liquid properties (see, for example, [8], and [11], (iii) flow direction (horizontal, oblique, upflow, downflow, countercurrent) [23,27,28] and gravity effect [29] and (iv) pressure
[25]. Models have also been developed to predict these transitions
[30,23,24,15,31]. However, information is scarce for moderate velo-cities (i.e. superficial gas and liquid velovelo-cities lower than 0.1 m s−1): in conditions similar to those of interest for this study (air-water system, circular tube of 0.002–0.004 m diameter), a few studies observe the Taylor flow regime [23,22,16,8]). Note, however, that they deal with horizontal capillaries, with the exception of Barnea et al. [23], who also investigated upward flow. Although the flow structure has been ex-tensively studied in single capillaries, very little information is available for the multi-tubular configuration of a monolith reactor, and extra-polation is intricate: due to the different ways the fluids enter the channel, and to possible maldistribution effects, the regime in each channel is a priori unknown and may not be deduced from single ca-pillary cartography [32].
Furthermore, almost all previous maps related to single tube was established through direct visualization and cannot apply to a whole monolith. Thus, for this study, a specific characterization method was developed for investigating the in-channel flow regime.
As mentioned above, providing homogeneous flow rates of gas and liquid over all channels is also of prime importance for monolith reactor operation, and the choice of injection system is crucial. In the literature, the impact of the distributor is generally investigated for an air-water system. The conventional and widely used measurement method is based on liquid collectors set at the outlet of the channels [32] but some authors have used optical fibre sensors [33] or conductive needle sen-sors [2], or, more recently, gamma ray computed tomography
[34,35,36], ultrafast electron beam X-ray tomography [37] or magnetic resonance imaging (MRI) techniques [38,39,40]. In particular, the last two techniques provide not only the time-averaged liquid distribution over the monolith cross-section but also the dynamic features of Taylor flow within individual channels. Associated with a lateral or coaxial gas feed in the injection chamber, many liquid distribution systems have been tested: showerhead [35,33], spray nozzle [41,35,42,43,33], open-pipe [32], perforated plates [44], multi-capillary system [45,33] and liquid ejector [46]. In addition, a packed bed [32,42,43], static mixer
[47], a stack of monolith slices [45,48,49] and ceramic or metallic foam
[35] have been used to further homogenize the feeding flow. A bubbly mixture has also been used to feed a monolith-type concurrent down-flow contactor [50,51]. Among the systems tested, the liquid ejector, the static mixer, the packed bed, the stack of monolith slices and the spray nozzle (if well positioned, as mentioned by [41] led to quite uniform distribution. The liquid distribution observed with the sho-werhead [35,33] and the solid foams [35] was less uniform than that obtained with the nozzle. However, with this simple device, the degree of uniformity strongly depends upon liquid velocity, with best results being obtained at intermediate values close to 0.1 m s−1 [35,33]. Xu et al. [43] report a better liquid distribution when using a packed bed rather than a single nozzle, except at moderate gas velocities, where the tendency is the opposite. Controversial results are found for the multi-capillary liquid distributor: Satterfield and Özel [45] mention severe maldistribution, while Zhou et al. [33] recommend this technology rather than the nozzle and showerhead, especially at low liquid velo-city. Recently, Haase et al. [52] have obtained less than 6% variation in
supplied by the compressed air network available in the laboratory, at a pressure reduced to 1.5 bar.
Liquid was sprayed onto the monolith cross-section in a full cone of 30° by means of a central nozzle (Spraying Systems, Quick FullJet system, reference B3/8 QJA + QGA3009, made of brass). Gas entered the distribution chamber through a side hole (diameter = 0.008 m), located 0.1 m above the nozzle head. The height between the nozzle and the top of the monolith was 0.12 m, so the spray cone covered the whole monolith top section. The nozzle was used alone (Fig. 2a) or in association with 3 stacked plates (Fig. 2b) drilled with holes of de-creasing diameter (D1= 0.012 m, D2= 0.006 m and D3= 0.0025 m) which were inserted between the nozzle and the monolith cross-section (just on top of the monolithic section, without elevation of the nozzle position) in an attempt to improve the fluid distribution into the 84 channels. They are referred to below as the “stack of distribution plates”.
The monolith section was an assembly of blocks of various lengths, manufactured by the selective laser melting technique, in ABS plastic (noted M1, height = 0.1 m) or in resin (noted M2, height = 0.28 m, quasi-transparent). A short transparent monolith, drilled in a thick poly (methyl methacrylate) plate, was also used to visually assess the gas-liquid flow pattern in peripheral channels (noted M3, height = 0.05 m). All monoliths were built with 84 parallel circular channels (internal diameter: 0.002 m) in which air and water flowed co-currently downward. The 84 channels were arranged in 12 columns and 7 rows (corresponding to a cross-section aperture of 12.6%) and indexed as (Ci, Rj), with i = 1 to 12 and j = 1 to 7. The spaced ar-rangement was related to the future implementation, in the final design of the catalytic reactor, of additional channels (in between the 7 rows), dedicated to the circulation of a cooling fluid.
The starting procedure was the following: the liquid was pumped at the highest flow rate for 10 min in order to completely wet the chan-nels. Then, liquid and gas flow rates were set to operational values and the system was run for 1 h before any measurements were made, to ensure that a steady state had been reached. It was verified that con-stant flow rates were obtained in the channels after 1 h, and that the experiments were reproducible in standard conditions.
2.2. Characterization of flow regimes 2.2.1. Resistive probe systems
To draw a map of the various flow regimes observed in the reactor, monoliths M1 and M3 were associated as illustrated in Fig. 3a and the influence of the channel location in the monolith was studied. For this purpose, five channels of monolith M3, located at different
representative radial positions (Fig. 3c), were equipped with a resistive probe at their output (2 silver wires inserted in the channel wall, see
Fig. 3b) connected to a low frequency generator and a numerical os-cilloscope. Two-phase flow regime in the monolith could then be qua-lified by both visual observation in the external channels of monolith M3 and analysis of the transient tension signals resulting from the time variation of the local liquid retention in the five selected channels. Different characteristics of the signal were examined to univocally as-sociate it with a flow regime: Fast Fourier Transform spectrum and Probability Density Function. The ranges of gas and liquid flow rates allowing intermittent (Taylor) flow in the channels were investigated. Note that the resistive probe technique differs from other methods (like tomography or MRI) because it allows flow regimes other than Taylor flow (bubbly or annular-churn) to be identified.
2.2.2. Pretreatment and normalization of the signal
A digital FIR (Finite Impulse Response) filter was applied to the voltage signal u(t) with 50 Hz as the selected cut-off frequency. The signal was processed when steady flow operation was reached. FFT (Fast Fourier Transform) was performed and spectra were plotted for each recording to check the stability of the flow structure.
To obtain a dimensionless resistivity of the two-phase flow r(t), the voltage signal u(t) was normalized using minimum and maximum re-corded values: ua(channel containing only air) and uw(channel con-taining only water), respectively.
= − − r t u u t u u ( ) w ( ) w a (1)
It should be noted that, for any kind of gas-liquid flow, the probes at the channel outputs were always lubricated (even for bubbles in Taylor flow). Consequently, the resistivity never reached r = 1. On the other hand, air was always present between the probes, except when a liquid slug passed through (Taylor flow), but slug velocities were too high to allow the resistivity to reach r = 0. The Probability Density Function of the measured dimensionless resistivity was then determined for a qualitative assessment of the different flow regimes.
2.2.3. Correspondence between flow regimes and PDF curves
This correspondence was established using a peripheral channel (C1, R3) (Fig. 3c) which was specifically connected to a transparent capillary fed with air and water through a T-junction and showing a known flow regime. Three main flow regimes were distinguished by associating the recorded signals with direct visual observations. Signal characteristics are detailed in Section3.1.
Fig. 2. Injection devices: a) distribution chamber using nozzle alone, b) stack of distribution plates.
2.2.4. Cartography of flow regimes
In this case, liquid was spread over the monolith using the nozzle distributor. The signals of the 5 channels were simultaneously recorded and the corresponding flow regimes were assessed according to the preliminary correspondence study. Superficial velocities lower than usual reported values were investigated here:
0.015 m s−1< u
G < 0.5 m s−1, and 0.03 m s−1< uL< 0.3 m s−1. It was checked that inlet flow rates and room temperature did not vary during the experiment.
2.3. Evaluation of the liquid distribution
To evaluate the homogeneity of the liquid distribution, several specific devices (machined in PMMA and called collectors) were placed below the monolith block to collect the liquid exiting each channel of one of the seven rows. By repeating the measurement for each row, it
was possible to access the liquid flow rate in every channel by weighing the mass of liquid collected during a given period of time. Once the steady state regime had been established, the experiment duration was set so as to recover significant quantities of liquid.
The collector had a complex configuration in two parts. Part A (Fig. 4a) selected the row to be investigated. Only 4 distinct versions of part A were necessary (because of the symmetry of the channel ar-rangement) to individually collect the 7 rows. Holes of part A have the same diameter as the channels of monolith. Part A was in direct contact with the monolith, with the channels perfectly aligned. It induced only a short extension of the channels (∼0.02 m), which did not lead to any significant pressure drop or disturbance of the two-phase flow. The li-quid from each column of the row under investigation was then col-lected through part B of the collector (Fig. 4b) and stored in one of 12 individual tanks.
For this specific study, four identical interconnected M2 blocks were used for a total length of 1.12 m (to get closer to a pilot reactor). Studs were placed at (C1, R7) and (C12, R1) to ensure good alignment be-tween the monolith sections. The extremum velocities of the Taylor Fig. 3. Characterization of flow regimes inside the monolith: a) assembly of monolith blocks, b) re-sistive probes at the channel output, c) location of the 5 test channels on the cross-section of monolith M3.
flow domain identified in all the monitored channels were examined (see Section3.1.2andFig. 9). The corresponding operating conditions are listed inTable 1.
Liquid distribution was also assessed for much higher flow rates (uL= 0.23 m s−1and uG= 0.34 m s−1), using a short monolith (M1 assembled without stud) to prevent flooding.
As mentioned above, two configurations for gas-liquid distribution were compared: i) the nozzle alone and ii) the nozzle associated with the stack of distribution plates.
3. Results 3.1. Flow regimes
3.1.1. Correspondence between flow regimes and PDF of resistivity signal Kreutzer et al.[7]identified six flow regimes that we roughly di-vided into three main types: (1) Taylor flow (repeated patterns with either short or long bubbles), (2) bubbly flow, and (3) “annular-churn” flow. In the range of flow rates investigated, the only signals that could not be assigned to any of these regimes corresponded to the transition
between bubbly flow and Taylor flow.Fig. 5shows some representative dimensionless resistivity signals for the three regimes andFig. 6 pro-vides the corresponding PDF graphs.
In the case of Taylor flow, the time evolution of resistivity exhibits a sine wave shape, indicating the periodic passage of bubbles (Fig. 5a and b). The FFT spectra show, as expected, a fundamental frequency cor-responding to the frequency of unit cell (gas bubble + liquid slug) passages over the sensor. When the gas flow rate is increased, the FFT spectrum becomes noisier, and a decrease of fundamental frequency can be observed (8 Hz inFig. 5a and 4 Hz inFig. 5b).The corresponding PDF is bimodal (Fig. 6a). At low to moderate gas to liquid velocity ratio, the highest peak occurs for a low value of resistivity, which means that liquid slugs are larger than bubbles. The plateau between the two peaks is due to the combination of two phenomena. The first is a bubble cap effect resulting in a gradual increase in resistivity and the second is the presence of very small gas bubbles (much smaller than the channel diameter) in liquid slugs. When the gas flow rate is increased the maximum of the PDF shifts towards high resistivity values, with a small peak at low values indicating the presence of liquid menisci between the bubbles (Fig. 6a). For the other flow regimes (bubbly or annular-churn), the PDF shows, as expected, a single peak at moderate re-sistivity for bubbly flow and high rere-sistivity for annular-churn flow (Fig. 6b). The PDF of the bubbly to Taylor flow transition was spread over a wide band (not shown), indicating a large variability of gas hold-ups. Note that, for each record, the transient signal, PDF curve and FFT spectrum were examined together to reliably identify the flow regime. uG= 0.02 ms−1 uG= 0.10 ms−1
uL= 0.04 m s−1 Exp. A Exp. B
uL= 0.10 m s−1 Exp. C Exp. D
Fig. 5. Time evolution of dimensionless resistivity for Taylor flow with short (a) and long (b) bubbles, bubbly flow (c), and “annular-churn” flow (d). The schematic representations of the corresponding flow structures are shown above the graphs.
Table 1
Operating conditions for the study of liquid distribution.
3.1.2. Cartography of flow regimes
Experiments conducted for the air-water system allowed resistivity data to be recorded for the 5 equipped channels of monolith M3, si-multaneously.
As an illustration of results obtained,Figs. 7 and 8show the maps of flow regimes obtained for channels (C6, R4) and (C11, R1), respec-tively. In these two figures, superficial velocities uLand uGrefer to the fluid flow rates feeding the monolith divided by the whole cross section of the 84 channels. It is recalled that channel (C6, R4) was situated at the centre of the monolith section, whereas channel (C11, R1) was on one side, close to a corner of the channel distribution area (seeFig. 3c).
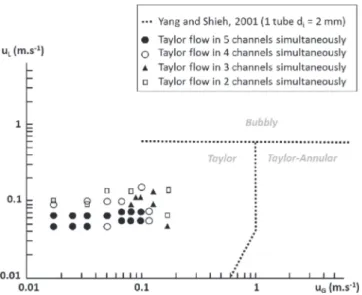
It was observed that the boundary velocities of their flow maps enclosed the boundaries for the other three channels.Figs. 7 and 8also show the transition boundaries between flow regimes, as observed by Yang and Shieh[8]in a horizontal single capillary of 0.002 m diameter; Although these authors have considered a horizontal capillary (instead of vertical as in our study) this comparison is probably relevant because gravity effect is not expected to play a role in microchannel flow for channel sizes up to about 2 mm as suggested by Fukano and Kariyasaki[24]. Few regime maps are available in the literature concerning vertical flows, except those published by Mishima and Hibiki[15]and Barnea et al.[23], but the former map investigates higher superficial velocities than those tested in our study, and the latter map deals with much larger channel diameters.
First, it can be directly observed from the flow maps that various types of flow regimes occur in a given channel, depending on the gas and liquid flow rates feeding the monolith block. Significant differences in the velocity ranges where Taylor flow occurs could be seen when comparing flow maps for channels (C6, R4) and (C11, R1). This sug-gests that, for given global values of gas and liquid flow rates, these two channels are not fed by similar amounts of gas and liquid, and under-lines maldistribution in the monolith. It is worth mentioning that channel (C6, R4), located at the centre of the monolith area, offered a wider range of fluid velocities to the Taylor flow. Channels placed at the monolith periphery ((C1, R3) and (C11, R1)) showed very similar flow maps with a large range available to bubbly flow. Channels (C4, R5) and (C9, R6) showed intermediate results (see in Supplementary data). If the 5 channels investigated can be considered as sufficiently re-presentative of the majority of the 84 channels (as shown later), it is then clear that, in our study, the Taylor flow occurs for channels be-longing to a whole monolith, in a narrower range of gas and liquid superficial velocities than observed in the work of Yang and Shieh[8], which was performed with a single capillary. Considering the computed average liquid velocity in each channel, according to Yang and Shieh
[8], Taylor flow would be the only regime expected in our channels at the investigated fluid flow rates, whereas bubbly flow and annular flow were also observed. An explanation may be that the specific devices used for gas and liquid injection in single capillaries enhanced the es-tablishment of Taylor flow[14]. Because of both the specific entrance conditions and the maldistribution, Taylor flow occurred in the monolith at lower fluid superficial velocity than in single channel ex-periments. This proves that flow maps derived for single capillaries cannot be applied to monolith operation.
InFig. 9, the flow maps for the 5 equipped channels are merged into a single map, highlighting the velocity ranges where Taylor flow can be observed in several channels simultaneously.
For the experiments considered, the ranges for gas and liquid su-perficial velocity allowing simultaneous occurrence of Taylor flow in 4 or 5 channels were 0.015 m s−1< u
G< 0.10 m s−1, and 0.035 m s−1< u
L< 0.10 m s−1. Although it would be interesting to refine these ranges from data coming from all the channels, they en-close the optimal operational velocity ranges for the tested system, and should be recommended for the operation of a monolith with 0.002 m Fig. 6. PDF of resistivity signal for Taylor flow re-gime (a), bubbly and “annular-churn” flow rere-gimes (b).
Fig. 7. Flow regime map for channel (C6, R4).
channels distributed as shown on Fig. 3c, using a spray nozzle and fluids with physicochemical properties similar to those of the air-water system. These ranges being considerably different from those derived from flow maps determined with a single capillary, the question of the quality of fluid distribution amongst channels in these operating con-ditions of low superficial velocities is raised.
3.2. Liquid distribution
3.2.1. Liquid distribution with nozzle in the Taylor flow domain
In this part, the extremum conditions of the Taylor flow domain identified inFig. 9are qualified in terms of liquid distribution homo-geneity. The corresponding operating conditions are listed inTable 1. To start with, only the nozzle was used at the monolith inlet.
To verify that there was no leakage between channels and no channels were blocked, water was made to flow in each channel and it was checked that the entire amount introduced was recovered at the corresponding channel outlet. Note that no liquid came out of the corner channels (C1, R7) and (C12, R1) because of the presence of the studs.
Then some repeatability tests were performed by comparing the partial liquid flow rate from each column of a given row during three successive experiments. InFigs. 10 and 11, this is expressed as “liquid flow rate fraction” with reference to the set flow rate.
Good agreement among tests was observed for the central channels
(Fig. 10), the mean standard deviation being about 8%, with a max-imum difference of 17%.
However, the distribution of the liquid in the peripheral channels appeared to be less stable (Fig. 11) yielding a mean standard deviation of up to 40%.
The measurement of individual channel contributions was extended to all rows, giving values for the entire monolith after 7 experiments. Summing these partial flow rates (obtained through distinct experi-ments) should yield the set overall liquid flow rate if the same steady state distribution was reached in each test. This was indeed the case for the maximum liquid and gas flow rates (experience D: QL= 2.6·10−5m3s−1and Q
G= 2.6·10−5m3s−1), for which a devia-tion of only 3.3% was observed between the sum of measured partial flow rates (named ‘calc. QL’) and the actual overall value (Table 2). Reducing the gas flow rate by more than a factor 5 kept the mass bal-ance fairly satisfactory (deviation lower than 15%), while the major effect came from the liquid flow rate: the deviation reached 30.7% at QL= 1.0·10−5m3s−1 (uL= 0.04 m s−1). This reveals that, at small liquid flow rate, the distribution of the liquid amongst channels was not totally repeatable when the set-up was switched off between experi-ments. As shown by repeatability tests, this effect was particularly pronounced near the wall. All this suggests that the effect of liquid flow rate on the stability – and thus probably the quality – of the distribution is more pronounced than that of gas flow rate.
To check this latter point,Fig. 12reports the liquid distribution for these four operating conditions in terms of liquid flow rate fraction, defined as previously by reference to the set flow rate. The sum of all contributions is not 100%, as mentioned inTable 2. As this was mainly due to peripheral channels, the comparison between configurations can be reliable for the central ones. If the liquid distribution was homo-geneous, each channel (except the two blocked corners) should account for about 1.2% of the total flow.
Note that, onFig. 12, the resistive probe positions are identified by red circles. Their distribution over the monolith section is satisfactory, as their actual liquid flow rates cover a large range of the observed distribution. This figure also explains some of the differences regarding the flow regime observed in channels (C6, R4) and (C11, R1). Ac-cording to the measured flow maps (Figs. 7 and 8), bubbly flow would Fig. 9. Synthesis of flow regime maps: simultaneous occurrence of Taylor flow in several
channels.
Fig. 10. Repeatability experiments at uL= 0.10 m s−1and uG= 0.10 m s−1for the 4th
row.
Fig. 11. Repeatability experiments at uL= 0.10 m s−1and uG= 0.10 m s−1for the 7th
row.
Table 2
Comparison between the overall liquid flow rates set at the inlet and calculated by summing the contributions of the 82 channels (measured in separate experiments).
Exp. uL uG QL Calc. QL deviation
(m s−1) (m s−1) (m3s−1) (m3s−1) A 0.04 0.02 1.0·10−5 8.1·10−6 −21.5% B 0.04 0.10 1.0·10−5 7.2·10−6 −30.7% C 0.10 0.02 2.6·10−5 2.9·10−5 13.8% D 0.10 0.10 2.6·10−5 2.5·10−5 −3.3%
be expected in the channels as early as uL= 0.2–0.3 m s−1. At low li-quid velocity (uL= 0.04 m s−1), the centre channel receives up to six times the mean liquid flow, but without preventing the occurrence of Taylor flow. Conversely, its contribution is reduced to about the mean value when uLis raised to 0.1 m s−1, while that of channel (C11, R1) is about three times higher leading to transition to bubbly flow. None-theless, it can also be seen that, for low or high liquid velocity, at least four of the five selected channels exhibit liquid flow rates close to or lower than the mean value. This thus suggests that the existence of regimes other than Taylor flow within the investigated range, as shown on regime maps, may not be the only consequence of fluid mal-distribution.
For all the studied conditions, the liquid was not equally distributed with the spray nozzle injector: the distribution was W-shaped. This pattern was also observed for liquid saturation by Xu et al.[43]with a liquid velocity (uL= 0.046 m s−1) similar to our lower bound, but a much higher gas velocity (uG= 0.44 m s−1). This means that the lar-gest liquid flow rates were obtained at the two open channels in the corners ((C1, R1) and (C12, R7)) and, to a lesser extent, in the monolith central area. As mentioned above, the bump in the centre was also more pronounced at low liquid velocity. As reported by Roy and Al-Dahhan
[35], the liquid cone coming from the nozzle was probably not optimal at small liquid flow rate, the liquid being concentrated in the central section and splashing towards the wall. This splashing effect could be unstable and could explain the repeatability problem at low liquid ve-locity. However, the nozzle could not be responsible for all the phe-nomena: the spraying angle of the nozzle used should exhibit only weak dependence on the liquid flow rate, leading to a similar liquid cone for all the operating conditions. A bubbly liquid layer was always observed at the top of the monolith. The square shape of the monolith section and the circular shape of the distribution chamber could be responsible for high liquid flow rate in the peripheral channels. Previous studies have
also reported similar results. Behl and Roy[32]observed a better flow distribution when increasing the liquid flow rate in the same range of liquid velocity (uLbetween 0.04 and 0.085 m s−1) with a packed bed distributor and, to a lesser extent, with a pipe distributor. For liquid velocities of up to 0.2 ms−1and a nozzle injector, Schubert et al.[37] mentioned empty channels in the peripheral area, near to channels with high gas hold-up.
The gas effect cannot be easily deduced fromFig. 12, and a global criterion has to be calculated for this purpose.
Most authors [32] and [43] use a “normalized maldistribution factor” to qualify the homogeneity of the distribution. It is defined as the variance of the partial liquid flow rates (qL,iin the ithchannel) di-vided by the square of the mean flow rate (qL,mean= QL/N, with N = 82):
∑
⎜ ⎟ = ⎛ ⎝ − ⎞ ⎠ σ N q q q 1 i L i L mean L mean 2 , , , 2 (2) The results are reported inTable 3, confirming the “homogenization effect” of high liquid flow rates: the value of σ² is reduced by 13% or 44% when QLis multiplied by 2.5.Similarly, increasing the gas flow rate appears to improve the liquid distribution: σ2also decreases by 13 to 44% in the range investigated. This tendency was hardly observable on liquid distribution and is put into evidence by the σ2criterion.
Fig. 12. Liquid distribution in the monolith for different operating conditions (seeTable 1).
Table 3
Normalized maldistribution factor for the operating conditions investigated. σ2 uG= 0.02 m s−1 u
G= 0.10 m s−1
uL= 0.04 m s−1 1.62 0.90
No clear trend was found in the literature regarding the gas effect: working with a packed bed distributor at uL= 0.014 ms−1, Behl and Roy [32] observed negligible variations for uG <0.25 ms−1 but a worsened maldistribution when the gas velocity was increased beyond this value (in the range 0.25–0.68 m s−1). This trend was reduced at uL= 0.04 ms−1and even reversed at uL= 0.085 m s−1. Our results are in agreement with the latter case. The gas velocity effect differs from the liquid velocity effect, probably because of the complex two-phase flow above the monolith.
3.2.2. Liquid distribution for nozzle combined with a stack of distribution plates
As the maldistribution also depends upon the injection system, the previous distributions obtained with the nozzle only are now compared with those observed when the stack of distribution plates was added. In this case, we excluded rows 1 and 7 because of the lack of stability in this area. Rows 2, 4 and 6 were studied andTable 4shows the nor-malized maldistribution factor based on this reduced number of chan-nels for the two distributor devices.
Stack of distribution plates improved the liquid distribution at low fluid flow rates while they had almost no effect at high flow rates. At small velocities, adding distribution plates led to a more uniform liquid distribution, even though some large heterogeneity remained, in par-ticular in the peripheral area, as shown by the liquid flow rate dis-tribution obtained on the 6th row (Fig. 13). Previously, we supposed that, at low liquid velocity, the liquid cone produced by the nozzle might not be optimal. In this case, the stack of distribution plates could be of some help. To insure a satisfactory liquid distribution, the quality of the nozzle is essential.
3.2.3. Liquid distribution at high fluid velocities
For comparison purposes, the liquid distribution was examined at much higher liquid and gas velocities, closer to the values reported for Taylor flow in a single capillary, namely at uL= 0.23 m s−1 and
4. Conclusion
In this study, the flow regimes and the liquid distribution in chan-nels of a monolith piece have been investigated by using air and tap water over a large range of gas and liquid superficial velocities. A specific approach has been developed to study the flow regime in the channels, which allows flow patterns to be recorded simultaneously inside several channels of the monolith. This work focused particularly on low values of the fluid velocities (gas and liquid), which are sur-prisingly rarely considered in literature. Low fluid velocities result in long residence times, which may be convenient for reactive applications of such a monolith two phase contactor.
The results clearly show that the maps of flow regimes established for single capillaries (for example the map by[8]) cannot be applied to state the type of flow within the channels of a monolith. This is prob-ably due to (i) the different phenomena generated by the specific de-vices used for flow injection into a single capillary and into a whole monolith, and (ii) the maldistribution of fluids into the channels. It is indeed observed that Taylor flow corresponds to a narrower superficial fluid velocity range than expected by measurements in single capillaries (uL< 0.1 m s−1instead of uL < 0.6 m s−1and uG < 0.1 m s−1 in-stead of uG < 1 m s−1).
Considering the liquid distribution in the channels, the strong in-fluence of the value of liquid flow rate on the quality of the distribution has been evidenced here. Liquid distributions obtained at elevated fluid flow rates are more stable in time and more homogeneous than those obtained at low flow rates. The use of distribution plates positioned σ2 Nozzle Nozzle + distribution plates
uL= 0.04 m s−1, uG= 0.02 m s−1 1.40 0.79
uL= 0.10 m s−1, uG= 0.10 m s−1 0.57 0.63
Fig. 13. Comparison of liquid flow rate fraction measured in the 6th row when using nozzle only or nozzle + stack of distribution plates at uL= 0.04 m s−1and uG= 0.02 m s−1.
Table 4
Effect of the distributor device on the normalized maldistribution factor, considering rows 2, 4 and 6.
uG = 0.34 m s−1. The nozzle distributor was considered first. In this configuration, summing all channel contributions led to 99.9% of the introduced flow rate, suggesting even more stable conditions than previously. The corresponding distribution (Fig. 14) also seemed more homogeneous than at lower flow rates, even though there was still some heterogeneity at the periphery and a larger amount of liquid at the centre. The normalized maldistribution factor was around 0.18, which strongly confirms the previous observation.
Then, distribution plates were added to the nozzle. In this case, the normalized maldistribution factor was largely higher and very large liquid quantities were collected in columns 2 and 11. In these flow rate conditions, the presence of distribution plates increased the mal-distribution. It can be concluded that the single nozzle may lead to a satisfactory liquid distribution, especially at high velocities, when the liquid spray is optimized.
below the nozzle and above the monolith inlet section does not enhance the quality of the liquid distribution, except at low velocity.
Funding
This work was supported by the French National Research Agency through grant “HYDROMORE” (ANR-12-CDII-0011).
Acknowledgment
The authors thank J. Labadie, E. Prévot and I. Coghe (LGC Toulouse) for the design and implementation of the experimental set-up.
References
[1] F. Kapteijn, T.A. Nijhuis, J.J. Heiszwolf, J.A. Moulijn, New non-traditional multi-phase catalytic reactors based on monolithic structures, Catal. Today 66 (2–4) (2001) 133–144,http://dx.doi.org/10.1016/S0920-5861(00)00614-3. [2] S. Roy, T. Bauer, M. Al-Dahhan, P. Lehner, T. Turek, Monoliths as multiphase
Reactors: a review, AIChE J. 50 (11) (2004) 2918–2938,http://dx.doi.org/10. 1002/aic.10268.
[3] M.T. Kreutzer, F. Kapteijn, J.A. Moulijn, Shouldn't catalysts shape up?: structured reactors in general and gas–liquid monolith reactors in particular, Catal. Today 111 (1–2) (2006) 111–118,http://dx.doi.org/10.1016/j.cattod.2005.10.014. [4] D. Edouard, M. Lacroix, C. Pham, M. Mbodji, C. Pham-Huu, Experimental
mea-surements and multiphase flow models in solid SiC foam beds, AIChE J. 54 (11) (2008) 2823–2832,http://dx.doi.org/10.1002/aic.11594.
[5] X. Ou, X. Zhang, T. Lowe, R. Blanc, M.N. Rad, Y. Wang, N. Batail, C. Pham, N. Shokri, A.A. Garforth, P.J. Withers, X. Fan, X-raymicro computed tomography characterization of cellular SiC foams for their applications in chemical en-gineering, Mater. Charact. 123 (2017) 20–28,http://dx.doi.org/10.1016/j. matchar.2016.11.013.
[6] J.P. Lopes, A.E. Rodrigues, Z.I. Önsan, A.K. Avci (Eds.), Monolith Reactors, in Multiphase Catalytic Reactors: Theory, Design, Manufacturing, and Applications, John Wiley & Sons, Inc., Hoboken, NJ, USA, 2016, ,http://dx.doi.org/10.1002/ 9781119248491ch8.
[7] M.T. Kreutzer, F. Kapteijn, J.A. Moulijn, J.J. Heiszwolf, Multiphase Monolith Reactors: chemical reaction engineering of segmented flow in microchannels, Chem. Eng. Sci. 60 (2005) 5895–5916,http://dx.doi.org/10.1016/j.ces.2005.03. 022.
[8] C.Y. Yang, C.C. Shieh, Flow pattern of air-water and two-phase R-134a in small circular tubes, Int. J. Multiphase Flow 27 (2001) 1163–1177,http://dx.doi.org/10. 1016/S0301-9322(00)00070-7.
[9] E.A. Chinnov, O.A. Kabov, Two-phase flows in pipes and capillary channels, High Temp. 44 (5) (2006) 773–791,http://dx.doi.org/10.1007/s10740-006-0094-z. [10] L. Cheng, G. Ribatski, J.R. Thome, Two-phase flow patterns and flow-pattern maps:
fundamentals and applications, Appl. Mech. Rev. 61 (050802) (2008) 1–28,http:// dx.doi.org/10.1115/1.2955990.
[11] N. Shao, A. Gavriilidis, P. Angeli, Flow regimes for adiabatic gas-liquid flow in microchannels, Chem. Eng. Sci. 64 (11) (2009) 2749–2761,http://dx.doi.org/10. 1016/j.ces.2009.01.067.
[12] E.V. Rebrov, Two-phase flow regimes in microchannels, Theor. Found. Chem. Eng. 44 (4) (2010) 355–367,http://dx.doi.org/10.1134/S0040579510040019. [13] E.A. Chinnov, F.V. Ron’shin, O.A. Kabov, Regimes of two-phase flow in micro- and
minichannels (review), Thermophys. Aeromech. 22 (3) (2015) 265–284,http://dx. doi.org/10.1134/S0869864315030014.
[14] S. Haase, D.Y. Murzin, T. Salmi, Review on hydrodynamics and mass transfer in minichannel wall reactors with gas-liquid Taylor flow, Chem. Eng. Res. Des. 113 (2016) 304–329,http://dx.doi.org/10.1016/j.cherd.2016.06.017.
[15] K. Mishima, T. Hibiki, Some characteristics of air-water two-phase flow in small diameter vertical tubes, Int. J. Multiphase Flow 22 (1996) 703–712,http://dx.doi. org/10.1016/0301-9322(96)00010-9.
[16] K.A. Triplett, S.M. Ghiaasiaan, S.I. Abdel-Khalik, D.L. Sadowski, Gas-liquid two-phase flow in microchannels. Part I: two-two-phase flow patterns, Int. J. Multitwo-phase Flow 25 (1999) 377–394,http://dx.doi.org/10.1016/S0301-9322(98)00054-8. [17] H. Liu, C.O. Vandu, R. Krishna, Hydrodynamics of taylor flow in vertical capillaries:
flow regimes, bubble rise velocity, liquid slug length, and pressure drop, Ind. Eng. Chem. Res. 44 (14) (2005) 4884–4897,http://dx.doi.org/10.1021/ie049307n. [18] J. Oriol, J.P. Leclerc, C. Jallut, P. Tochon, P. Clement, Characterization of the
two-phase flow regimes and liquid dispersion in horizontal and vertical tubes by using coloured tracer and non-intrusive optical detector, Chem. Eng. Sci. 63 (1) (2008) 24–34,http://dx.doi.org/10.1016/j.ces.2007.08.079.
[19] N.K. Omebere-Lyari, B.J. Azzopardi, A study of flow patterns for gas-liquid flow in small diameter tubes, Chem. Eng. Res. Des. Trans. IChemE 85 (A2) (2007) 180–192,
http://dx.doi.org/10.1205/cherd05059.
[20] H. Canière, C.T. T’Joen, A. Willockx, M. De Paepe, Capacitance signal analysis of horizontal two-phase flow in a small diameter tube, Exp. Therm. Fluid Sci. 32 (2008) 892–904,http://dx.doi.org/10.1016/j.expthermflusci.2007.10.011. [21]J. Ye, L. Peng, Flow regime identification of gas liquid two phase flow in vertical
tube with small diameter, The 7th International Symposium on Measurement Techniques for Multiphase Flows, AIP Conf. Proc. 1428 (2012) 353–358. [22] J.W. Coleman, S. Garimella, Characterization of two phase flow patterns in small
diameter round and rectangular tubes, Int. J. Heat Mass Transf. 42 (1999) 2869–2881,http://dx.doi.org/10.1016/S0017-9310(98)00362-7.
[23] D. Barnea, Y. Luninski, Y. Taitel, Flow pattern in horizontal and vertical two phase flow in small diameter pipes, Can. J. Chem. Eng. 61 (1983) 617–620,http://dx.doi. org/10.1002/cjce.5450610501.
[24] T. Fukano, A. Kariyasaki, Characteristics of gas-liquid two-phase flow in a capillary tube, Nucl. Eng. Des. 141 (1993) 59–68,http://dx.doi.org/10.1016/0029-5493(93) 90092-N.
[25] L. Chen, Y.S. Tian, T.G. Karayiannis, The effect of tube diameter on vertical two-phase flow regimes in small tubes, Int. J. Heat Mass Transf. 49 (2006) 4220–4230,
http://dx.doi.org/10.1016/j.ijheatmasstransfer.2006.03.025.
[26] M. Venkatesan, S.K. Das, A.R. Balakrishnan, Effect of tube diameter on two-phase flow patterns in mini tubes, Can. J. Chem. Eng. 88 (2010) 936–944,http://dx.doi. org/10.1002/cjce.20410.
[27] A.M. Barajas, R.L. Planton, The effect of contact angle on two-phase flow in ca-pillary tubes, Int. J. Multiphase Flow 19 (2) (1993) 337–346,http://dx.doi.org/10. 1016/0301-9322(93)90007-H.
[28] S. Wongwises, M. Pipathattakul, Flow pattern, pressure drop and void fraction of two-phase gas–liquid flow in an inclined narrow annular channel, Exp. Therm. Fluid Sci. 30 (2006) 345–354,http://dx.doi.org/10.1016/j.expthermflusci.2005. 08.002.
[29] L. Galbiati, P. Andreini, Flow pattern transition for horizontal air-water flow in capillary tubes. Microgravity equivalent system simulation, Int. Commun. Heat Mass Transf. 21 (4) (1994) 461–468,http://dx.doi.org/10.1016/0735-1933(94) 90045-0.
[30] Y. Taitel, D. Bornea, A.E. Dukler, Modelling flow pattern transitions for steady Fig. 14. Liquid distribution in the monolith at uL= 0.23 m s−1 and
upward gas-liquid flow in vertical tubes, AIChE J. 26 (3) (1980) 345–354,http:// dx.doi.org/10.1002/aic.690260304.
[31] M.K. Akbar, S.M. Ghiaasiaan, Stability of stratified gas–liquid flow in horizontal annular channels, Exp. Therm. Fluid Sci. 28 (2003) 17–21,http://dx.doi.org/10. 1016/S0894-1777(03)00086-4.
[32] M. Behl, S. Roy, Experimental investigation of gas–liquid distribution in monolith reactors, Chem. Eng. Sci. 62 (2007) 7463–7470,http://dx.doi.org/10.1016/j.ces. 2007.08.032.
[33] Y. Zhou, M. Al-Dahhan, M. Dudukovic, H. Liu, Effect of distributor design on gas-liquid distribution in monolithic bed at high gas/gas-liquid ratios, Chin. J. Chem. Eng. 20 (4) (2012) 693–700,http://dx.doi.org/10.1016/S1004-9541(11)60237-1. [34] T. Bauer, S. Roy, R. Lange, M. Al-Dahhan, Liquid saturation and gas-liquid
dis-tribution in multiphase monolithic reactors, Chem. Eng. Sci. 60 (2005) 3101–3106,
http://dx.doi.org/10.1016/j.ces.2004.12.041.
[35] S. Roy, M. Al-Dahhan, Flow distribution characteristics of a gas–liquid monolith reactor, Catal. Today 105 (2005) 396–400,http://dx.doi.org/10.1016/j.cattod. 2005.06.062.
[36] M.H. Al-Dahhan, A. Kemoun, A.R. Cartolano, S. Roy, R. Dobson, J. Williams, Measuring gas–liquid distribution in a pilot scale monolith reactor via an Industrial Tomography Scanner (ITS), Chem. Eng. J. 130 (2007) 147–152,http://dx.doi.org/ 10.1016/j.cej.2006.06.022.
[37] M. Schubert, S. Kost, R. Lange, T. Salmi, S. Haase, U. Hampel, Maldistribution susceptibility of monolith reactors: case study of glucose hydrogenation perfor-mance, AIChE J. 62 (12) (2016) 4346–4364,http://dx.doi.org/10.1002/aic.15334. [38] M.D. Mantle, A.J. Sederman, L.F. Gladden, S. Raymahasay, J.M. Winterbottom,
E.H. Stitt, Dynamic MRI visualization of two-phase flow in a ceramic monolith, AIChE J. 48 (2002) 909–912,http://dx.doi.org/10.1002/aic.690480425. [39] L.F. Gladden, M.H.M. Lim, M.D. Mantle, A.J. Sederman, E.H. Stitt, MRI visualisation
of two-phase flow in structured supports and trickle-bed reactors, Catal. Today 79 (2003) 203–210,http://dx.doi.org/10.1016/S0920-5861(03)00006-3.
[40] A.J. Sederman, J.J. Heras, M.D. Mantle, L.F. Gladden, MRI strategies for char-acterising two-phase flow in parallel channel ceramic monoliths, Catal. Today 128 (2007) 3–12,http://dx.doi.org/10.1016/j.cattod.2007.04.012.
[41] A.K. Heibel, F.J. Vergeldt, H. van As, F. Kapteijn, J. Moulijn, T. Boger, Gas and liquid distribution in the monolith film flow reactor, AIChE J. 49 (12) (2003) 3007–3017,http://dx.doi.org/10.1002/aic.690491203.
[42] M. Xu, H. Huang, X. Zhan, H. Liu, S. Ji, C. Li, Pressure drop and liquid hold-up in multiphase monolithic reactor with different distributors, Catal. Today 147 (2009) 132–137,http://dx.doi.org/10.1016/j.cattod.2009.07.025.
[43] M. Xu, H. Liu, C. Li, Y. Zhou, S. Ji, Connection between liquid distribution and gas-liquid mass transfer in monolithic bed, Chin. J. Chem. Eng. 19 (5) (2011) 738–746. [44] S. Irandoust, B. Andersson, E. Bengtsson, M. Siverstrom, Scaling up of a monolithic
catalyst reactor with 2-phase flow, Ind. Eng. Chem. Res. 28 (10) (1989) 1489–1493,
http://dx.doi.org/10.1021/ie00094a009.
[45]C. Satterfield, F. Özel, Some characteristics of two-Phase flow in monolithic catalyst structures, Ind. Eng. Chem. Fundam. 16 (1) (1977) 61–67.
[46] R.R. Broekhuis, R.M. Machado, A.F. Nordquist, The ejector-driven monolith loop reactor- experiments and modeling, Catal. Today 69 (2001) 87–93,http://dx.doi. org/10.1016/S0920-5861(01)00358-3.
[47] M.T. Kreutzer, J.J.W. Bakker, F. Kapteijn, J.A. Moulijn, Scaling-up multiphase monolith reactors: linking residence time distribution and feed maldistribution, Ind. Eng. Chem. Res. 44 (2005) 4898–4913,http://dx.doi.org/10.1021/ie0492350. [48] R.C. Cornelison, W.R. Alcorn, Assignee: CAMET Inc., 1987 Process for the
Hydrogenation of Organic Compounds. US patent EP 0233642.
[49] J. Leloup, D. Letourneur, M. Moreno, P. Woehl, Assignee: Corning Inc., 2004. Stacked Monolithic reactor and Process. US patent US 6824749.
[50] M. Winterbottom, H. Marwan, R. Natividad, Selectivity, hydrodynamics and solvent effects in a monolith cocurrent downflow contactor (CDC) reactor, Can. J. Chem. Eng. 81 (3–4) (2003) 838–845,http://dx.doi.org/10.1002/cjce.5450810367. [51] R. Natividad, J. Cruz-Olivares, R.P. Fishwick, J. Wood, J.M. Winterbottom,
Scaling-out selective hydrogenation reactions: from single capillary reactor to monolith, Fuel 86 (9) (2007) 1304–1312,http://dx.doi.org/10.1016/j.fuel.2006.12.005. [52]S. Haase, T. Bauer, R. Lange, Numbering-up of mini- and microchannel contactors
and reactors, Chim. Oggi Chem. Today 33 (2) (2015) 26–30.
[53] N. De Mas, A. Gunther, T. Kraus, M.A. Schmidt, K.F. Jensen, Scaled-out multilayer gas-liquid microreactor with integrated velocimetry sensors, Ind. Eng. Chem. Res. 44 (24) (2005) 8997–9013,http://dx.doi.org/10.1021/ie050472s.
[54] V. Haverkamp, V. Hessel, H. Löwe, G. Menges, M.J.F. Warnier, E.V. Rebrov, M.H.J.M. de Croon, J.C. Schouten, M.A. Liauw, Hydrodynamics and mixer-induced bubble formation in micro bubble columns with single and multiple-channels, Chem. Eng. Technol. 29 (9) (2006) 1015–1026,http://dx.doi.org/10.1002/ceat. 200600180.
[55] M. Al-Rawashdeh, F. Yu, T.A. Nijhuis, E.V. Rebrov, V. Hessel, J.C. Schouten, Numbered-up gas–liquid micro/milli channels reactor with modular flow dis-tributor, Chem. Eng. J. 207–208 (2012) 645–655,http://dx.doi.org/10.1016/j.cej. 2012.07.028.
[56] J. Yue, R. Boichot, L. Luo, Y. Gonthier, G. Chen, Q. Yuan, Flow distribution and mass transfer in a parallel microchannel contactor integrated with constructal distributors, AIChE J. 56 (2) (2010) 298–317,http://dx.doi.org/10.1002/aic. 11991.
[57] Y. Zhou, M.P. Dudukovic, M.H. Al-Dahhan, H. Liu, Multiphase hydrodynamics and distribution characteristics in a monolith bed measured by optical fiber probe, AIChE J. 60 (2) (2014) 740–748,http://dx.doi.org/10.1002/aic.14269.
![Fig. 1. Schematic drawing of the experimental set-up.photodiodes [18]; conductance or capacitance sensors placed at the](https://thumb-eu.123doks.com/thumbv2/123doknet/3063880.86467/3.892.510.781.847.1114/schematic-drawing-experimental-photodiodes-conductance-capacitance-sensors-placed.webp)