Proceedings of the 12th International Conference on Auditory Display, London, UK, June 20-23, 2006
3D REAL-TIME AURALIZATION WITH SEPARATE RENDERING OF
DIRECT SOUND, REFLECTIONS AND DIRECTIONAL LATE
REVERBERATION
S. Lesoinne, N. Werner, J.J. Embrechts
INTELSIG group, University of Liege
Institut Montefiore B28, B-4000 Liege, Sart-Tilman - Belgium
[email protected], [email protected], [email protected]
ABSTRACT
Auralization in room acoustics is created by the convolution of an anechoic audio signal with the RIR (room impulse response), either computed or measured at the receiver location. This paper addresses the directional RIRs computed by ray tracing and presents a technique to improve the directionality of the DRIR (directional room impulse response) introduced in [1]. This improvement consists in providing each component of the direct sound and first reflections (up to a given order) separately of directional late reverberation which is still computed as in [1].
1. INTRODUCTION
Auralization in room acoustics is created by the convolution of an anechoic audio signal with the RIR (room impulse response), either computed or measured at the receiver location. If a unique convolved signal is used for each sound reproduction device, the listener cannot detect any localization effect. For example, an effect due to the sound source or to the presence of a sharp mirror reflection on a lateral wall or on the ceiling cannot be reproduced. All that can be simulated is the impression of reverberation in the virtual room.
Ray tracing gives impulse responses including both early and late reverberation, but classical techniques provide no information about the incidence direction of acoustical energy.
Mirror-images techniques can be used to compute early reflections as a solution to include directionality. But problems arise with diffuse reflections that cannot be accounted for by this method and with increasing complexity in the order of reflection [2]. Moreover, late reverberation still has to be calculated separately and typically won’t include directionality. Therefore, ray-tracing or theoretical approximations (exponential decay) are often used as complementary techniques to the mirror-image method.
Assuming an exponential decay for the diffuse and late reverberation part of the echogram is indeed a good approximation in most cases. However in some particularly disproportionate rooms [1], significantly different decays are observed (fig. 3 and 4).
To include directionality directly in ray tracing results, the concept of directional impulse responses has been introduced previously [1]. With this concept, the different contributions to the sound field around the listener’s head are distinguished with respect to their direction of incidence. The drawback is that to compute precisely the echograms, the computation cost becomes excessively high.
The present paper introduces a hybrid technique providing first reflections and late reverberation separately. Both parts are computed in only one pass of the ray tracing program. First reflections contributions are computed by inferring the first orders source images locations and acoustical powers from the ray-tracing process. Moreover, a directional late reverberation decay is estimated, also by ray tracing. This original technique results in a better compromise between accuracy and computational cost than pure ray tracing. What is expected by this technique is a better auralization in particular spaces (long disproportionate reverberant halls, subway stations …) in which the late reverberation significantly deviates from a pure exponential decay. It will be the aim of the demonstration to illustrate that people can really appreciate the differences.
2. DIRECTIONAL IMPULSE RESPONSE AT THE
LISTENER POSITION
For a listener at a given location in the virtual room, we define a spherical coordinate system (θ, φ).
Y Z X ϕ θ Ω d
Figure 1. Axis system and angles defining the direction
of sound incidence at the listener’s head.
By definition the directional room impulse response (DRIR) hSR(θ,φ,t) dΩ is the room impulse response evaluated at the listener position, but in absence of the listener, by a transparent receiver that would only collect the sound contributions coming from a very small solid angle dΩ including the direction of interest. The DRIR depends on the source (S) and receiver (R) positions. If a signal s(t) is emitted by the source, the omnidirectional pressure at the receiver is:
( )
=
∫∫
( )
∗
(
)
⋅
πϕ
θ
θ
ϕ
θ
4sin
,
,
t
d
d
h
t
s
t
p
SR SR (1)where * symbolizes the convolution product.
In general, the DRIR will rather be integrated in a finite solid angle Ωm, the extent of which is of course to be precised.
Proceedings of the 12th International Conference on Auditory Display, London, UK, June 20-23, 2006
In the following, the symbol hSR(m,t) will be used for this “integrated” DRIR.
2.1. Computation by a Sound Ray Program
The DRIR could be measured with a directional microphone [3]. This research project is rather based on computed auralization, i.e. auralization that is produced with computed impulse responses [4]. The room acoustics software which has been used for that purpose is the sound ray program SALREV [5,6,7].
In the following simulations, the receptor (i.e. the listener’s head) is a sphere of radius 0.25m. The frequency domain is divided in octave bands. And the time domain is discretized in equal intervals (not necessarily the same for each frequency band to account for different RIR lengths vs. frequency).
Moreover, the space domain is also discretized to compute the DRIRs. Indeed, the 3D space around the listener’s head is divided into a limited number (M) of finite solid angles Ωm, m = 1… M. The sound rays reaching the receiver are then collected in each solid angle, and their contributions are added to give the squared-pressure (Pa²) time-distribution or echogram for each direction of incidence.
With this technique, the computed echograms are affected by some statistical errors [5,6]. Increasing the number of sound rays generally decreases the statistical errors, but the precision is also discretization dependent (directional, time and frequency discretization).
Finally, the phase information is artificially introduced at the end of the sound ray algorithm [7], which leads to M directional room impulse responses hSR(m,t).
Compared to other modified ray tracing techniques, such as convolving directly each ray intersecting the receiver by the HRTF relative to the angle of incidence, this technique has the advantage of being both receptor orientation and reproduction system (eg. headphones, VBAP, WFS, …) independent.
2.2. Separate Calculation of the Direct Field and First Order Reflections by Ray Tracing
As previously mentioned the computation accuracy is limited. However, the precision on the direct component and first reflections is more critical than for the late reverberation.
Thus we suggest splitting the DRIR in equation (1) into two parts:
• The first, hSR1(θ,φ,t), includes the direct sound and the specular reflections up to a given order,
• The second, hSR2(θ,φ,t), comprises every other contributions (including diffuse reflections).
The hSR1(θ,φ,t) part is obtained by considering separately each ray that :
• Intercept the receptor
• And has a reflection order less than the maximum order
• And has not been subject to diffusion.
The ray is included in hSR1(θ,φ,t), taking into account attenuations (air absorption, geometrical attenuation and absorption of the surfaces encountered by the ray).
The direct contribution and first order reflections are obtained with a very good precision on directionality and arrival time, as with the mirror-images techniques.
The second contribution, hSR2(θ,φ,t) is computed by the discretization into finite extent solid angles at the receiver. This can now be performed with less spatial resolution, since the sharper directional contributions are included in hSR1.
The separate calculation technique has been preferred over the mirror-images to avoid performing the time consuming source-visibility test. As another advantage, the first reflections are computed on-the-fly, by the same ray-tracing algorithm that computes late reflections. Of course, a systematic search of all specular paths between the source and the receiver is not realized here, which means that a sufficient number of rays must be emitted by the source in order to take into account the more significant ones.
It can be observed that hSR1 is composed of several discrete components, each of them being specific of a well defined direction of incidence (the direction of the direct sound or the direction of a ray with reflection order less than the maximum).
With this method, a fine resolution for the localization of the direct sound and the first reflections is possible, while still affording some localization effects for the other contributions in an acceptable computing time.
Our program gives a number of echograms that still have to be converted in a way depending on the sound reproduction system. For example, if the receptor is divided into M solid angles and if we have obtained N separate first order reflections, how can they be converted to be used with a headphone or a VBAP with 6 loudspeakers? This question is addressed in the following points.
2.3. Usage with Headphones
For headphones auralization the sound contribution coming from a given direction of incidence (first reflections) or from a given solid angle (other contributions) must be convolved with the corresponding HRTF, which gives:
( ) ( )
( )
( )
∗ + ∗ ∗ ≅∑
∑
= = M m N n SR n l SR m l leftt st HRTF h mt HRTF h nt p 1 1 1 , 2 , , , (2)where HRTFl,m ≡ HRTF(left,θm,φm,t) and where hSR2(m,t) is the directional RIR integrated in the solid angle Ωm. The symbol * stands for the convolution product and the HRTF are assumed constant in each Ωm. The HRTF is here defined as the ratio of the sound pressure at the eardrum and the pressure that would exist at the same location in the absence of the listener’s head and torso. It is assumed that this function does not depend on the distance between the sound source and the listener: near-field effects cannot therefore be simulated with this method.
2.4. Usage with VBAP [2]
For VBAP auralization with K channels, we need the sound pressure pk(t) for each speaker k, k = 1,…,K. The direction of each solid angle and separate reflection is simulated by application of amplitude coefficients to their respective sound contribution. So the signal at the speaker k is given by:
( )
( )
⋅ + ⋅ ∗ =∑
∑
= = t n h coef t m h coef t s S SR N n n k M m SR m k k () , 1 , 1 , 1 2 , (3)where coefk,m = coef[k,θm,φm] is the panning coefficient for speaker k and direction θm, φm.
Proceedings of the 12th International Conference on Auditory Display, London, UK, June 20-23, 2006
3. RESULTS
3.1. The Test Room
Simulation has been carried out for example in a long disproportionate room, used by Hodgson in his early experiments on diffusion effects in room acoustics [8]. As seen on figure 2, the room is 110m long, 55m large and 5.5m height. The omnidirectional source is situated at x = 27.5m, y = 10m and z = 1.5m. In this example, a spherical receiver is placed at x = 27.5m, y = 20m and z = 1.75m. The receiver is partitioned into 26 solid angles, each of them subtending 45 degrees in θ and 45 degrees in φ, except the upside solid angle which is defined by θ < 22.5° and the downside one being defined by θ > 157.5°.
The absorption coefficient is the same for all walls and all frequency bands, i.e. α = 0.2. On the contrary, the diffusion coefficient increases as a function of frequency.
0 10 20 30 40 50 0 10 20 30 40 50 60 70 80 90 100 110 0 5 Y RoomB X Z Receiver Source
Figure 2. Test Room, 3D view.
3.2. Echograms
Figure 3 presents a directional echogram (“frontal” direction, see next paragraph for “frontal” definition) as computed in [1]. The direct contribution and first mirror-reflections are obtained in the same way as the late reverberation and all these parts are included in the figure.
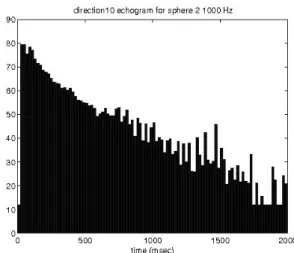
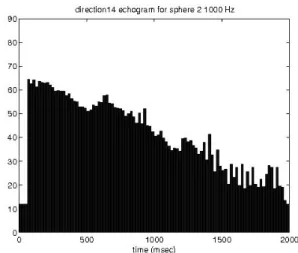
Figures 4, 5, 6 and 7 illustrate the diffuse and the late reverberation part of typical echograms for different octave bands and solid angles. The “frontal” direction is defined as the solid angle intercepting the horizontal plane passing through the center of the receiver and looking towards the source. The “right” direction is defined as the solid angle at azimuth 90° clockwise from the “frontal” direction.
These echograms have been obtained with 50 millions of rays. The time-discretization interval is 50 msec at 62.5 Hz and 20 msec at 1 kHz. These figures only show the late reverberation part of the echograms, i.e. the echograms without direct sound and first-orders mirror reflections.
Figure 3. Complete directional echogram (“frontal”
direction) computed as in [1].
Figure 4. Late reverberation part of the echograms for
octave band centered at 62.5 Hz and “frontal” direction (solid angle number 10).
Figure 5. Late reverberation part of the echogram for
octave band centered at 1 kHz and “frontal” direction.
Differences between figure 4 and 5 are explained by the diffusion property of the walls. For the frequency band centered at 62.5 Hz, there is no diffusion at all but diffusion exists for the 1 kHz centered band (diffusion coefficient = 0.6). When there is
Proceedings of the 12th International Conference on Auditory Display, London, UK, June 20-23, 2006
no diffusion (fig. 4), the contribution to the “frontal” echogram only comes from image sources which are grouped into well-defined planes perpendicular to OX. As these planes are significantly distant from one another, the contribution of their image sources are clearly separated in the echogram and this explains its structure in figure 4, which significantly deviates from an exponential decay.
During auralization, this particular structure produces in this direction, and at low frequencies, a clearly audible “amplitude modulated” reverberation tail, which could not have been reproduced with classical omnidirectional late reverberation algorithms.
When diffusion exists (fig. 5), rays can be reflected “backwards”, and this of course randomizes their arrival time, leading to a more classical nearly-exponential decay. In figure 5, it is also seen that the statistical accuracy of the echogram calculations decreases in the late part of the decay. This should be taken into account (for example, by slope averaging this late part) to avoid artifacts during auralization.
On figure 6, the structure of the echogram compared to figure 4 is modified, because the minimal length along OX (direction of the solid angle number 15) is shorter than along OY.
This simple example shows that it is interesting, for some particular virtual spaces, to reproduce the effects of directional RIRs, not only for the first-orders mirror sources, but also for the whole echogram. This particular room has of course been chosen intentionally for our demonstration, but it is expected that the quality of auralization will be more or less increased by this technique in most spaces where diffusion is not predominant, and particularly at low and medium frequencies.
Our future challenge is now to find an efficient way to modify the directional RIR for a moving listener and/or a moving source, especially in the case of real-time auralization.
Figure 6. Late reverberation part of the echogram for
octave band centered at 62.5 Hz and “right” direction (solid angle number 15).
Figure 7. Late reverberation part of the echogram for
octave band centered at 1kHz and “right” direction.
3.3. The CINEMA Research Project
CINEMA is a research project supported by the Walloon Region of Belgium under contract No 021/5392. The audio part of this project implementing the technique introduced in this paper will be exhibited at the conference in an interactive demo, for the visitors of our poster. This demonstration will use headphone-auralization to reproduce the virtual sound environment for a listener rotating head at a given position in the virtual space.
4. REFERENCES
[1] J.J. Embrechts, N. Werner, and S. Lesoinne, “Auralization in Room Acoustics using Directional Impulse Responses Computed by Sound Ray Techniques”, Forum Acusticum
2005, Budapest.
[2] L. Savioja, J. Huopaniemi, T. Lokki and R. Väänänen, “Creating Interactive Virtual Acoustic Environments”, J. Audio Eng. Soc. 47(9), 675-705, 1999.
[3] P. D. Henderson, “Directional Room Acoustics Measurement Using Large-Scale Microphone Arrays”, Preprint 115th AES convention preprint n° 5899, September 2003.
[4] M. Kleiner, B.-I. Dalenbäck and P. Svensson, “Auralization An overview”, J. Audio Eng. Soc. Vol. 41(11), 861-875, 1993.
[5] J.J. Embrechts, “Sound field distribution using randomly traced sound ray techniques,” Acustica, Vol. 51(6), 288-295, 1982.
[6] J.J. Embrechts, “Broad Spectrum diffusion model for room acoustics ray-tracing algorithms”, J. Acoust. Soc. Am., Vol 107(4), 2068-2081, 2000.
[7] D. Archambeau, “Realization of an Auralization software based on echograms calculated by a sound ray technique”,
Proc. 2nd Forum Acusticum and 137th meeting of the Acoust. Soc. America, Berlin, 1999.
[8] M.R. Hodgson, “Evidence of diffuse reflection in rooms”,