Published in Computer Methods in Biomechanics and Biomedical Engineering: Imaging & Visualization http://www.tandfonline.com/doi/abs/10.1080/21681163.2013.766070
DOI: 10.1080/21681163.2013.766070
Using merged kinematic and anatomical data to evaluate humeral
motion estimation: a pilot study
C. Schwartza, F. Leboeufb, O. Rémy-Nérisc,d,e, S. Brocharda,f, M. Lempereurc,f, V. Burdinc,d,e
a
Laboratory of Human Motion Analysis (LAMH), University of Liège, Liège, Belgium
b
Pôle médecine physique et de réadaptation, CHU Nantes, Nantes, France
c
LaTIM, Inserm U650, Brest, France
d
Institut Telecom, Telecom Bretagne, Technopôle Brest Iroise, France
e
Université Européenne de Bretagne, Rennes, France
f
Service de médecine physique et de réadaptation, CHU Brest, Brest, France
Abstract:
Optoelectronic systems are widely used in 3D motion capture. However, the reliability of the motion estimation depends on soft tissue artifacts and should therefore be validated. Two different sets of humeral markers were studied on four subjects. Anatomical and kinematic measurements were combined and the plausibility of the relative position of the bones in the glenohumeral joint during motion was evaluated using a new coherence index. Our findings show that an identical protocol leads to a large variability of the articular coherence for the subjects. However the use of an extra marker on the distal part of the humerus improves the humeral kinematics for three of the four subjects. Scientists and clinicians using 3D systems should remain aware of the influence of subject-specific morphology on the accuracy of the measure. Differences with a reference group may come from clinical reasons but also from measurement errors due to the inter-individual morphological differences.
Keywords:
2
Introduction
Optoelectronic systems are widely used for motion capture in biomechanics. The main source of errors arising from these systems is STA (Soft Tissue Artifacts) (Leardini et al., 2005). Signal post-processing (Söderkvist and Wedin, 1993; Chèze et al., 1995; Lu and O’Connor, 1999) and optimal marker placement (Schache et al., 2008) can limit these effects. Concerning the arm, markers placement has not been studied thoroughly but the most common approach is to place a cluster of markers at the middle of the arm (Cutti et al., 2004) in such way as to avoid both the biceps and elbow joint areas.
Several methods exist to evaluate and validate markers placement (Jerbi et al., 2012) including i) palpation of bony landmarks in several static positions (Brochard et al., 2009), ii) MRI (Magnetic Resonance Imaging) acquisitions (Sangeux et al., 2006) and iii) the use of bone pins (Karduna et al., 2001). Each method has advantages: non invasiveness (palpation, MRI), dynamic motion and accuracy (bone pins), but also drawbacks: static and lack of accuracy (palpation), static and limited range of motion (MRI), invasiveness (bone pins). An alternative approach is to consider both anatomical and kinematic data to obtain a dynamic and non invasive protocole. The joint coherence index proposed in (Schwartz et al. 2011) offers an indirect method to evaluate the plausibility of the motion estimation by measuring the evolution of the joint coherence, i.e. the interface between the articular surfaces.
The aim of the present paper is to evaluate two protocols for marker set placements on the arm that may be used to estimate the humeral motion. The quality of the motion estimation is estimated thanks to merged anatomical and kinematic data and the
3
analysis of the glenohumeral articular state. The present paper first describes the anatomical and kinematical acquisitions and how both are merged. Then, using a specific index, the glenohumeral joint state is evaluated and the two protocols for humeral motion estimations are compared.
Material and methods
The study was performed on the dominant arm of four healthy volunteers (23.8 ±1.9 years, 176 ±7 cm, 73.8, ±9.8 kg). Volunteers had no history of pain, trauma or surgery of the upper limb. The protocol was ratified by the local ethics committee.
Kinematic experimental setup
Scapula and humerus motion were measured using an opto-electronic tracking device (VICON, Oxford Metrics Ltd, Oxford, UK). Subjects performed a humeral elevation in the sagittal plane. The motion was guided by means of a board and its amplitude was standardized using graduations on the board (motion started at the 0° line and ended at the 180° line).
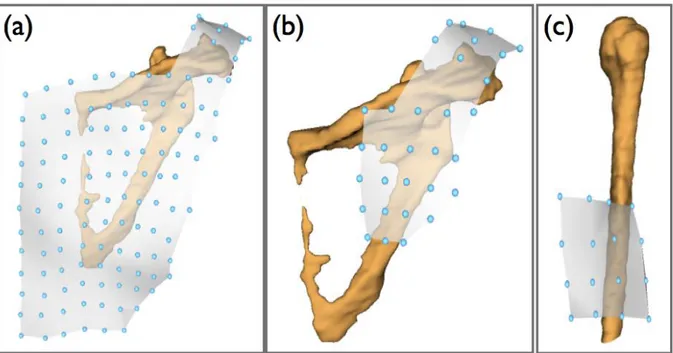
The estimation of the humerus kinematics was carried out using either a cluster of 16 markers at the middle of the humerus (midHumerusClust) (figure 1) or midHumerusClust plus a marker on the lateral epicondyle (fullHumerusClust). From a cluster of 120 markers covering the scapula entirely (fullScapulaClust), a sub-cluster, composed of the 31 markers lying on the acromion and the upper side of the posterior face of the scapula (acromialScapulaClust), was used to estimate scapular motion. Indeed this area of the
4
scapula has been shown to be less sensitive to STA (Brochard et al., 2011; Leboeuf et al., 2011). STA were further reduced using the Root Square Tracking algorithm (Jacq et al., 2010), which is a robust, simultaneous and multi-object extension of the classic algorithm of registration ICP (Iterative Closest Point) (Besl and McKay. 1992).
Figure 1 – Marker cluster configuration on the scapula and the humerus – (a) 120 markers covering the entire scapula (fullScapulaClust) and used for data fusion – (b) 31 markers covering the acromion and the upper lateral face of the scapula (acromialScapulaClust) and used to estimate scapular motion – (c) 16 markers placed on the middle of the arm (midHumerusClust).
Anatomical experimental setup
MRI acquisitions (0.87 x 0.80 x 0.87 mm3 volume resolution) of the scapula and the
humerus were performed. Bones surfaces were then obtained using the medical imaging software AMIRA 4.1.0 (Mercury Computer Systems, Inc, Chelmsford, MA, USA). In
5
addition, the anatomical center of the humeral head was geometrically estimated by fitting a quadric model on the humeral head surface (Allaire et al., 2007).
Kinematic and anatomical data fusion
The registration of the kinematic and anatomical data was performed using the surface markers. In this section, the ‘K’ and ‘A’ exponents respectively indicate clusters deriving from Kinematic or Anatomical acquisitions.
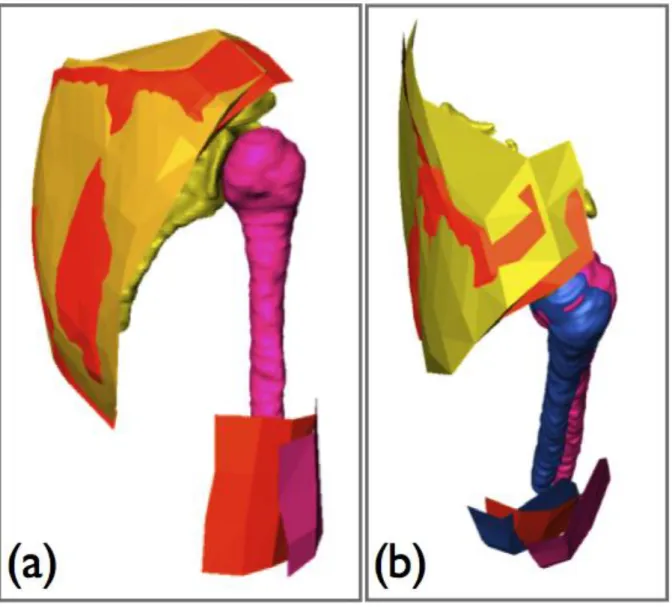
The registration procedure involves two main steps (figure 2): 1. anatomical and kinematic coordinate systems registration, 2. refined position of the humerus in the kinematic coordinates system.
1. AfullScapulaClust and KfullScapulaClust in the initial position were registered using ICPr, a robust form of the ICP algorithm (Ma et al., 2003). The obtained transformation was applied to the considered rigid set : humeral and scapular reconstruction and the associated AmidHumerusClust.
2. AmidHumerusClust and KmidHumerusClust were then registered with the same ICPr algorithm plus a constraint to ensure joint coherence. The constraint involved forcing AmidHumerusClust to rotate around the humeral head anatomical center. Indeed, without this constraint, STA may lead to collision or dislocation in the glenohumeral joint, as the subject cannot lie in the exact same position in both anatomical and kinematic acquisitions. The obtained transformation was then applied to the humeral MRI bone reconstruction.
6
Figure 2 – Registration process of the anatomical surfaces in the kinematics coordinate system – (a) registration of the AfullScapulaClust (yellow) on KfullScapulaClust (orange); same transformation is applied to the scapula (yellow), the humerus (pink) and the AmidHumerusClust (pink) – (b) constrained registration of AmidHumerusClust (pink) on KmidHumerusClust (orange); the registered humerus marker cluster and the resulting position of the humerus appear in blue.
Assessment of soft tissue artifact effect
Given that the subjects under study were healthy, no collision or dislocation in the glenohumeral joint should occur during motion. However, because of STA, such
7
situations may happen when the motion estimated from the kinematic measurement is directly applied to the bones reconstructed from the MRI acquisitions.
The evolution of the joint coherence quality was measured using the index proposed in (Schwartz et al., 2011). This index is based on the evaluation of the interactions in the joint in terms of distance between the articular surfaces and the area of the facing surfaces. An index value close to 1 indicates a good level of coherence, whereas an index value close to 0 reveals poor coherence in the joint. Therefore, even if the index does not indicate whether the bones are in their true positions, a poor index value reveals errors in motion estimation and therefore the limitations of the tested protocol. All results were expressed with reference to the position of the humerus relative to the graduated board.
To compare the influence of fullHumerusClust and midHumerusClust marker sets, the mean residue of the coherence index (CI) was computed:
Results
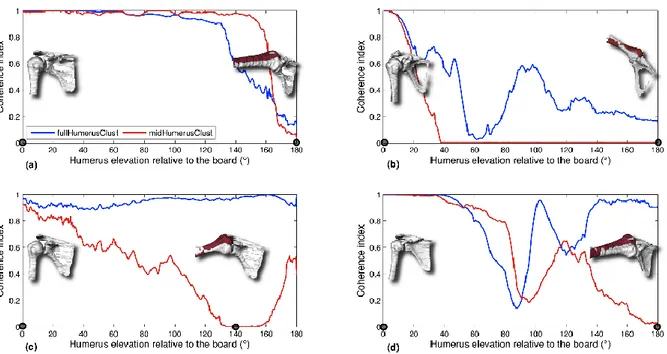
Figure 3 show separately the evaluation of the articular coherence index on the four subjects for fullHumerusClust and midHumerusClust. During the first 30 degrees of elevation, the index is similar for both marker sets. Using fullHumerusClust, all subjects but Subject 1 show a higher coherence index during the second part of the motion.
8
Subject 1 with midHumerusClust shows a better coherence index between 130° and 160° of humeral elevation. In this interval with fullHumerusClust, the index remains superior to 0.3, which shows a strong decrease but not a complete loss of coherence. Subject 4, and to a lesser extent Subject 2, show large variations in the index. This is typical of a temporary collision/dislocation of the bones.
Figure 3 – Coherence index of (a) subject 1, (b) subject 2, (c) subject 3, (d) subject 4 for both protocols:
fullHumerusClust (blue) and midHumerusClust (red). Visualization of the respective bones position is also
provided in 2 positions marked by black circles on the abscise axis. The position of the humerus estimated with
fullHumerusClust appears in white whereas the one estimated with midHumerusClust appears in red. The
elevation of the humerus corresponds to the graduation on the board used as a guide. 0° is the initial position and 180° is the most flexed position.
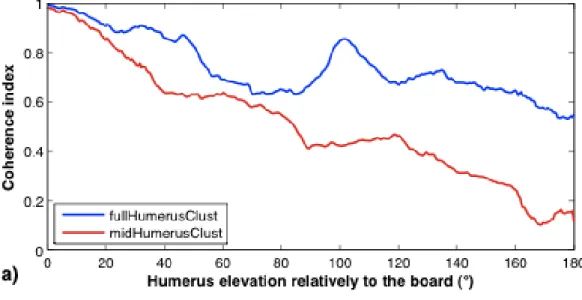
Figure 4 displays the mean indexes and the mean residue along the elevation. The mean residue increases progressively from 0 up to 0.4 (i.e. better coherence with
9
Figure 4 – a) Mean coherence index (4 subjects) for the two sets of markers (fullHumerusClust and
midHumerusClust) and b) Mean residue (and standard deviation) of the coherence index when comparing the two sets of markers. Values superior to 0 mean that the protocol using fullHumerusClust leads to a better estimation of motion.
10
Discussion
STA remain the main limitation for accurate motion analysis using skin markers. Although the biomechanical community has proposed several protocols to limit STA errors, these proposals are difficult to validate. The approach developed in this paper aims to evaluate the quality of the humeral motion estimation for two markers sets protocols.
Though the protocol was identical, each subject in our population shows a different course for the coherence index of the glenohumeral joint (figure 3). In Subject 2, both marker sets lead to collision, whereas in Subject 3 only the use of midHumerusClust leads to collision. These results emphasize that, even with an identical protocol, the relevance of motion estimation might differ from subject to subject and should therefore be carefully interpreted. Validation studies (Bourne et al., 2011; Brochard et al., 2010) usually only give information about the accuracy of a protocol for a whole population. Differences in subject morphologies may partly explain the observed variations. Further work should better define how to deal with these individual variations.
Despite individual differences, our study tends to demonstrate that adding a single marker at the extremity of the arm (fullHumerusClust) provides a better estimation of the arm motion (better estimation for 3 out of 4 subjects). The difference between the two protocols increases progressively with humeral elevation (figure 4). Cappozzo (Cappozzo et al., 1995) recommended placing the markers where relative motion is minimal. In the region of the lateral epicondyle, the amount of soft tissue is small, thus limiting inertial effects or deformation due to muscle contraction. However, skin located
11
at the elbow can sustain large deformations if the forearm is flexed. In this study, and as in most clinical in-plane tests, the subjects kept their elbow stable. Because of the limited size of our population, further studies are needed to confirm the present observations.
In addition to the motion acquisitions, the proposed method requires the acquisition of anatomical data, the segmentation of the structures of interest and their registration with the kinematic data. These extra-steps are a limitation of this approach. However, using patient-specific data is a current trend in the biomechanic community (Lenaerts et al., 2009).
Conclusion
The present study used merged anatomical and kinematic data to evaluate the relevance of motion estimations for the arm. The obtained results highlight the high variability of the motion estimation quality between the subjects. Moreover the results general trend, which should be confirmed on more subjects, tends to show that adding a marker at the distal end of the arm may improve the motion estimation. We prospect other imaging modalities as ultrasound or biplane radiographic systems in order to simplify the current work flow.
12
Acknowledgements
This work was supported by a grant of the Brittany Region (France). We also gratefully thank the Imaging unit of the Hôpital d’Instruction des Armées Clermont Tonnerre of Brest for their contribution to the MRI acquisitions.
Conflict of interest statement
We do not have any propriety, financial, professional or other personal interest of any nature in any product, service and/or company that could influence the position presented in this manuscript.
References
1. Allaire, S., Jacq, J.J., Burdin, V., Roux, C., 2007. Ellipsoid-Constrained Robust Fitting of Quadrics with Application to the 3D Morphological Characterization of Articular Surfaces. Proceedings of the 29th Annual International Conference of the IEEE Engineering in Medicine and Biology Society, France.
2. Besl, P. and McKay, N., 1992. A method for registration of 3-d shapes. IEEE Transactions On Pattern Analysis and Machine Intelligence, 14: 239-256.
3. Bourne, D.A., Choo, A.M., Regan, W.D., McIntyre, D.L., Oxland, T.R., 2011. The Placement of Skin Surface Markers for Non-Invasive Measurement of Scapular Kinematics Affects Accuracy and Reliability. Annals of biomedical engineering. 39, 777-785.
4. Brochard, S., Lempereur, M., Rémy-Néris, O., 2009. Scapular motion: does an acromion marker cluster decrease error measurement due to soft tissue artifact. Computer Methods in Biomechanics and Biomedical Engineering. 12, 61-62.
13
5. Brochard, S., Lempereur, M., Rémy-Néris, O., 2010. Double-calibration: An accurate, reliable, and easy-to-use method for 3D scapular motion analysis. Journal of Biomechanics. 44, 751-754.
6. Brochard S, Lempereur M., Rémy-Néris O., 2011. Accuracy and reliability of three methods of recording scapular motion using reflective skin markers, Journal of Engineering in Medicine. 225, 100-105.
7. Cappozzo, A., Catani, F., Della Croce, U., Leardini, A., 1995. Position and orientation in space of bones during movement: anatomical frame definition and determination. Clinical Biomechanics. 10, 171-178.
8. Chèze, L., Fregly, B.J., Dimnet, J., 1995. A solidification procedure to facilitate kinematic analyses based on video system data. Journal of Biomechanics. 28, 879-884.
9. Cutti, A.G., Paolini, G., Troncossi, M., Cappello, A., Davalli, A., 2004. Soft tissue artifact assessment in humeral axial rotation. Gait & Posture. 21, 341-349.
10. Jacq, J.J., Schwartz, C., Burdin V., Gérard, R., Lefèvre, C., Roux, C., Rémy-Néris, O., 2010. Building and tracking root shapes. IEEE transactions on BioMedical Engineering. 57, 696-707.
11. Jerbi, T., Burdin, V., Leboucher, J., Stindel, E., Roux, C., 2012. 2D-3D frequency registration using a low-dose radiographic system for knee motion estimation.
IEEE Transactions on Biomedical Engineering. DOI:
10.1109/TBME.2012.2188526
12. Karduna, A.R., McClure, P.W., Michener, L.A., Sennett, B., 2001. Dynamic measurements of three-dimensional scapular kinematics: a validation study. Journal of Biomechanical Engineering. 123, 184–190.
14
13. Leardini, A. Chiari, L., Della Croce, U. Cappozzo, A., 2005. Human movement analysis using stereophotogrammetry. Part 3: Soft tissue artifact assessment and compensation. Gait & Posture. 21, 212-225.
14. Leboeuf, F., Brochard, S., Lempereur, M., Schwartz, C., Rémy-Néris, O., 2011, Location of the best confident scapula cluster during a forward humeral elevation. International Society of Biomechanics conference, Brussels.
15. Lenaerts, G., Bartels, W., Gelaude, F., Mulier, M., Spaepen, A., Van der Perre, G., Jonkers, I., 2009, Subject-specific hip geometry and hip joint center location affects calculated contact forces at the hip during gait. Journal of Biomechanics. 42, 1246-1251.
16. Lu, T-W, O’Connor, JJ., 1999. Bone position estimation from skin marker co-ordinates using global optimisation with joint constraints. Journal of Biomechanics. 32, 129–134.
17. Ma, B., Ellis, R., Fleet, D., 2003. Robust registration for computer-integrated orthopedic surgery: Laboratory validation and clinical experience. Medical Image Analysis. 7, 237-250.
18. Sangeux, M., Marin, F., Charleux, F., Dürselen, L., Ho Ba Tho, M.-C., 2006. Quantification of the 3D relative movement of external marker sets vs. bones based on magnetic resonance imaging. Clinical Biomechanics. 21, 984-991. 19. Schache, A. G., Baker, R., Lamoreux, L. W. 2008. Influence of thigh cluster
configuration on the estimation of hip axial rotation. Gait & Posture. 27, 60-69. 20. Schwartz, C., Leboeuf, F., Rémy-Néris, O., Brochard, S., Lempereur, M., Burdin, V.
15
estimation. Computer Methods in Biomechanics & Biomedical Engineering. DOI: 10.1080/10255842.2011.613379 (in press).
21. Söderkvist, I. and Wedin, P. A., 1993. Determining the movements of the skeleton using well-configured markers. Journal of Biomechanics. 26, 1473-1477.