HAL Id: tel-01481900
https://pastel.archives-ouvertes.fr/tel-01481900
Cell Mechanics : Mechanical Properties and Membrane
Rupture Criteria
Lionel Guillou
To cite this version:
Lionel Guillou. Cell Mechanics : Mechanical Properties and Membrane Rupture Criteria. Biome-chanics [physics.med-ph]. Université Paris Saclay (COmUE), 2016. English. �NNT : 2016SACLX041�. �tel-01481900�
NNT : 2016SACLX041
T
HESE DE DOCTORAT
DE
L’U
NIVERSITE
P
ARIS
-S
ACLAY
PREPAREE A
L
’
ECOLE POLYTECHNIQUE
ECOLE DOCTORALE N° 573
Interfaces
Spécialité de doctorat: Physique
ParMr Lionel Guillou
Cell Mechanics:
Mechanical Properties and Criteria for Membrane Rupture
Thèse présentée et soutenue à l’Ecole Polytechnique, le 14 Septembre 2016 Composition du Jury :
Lenz, Martin Université Paris-Sud Rapporteur
Wagner, Christian Universität des Saarlandes Rapporteur Asnacios, Atef Université Paris-Diderot Examinateur
Hivroz, Claire Institut Curie Présidente du jury
SYNTHESE
L’athérosclérose est une maladie artérielle chronique qui est une des causes majeures d’accidents vasculaires cérébraux et de crises cardiaques. Cette thèse a pour objectif de mieux comprendre certains facteurs spécifiques impliqués dans le dévelopement de cette maladie en abordant cette problématique sous l’angle de la mécanique. L’athérosclérose se développe progressivement sur plusieurs décennies au cours desquelles l’artère se durcie progressivement. Son émergence est favorisée par la présence de cholestérol dans les artères, dont l’oxydation provoque une réaction inflammatoire des cellules endotheliales. Cette inflammation va attirer des leucocytes (globules blancs) qui vont s’attacher aux cellules endotheliales, puis transmigrer au travers d’elles. Les deux types de cellules qui jouent un rôle clef dans la genèse de l’athérosclérose sont donc les cellules endothéliales adhérentes et les leucocytes non-adhérents. Afin de savoir caractériser ces deux cellules actrices de l’athérosclérose, nous avons développé deux systèmes capables de mesurer leurs propriétés mécaniques.
Le premier, appelé “indentation de profil”, utilise des micropipettes et des microindenteurs pour indenter une cellule. On accède à la force en mesurant la flexion d’un microindenteur de rigidité connue, tandis que la profondeur d’indentation est accessible optiquement. Ces deux mesures sont ensuite reliées par un modèle mécanique, qui permet d’accèder aux propriétés mécaniques des cellules. Les cellules étant des matériaux viscoélastiques, deux paramètres au minimum sont nécessaires pour les caractériser. L’avantage de notre système réside dans le fait qu’il peut être utilisé indifférement sur des cellules adhérentes et non-adhérentes, et qu’il permet le placement d’une micropipette qui permet de modifier l’environnement, notamment chimique, des cellules dont on mesure les propriétés mécaniques. Toutefois, son inconvénient principal est qu’il ne permet qu’un débit de ~10
des cellules, nous accédons ainsi aux mêmes deux paramètres mécaniques qu’avec l’instrument précédent. L’avantage de cette technique est que le débit est maintenant beaucoup plus important, de l’ordre de ~106 cellules/heure.
De plus, nous nous sommes demandé, dans le contexte de l’athérosclérose, si la mécanique pouvait nous aider à comprendre quand les déformations des cellules, ou les contraintes exercées sur elles, pouvaient les endommager.
En effet, lorsque les plaques d’athérosclérose obstruent une partie trop grande du flux sanguin, le traitement le plus courant consiste à rouvrir le vaisseau avec un ballon et à le maintenir ouvert au moyen d’une endoprothèse artérielle, qui est un petit dispositif maillé et tubulaire. Cette procédure exerce des contraintes de compression considérables sur l’endothélium et l’endommage. Nous avons donc cherché à trouver un critère physique prédictif de la rupture de la membrane des cellules endothéliales en compression, puis avons comparé cela aux contraintes exercées sur l’endothélium durant la pose d’une endoprothèse artérielle. Nous trouvons que la contrainte de compression exercée durant la pose d’une endoprothèse artérielle, de l’ordre de ~100 kPa, est bien supérieure à la limite de rupture en compression d’une cellule endothéliale, de l’ordre de ~10 kPa. Des améliorations incrémentales de dispositifs d’endoprothèse artérielle existants ne seront donc pas suffisantes pour éviter d’endommager l’endothélium ; seules des innovations de rupture ou des changements de méthode pourraient résoudre cette limitation majeure de la prise en charge médicale actuelle.
Un autre scénario dans l’athérosclérose qui implique de larges déformations des cellules est la migration transendothéliale. Dans ce processus, les leucocytes créent un petit trou entre les cellules endothéliales dans lequel elles s’insèrent, puis ressortent, indemnes malgré cette extraordinaire déformation, de l’autre côté de l’endothélium. Nous avons donc cherché à comprendre quelles étaient les déformations maximales possibles des leucocytes sans qu’il y ait rupture. Nous avons distingué les cas, selon que ces déformations soient passives (comme lors du passage dans la microvasculature) ou actives (comme lors de la traversée de l’endothélium par les leucocytes). Dans le cas des déformations passives, nous trouvons que la membrane cellulaire casse quand l’extension de la surface membranaire dépasse les réserves exterieures de membranes cellulaires (soit typiquement ~40% de la surface initiale pour les lymphocytes T) contenues sous forme de plis et de petits picots appelés microvillosités. Les déformations actives
membrane de l’ordre de ~100 à 200%. Cela suggère que des réserves intérieures de membrane sont utilisées lors des déformations actives des lymphocytes T.
REMERCIEMENTS
Septembre 2016.
Il y a dix ans, presque jour pour jour, je faisais mes premiers pas sur le plateau. Après plusieurs années d'abscence, le retour en septembre 2013 m'a fait tout drôle. Loin d'un retour en arrière, ce fut en fait le début d'une nouvelle aventure, guidée par Abdul Barakat et Julien Husson, mes deux directeurs de thèse. C'est eux tout d'abord que je veux remercier ici. Abdul pour sa qualité d'écoute et ses encouragements constants, ainsi que ses conseils toujours avisés et son ouverture d'esprit. Julien pour son aide déterminante à tous les moments clés, nos discussions quotidiennes, et plus généralement pour m'avoir ouvert les portes de la mécanique cellulaire et des sciences expérimentales. Je vous remercie tous deux sincèrement de votre soutien. Je veux aussi saluer ici la Barakat-team pour avoir formé une équipe soudée qui s'entraide et permet à tout le monde de se sentir à l'aise. Outre Avin, Elizabeth, Brenna, Julie, Olga, Anna S., Carlo, ainsi que nos anciens (et pour certains futurs) membres, Gaëlle, David, Alexandra, Sidney, Valentin, Jowell, et Cécile (notamment pour m’avoir mis le pied à l’étrier avec FEBio), je veux temoigner de mon amitié à mes co-promotionnaire de doctorat, François et Johanne, avec qui j'ai partagé les hauts et les bas de la thèse, et surtout beaucoup de bons moments. J'associe à ces remerciements l'équipe d'Instent qui partage notre quotidien, et notamment ses membres de la première heure, Franz, Bruno, Myline et Pierluca, ainsi que Nathalie, avec qui nous partageons depuis longtemps une passion pour la biomécanique. Merci aussi au LadHyX pour sa bonne ambiance, et à Christophe de m'y avoir accueilli. Un baroud d'honneur tout d'abord pour l'équipe de Charles avec qui nous partageons les locaux et les bocaux, ainsi que nos broc d'eau à midi. Je pense à Raphaël, Sébastien, Benoit, Gabriel, Cyprien, Micaela, Irma, Caro F. et ses anciens, Nicolas, Rémi et Magali D. notamment. Puis au soutien administratif et technique, en les personnes de Tonio, Dany, Toai, Delphine, Sandrine, Thérèse et Magali T., sans qui le labo ne serait que chaos. Merci à l'équipe FootHyX pour de grands moments de défoulade, et à ses membres Guillaume, Ambre, Caro C., Christophe, Manu, Olga, J-Phi, Marine, PB, sans oublier son membre honoraire Eline. Merci également à Cyprien d'avoir partagé l'écrasante responsabilité de représentant des non-permanents avec moi (ainsi que pas mal de sessions piscine) et à Camille avec qui nous co-gérions les séminaires. Sans oublier tous ceux rencontrés au détour d'un café, d'un séminaire ou d'un magnan, et avec qui la discussion fut toujours un plaisir: Pascal, Lutz, Timothée, Mathieu, Gaetan, Yifan, Eunok, Ana R. et bien d’autres. Je souhaite également remercier Emmanuel D. de ses conseils, notamment sur
l'indentation, et les membres du LMS avec qui nous partageons notre oxygène, en particulier Jean-Marc et Jean-Séb.
J'en profite pour remercier plus particulièrement tous mes autres co-bureaux (en plus de Jean-Séb) au cours de ma thèse, des premiers, Loïc et Anders, puis Sébastien un peu plus tard, qui m'ont montré les ficelles du métier et m'ont fait sentir tout de suite au chez moi, à Raphaël et Anna S., mes co-bureaux actuels, pour leur bonne humeur et leur simplicité. Enfin je remercie les responsables et ingénieurs du cours sur les hydroliennes que j'ai eu le plaisir d'enseigner, Alex, Ali, William, pour m'avoir fait confiance et m'avoir soutenu dans toutes mes propositions.
Une partie de ma thèse très stimulante fut effectuée au laboratoire de Sanjay Kumar à Berkeley, que je tiens à remercier avec toute son équipe pour leur sens de l'accueil. Je pense à George et Joanna surtout, pour leur chaleur et leur énergie, avec qui travailler est toujours un plaisir. Je remercie égalément mes autres collaborateurs durant ma thèse, et en particulier David, Claire et Stéphanie pour m'avoir beaucoup appris et toujours avec le sourire.
Je remercie enfin mon jury de thèse. Mes rapporteurs d'abord, Martin Lenz et Christian Wagner, pour leurs lectures attentives et leurs remarques éclairées. Les membres de mon jury ensuite, Claire Hivroz et Atef Ascnacios pour leur présence et les intéressants échanges scientifiques que nous avons eu le jour de la soutenance. A tous, je souhaite bon vent, et espère que nous resterons en contact.
Pour finir, je remercie ma famille et mes amis, et au premier chef grand-parents, parents, frère et soeurs, cousins et cousines, d'avoir eu la patience de m'écouter expliquer à quoi mes travaux pouvaient servir et l'indulgence de ne pas répondre. Merci à ma femme, Patricia, à qui je dédie ce manuscrit. Merci de me pousser, même quand je ne vais nulle part. Merci d'y croire quand je n'y crois plus.
TABLE OF CONTENTS
Introduction
Chapter 1. Mechanical properties of adherent and immobilized non-adherent cells
Chapter 2. Mechanical properties of non-adherent cells in suspension
Chapter 3. Membrane rupture criterion for adherent cells
Chapter 4. Membrane rupture criterion for non-adherent cells
Conclusions
Perspectives
INTRODUCTION
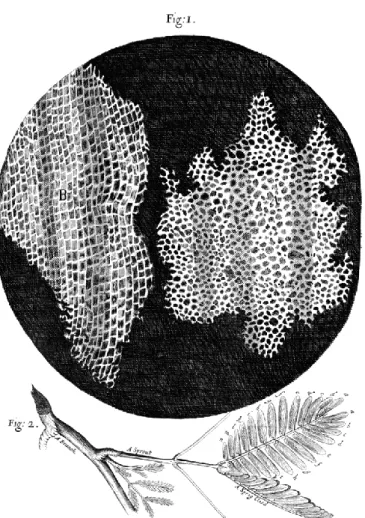
“As the extension, so the force.” It is by these words that Robert Hooke first explained the principles of linear elasticity, which he discovered in 1660. Only five years later, the same Hooke, from observations on cork (Figure I.1) using the newly invented optical microscope, would go on to discover the existence of cells (Hooke, 1665).
FIGURE I.1: Micrograph of cells in a cork, drawn by Robert Hooke in
“Micrographia” (1665). (A) Transverse section. (B) Longitudinal section. (Public domain)
Indeed, many experimental observations over the past three decades have shown that mechanical inputs from the environment directly affect cellular behavior. For instance, shear stress due to blood flow affects endothelial cell shape and permeability (Malek and Izumo, 1996), and regions of disturbed arterial blood flow are prone to the development of atherosclerotic plaques (Ku et al., 1985). If we now consider the substrate on which the cells adhere, the stiffness of the extracellular matrix has been shown to affect cell migration (Ulrich et al., 2009), and perhaps even more crucially, to direct the lineage differentiation of stem cells (Engler et al., 2006). These observations, and others, have led to the emergence of a new field of study whose purpose is to understand how cells convert mechanical signals into biological and chemical activity, a process termed mechanotransduction (Huang et al., 2004).
In turn, the state of a cell is often reflected in its mechanical properties. This realization has been one of the key motivations for trying to measure those properties. Importantly, multiple diseases, from diabetes (McMillan et al., 1978) and leukemia (Rosenbluth et al., 2006) to breast cancer (Li et al., 2008), have been shown to lead to significant changes in cellular mechanical properties. It is therefore natural that in recent years, the idea to use these mechanical properties as a label-free biomarker for disease state has emerged. Moreover, the concomitant advent of microfluidics and informatics has put the high-throughput and automated measurement of cellular mechanical properties within reach, rendering possible a new generation of diagnostic tools based on cell population mechanical “signature” (Gossett et al., 2012; Mietke et al., 2015; Otto et al., 2015).
Our work focuses on cell mechanics in the context of atherosclerosis. Our main motivation in doing so is that atherosclerosis is the leading cause of mortality in the developed world, due to complications such as myocardial infarction and stroke (Beckman et al., 2002). Atherosclerosis is a disease that develops in humans over decades and in which the arterial wall progressively thickens. It is promoted by the presence of excessively high levels of low-density lipoprotein (LDL) in the arterial wall, due to either genetic causes or lifestyle. The oxidation of the lipids contained in LDL marks the beginning of atherosclerosis (Berliner et al., 1995). These oxidized lipids trigger an inflammatory response from endothelial cells, which attracts leukocytes (white blood cells) that are responsible for carrying out the immune
which in turn triggers further thickening of the arterial wall (Rudijanto, 2007). In its final stages, the atherosclerotic plaque may cause vessel occlusion, either because it has become too thick or because the plaque ruptures and leads to the formation of a thrombus (blood clot) (Verstraete, 1990).
A rather unique feature of studying cell mechanics in the context of atherosclerosis is that both adherent (endothelial cells) and non-adherent (leukocytes) cells are involved. In Chapter 1, we present a novel technique, which we term “profile microindentation”, that is able to measure the mechanical properties of both adherent and non-adherent cells (Figure I.2), provided that the latter are maintained in place using a micropipette (Guillou et al., 2016).
FIGURE I.2: “Profile microindentation” of an adherent (left) and non-adherent
(right) cell. See Chapter 1 for explanation.
However, in the bloodstream, leukocytes are in suspension and not held in place. Therefore, being able to measure the mechanical properties of cells in suspension might provide a more accurate characterization of their mechanical properties. In Chapter 2, we present a microfluidic device that is able to achieve this (Figure I.3). Additionally, this device is able to detect subtle alterations in cell mechanical properties and thus opens the door to applications in the clinical setting where the mechanical “signature” of cell populations could potentially be used in the future to establish a medical diagnosis.
FIGURE I.3: Mechanical properties of cells in suspension are measured using a
microfluidic device. See Chapter 2 for explanation.
Beyond using mechanical properties to characterize the state of a cell, we wondered if mechanics could also help us understand when deformations undergone by cells, or stresses exerted on them, could become harmful.
If we look at the late stages of atherosclerosis, this question can be posed in particular with regards to medical procedures. Indeed, at the point of advanced disease, the plaque becomes so large that it significantly reduces blood flow, and medical intervention becomes necessary to reopen the vessel. To this end, a catheter is introduced into the patient’s radial or femoral artery and pushed through the vasculature to the site of the atherosclerotic plaque. There, a balloon is inflated to dilate the vessel walls. Often, a wired mesh called a stent is deployed at the same time to help maintain the vessel walls dilated (Cook et al., 2007; Jennings et al., 2014). While stent deployment is clearly beneficial to the patient, it has been shown to lead to substantial endothelial cell damage (Rogers et al., 1999), which greatly increases the risks of thrombosis (Wu, M.D and Thiagarajan, M.D, 1996), a major cause of stroke and myocardial infarction. Because both the balloon catheter and the stent exert large forces on the endothelium, we hypothesized that these forces are responsible for the endothelial damage that is observed. In Chapter 3, we quantify the threshold of compressive force that leads to endothelial cell damage (Figure I.4)
FIGURE I.4: Endothelial cell membrane ruptures at a critical compressive stress.
The bar represents 10 µm. See Chapter 3 for explanation.
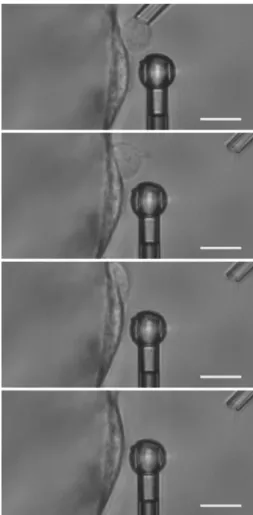
Turning to the early stages of atherosclerosis, we now focus on leukocytes. Indeed, we saw previously that during the development of the atherosclerotic plaque, T lymphocytes migrate across the endothelium due to the increased expression of adhesion molecules and inflammatory mediators by endothelial cells (Carman and Springer, 2004; Carman, 2009; Grivel et al., 2011). This process requires leukocytes to deform dramatically to squeeze between endothelial cells (Figure I.5). Yet, despite the dramatic deformations and the membrane surface area increases required, there is no evidence, to our knowledge, of this process leading to membrane rupture in vivo. In Chapter 4, we therefore seek to understand how much leukocytes are able to deform before their membrane ruptures. Furthermore, we contrast situations of passive deformation, such as when cells pass through narrow vessels in the microvasculature, with situations of active deformation, such as during transendothelial migration.
FIGURE I.5: Time-lapse of a lymphoblast (a type of leukocyte) migrating across an
endothelium. The bar represents 10 µm. Images are taken every 15 seconds. See Chapter 4 for explanation.
CHAPTER 1
Mechanical properties of adherent and immobilized
non-adherent cells
1.1 INTRODUCTION
In atherosclerosis, both adherent (endothelial cells) and non-adherent (leukocytes) cells are involved. In this chapter, we present a novel technique, which we term “profile microindentation”, that is able to measure the mechanical properties of both types of cells.
This technique was described in an article (Guillou et al., Scientific Reports 6, article number 21259, 2016, doi: 10.1038/srep21529), which we reproduce in section 1.2. In this work, we measure and discuss the mechanical properties of bovine aortic endothelial cells and show that we can track these properties over time as we modify the biochemical environment of the endothelial cell using another micropipette.
Further, in the supplementary material of this article, which we present in section 1.3, we show how this technique can be used to measure the mechanical properties of non-adherent cells maintained using a micropipette and present our results on CD4+ T lymphocytes.
The micropipette used to modify the biochemical environment can be used to place another cell in contact with the endothelial cell whose stiffness is measured. Hence, we use the “profile microindentation” setup to investigate the mechanics of transendothelial migration, a process central to the development of atherosclerosis. While this method does not allow us to obtain a sufficiently high throughput, we present our preliminary results in section 1.4.
1.2 DYNAMIC MONITORING OF CELL MECHANICAL PROPERTIES USING PROFILE MICROINDENTATION
Lionel Guillou, Avin Babataheri, Pierre-Henri Puech, Abdul I. Barakat, Julien Husson
Abstract
We have developed a simple and relatively inexpensive system to visualize adherent cells in profile while measuring their mechanical properties using microindentation. The setup allows simultaneous control of cell microenvironment by introducing a micropipette for the delivery of soluble factors or other cell types. We validate this technique against atomic force microscopy measurements and, as a proof of concept, measure the viscoelastic properties of vascular endothelial cells in terms of an apparent stiffness and a dimensionless parameter that describes stress relaxation. Furthermore, we use this technique to monitor the time evolution of these mechanical properties as the cells’ actin is depolymerized using cytochalasin-D.
Introduction
In cells, the cytoskeleton is a key determinant of mechanical properties. Therefore, biological processes that involve extensive cytoskeletal remodeling such as cell division, differentiation, and migration have been shown to be associated with changes in cell mechanical properties (Gossett et al., 2012; Otto et al., 2015). Cell responses to chemical and biophysical cues in their microenvironment also often lead to structural changes that impact mechanical properties (Wang and Doerschuk, 2000; Discher et al., 2005; Trepat et al., 2007; Mitrossilis et al., 2009; Harris and Charras, 2011). For instance, during inflammation, leukocyte-endothelial cell interactions affect the mechanical properties of both cell types, which can in turn affect transmigration (Wang and Doerschuk, 2000; Wang et al., 2001). There is, therefore, great interest in measuring the evolution of cell mechanical properties over time as a way of monitoring structural and functional changes that cells undergo during key biological processes. Furthermore, mechanical forces play a key role in the development of major diseases. For instance, the mechanical properties of tissues contribute in some cases to cancer progression and may also affect treatment outcome (Butcher et al., 2009).
Several techniques have been developed to probe cell mechanical behavior. These include micropipette aspiration(Sato et al., 1990; Hochmuth, 2000), atomic force microscopy (AFM) (Rotsch et al., 1997; Sato et al., 2000; Alcaraz et al., 2003; Mahaffy et al., 2004; Chaudhuri et al., 2009; Raman et al., 2011; Cartagena and Raman, 2014), micro-plates (Thoumine and Ott, 1997; Desprat et al., 2005), optical tweezers (Laurent et al., 2002; Yanai et al., 2004), magnetic twisting cytometry (Fabry et al., 2001; Laurent et al., 2002), particle tracking (Yamada et al., 2000; Tseng et al., 2002), and microfluidic cell stretchers (Gossett et al., 2012; Otto et al., 2015). These various techniques have been used to probe either local (cortex, cytoplasm, etc.) or whole-cell mechanical properties at different spatial and time scales.
In this paper, we introduce profile microindentation (PM) as a simple and minimally disruptive method for assessing viscoelastic properties at a single-cell level. PM involves using a microindenter to indent a cell while using brightfield imaging from profile both to visualize the cell and to determine the deflection of the
bovine aortic endothelial cells (BAECs) and measured the evolution of their mechanical properties over a period of more than 30 minutes. A limitation that this technique shares with many other systems that probe cell mechanical behavior is its relatively low throughput.
Methods
Endothelial cell culture
BAECs were kindly provided by A.-C. Vion and C. Boulanger and used between passages 4 and 12. The cells were cultured at 37 °C and 5% CO2 in Dulbecco’s
Modified Eagle’s medium (DMEM, Invitrogen, Carlsbad, CA, USA) supplemented with 10% fetal bovine serum (Invitrogen) and 1% penicillin/streptomycin (Invitrogen). The cells were passaged two to three times a week and re-suspended in fresh culture medium. One to two days before each experiment, the cells were trypsinized with trypLE (Invitrogen) and grown on Cytodex-3 dextran microcarrier beads (average bead size 175 µm, GE Healthcare Life Sciences, Velizy-Villacoublay, France). For the experiments, about 50 Cytodex-3 beads without cells were deposited onto the bottom of a thin-bottom petri dish (standard bottom µ-Dish 35 mm low, IBIDI, Martinsried, Germany or FluoroDish 35 mm, World Precision Instruments, Hitchin, UK) in phosphate buffered saline (PBS; Invitrogen). The PBS was then removed and ~10,000 trypsinized BAECs were introduced into the petri dish.
Human umbilical vein endothelial cells (HUVECs) for the profile microindentation experiments were kindly provided by A. Chipont, and originally purchased from PromoCell (PromoCell GmbH, Heidelberg, Germany). The cells were cultured at 37 °C and 5% CO2 in endothelial cell growth medium (ECGM)
procured from ZenBio (ZenBio, Research Triangle Park, North Carolina, USA). The protocol for depositing on Cytodex-3 beads differed from that used for BAECs in that after mixing cells and beads and letting them rest in the incubator for 30 min in a 2 mL eppendorf tube (Eppendorf France SAS, Montesson, France), the tube was placed for 3 hours on a rotating plate turning at 50 rpm and heated at 37°C to ensure optimal coverage of the beads. HUVECs used for the AFM experiments were obtained from PromoCell (ref. C-12203) and cultured according to the supplier’s guidelines using ECGM-2 medium (ref. C-22011). Trypsin / EDTA was used for cell passaging.
While most experiments were performed at room temperature, we verified that our method could also be employed at physiological temperature (see supplementary discussion). In some experiments, cells were exposed to cytochalasin-D (Sigma-Aldrich, Taufkirchen, Germany) either by incubation or by “whiffing” the drug onto cells with a micropipette.
Microscope setup
In all microindentation experiments, the petri dish containing cells on Cytodex-3 beads was mounted on a TE300 inverted microscope (Nikon Instruments, Tokyo, Japan) placed on an air suspension table (CVI Melles Griot, Netherlands). The microscope was equipped with a 100x oil immersion, 1.3 NA objective (Nikon Instruments) for experiment monitoring and lower magnification objectives (40x, 20x, 10x, and 4x, Nikon) for micropipette positioning. Images were acquired using a Flash 4.0 CMOS camera (Hamamatsu Photonics, Hamamatsu City, Japan) controlled using the software LabVIEW (National Instruments, Austin, TX, USA). We will provide the LabVIEW codes upon request.The experiments were performed using either brightfield or fluorescence microscopy. Supplementary movie S1 online shows a demonstration video of profile microindentation.
Micropipette and microindenter fabrication
Borosilicate glass capillaries (1 mm OD, 0.78 mm ID, Harvard Apparatus, Holliston, MA, USA) were pulled on a P-97 micropipette puller (Sutter Instruments, Novato, CA, USA). To fabricate the micropipettes, an MF-900 microforge (Narishige, Tokyo, Japan) was used to cut the extremity of pulled capillaries to the desired diameter, ranging from ~4 to 50 µm. The diameter was assessed optically using calibrated graduations in the microscope’s ocular. The micropipettes were then bent at a 45° angle (for the micropipette holding the Cytodex-3 bead) or a 60° angle (for the micropipette “whiffing” the drug) so that their extremities had the desired direction in the microscope’s plane of view. To fabricate a microindenter, an MF-200 microforge (World Precision Instruments) was used to melt glass at the tip of the micropipette. During fabrication, using graduations in the microscope’s ocular, we aimed for indenter tips that were 5 to 10 µm in diameter. The size was then precisely determined under the inverted microscope using the 100x objective. The microindenter’s bending stiffness was evaluated against standard microindenters that had been previously calibrated. The standard microindenters were calibrated by measuring their deflection under the gravitational force exerted on their tip by a
a 45° angle (different angle from the micropipette bending). One micropipette was used to hold Cytodex-3 beads, while the other one was used to “whiff” the drug onto the cell. A piezoelectric controller (TPZ001, Thorlabs, Newton, NJ, USA) along with a strain gauge reader (TSG001, Thorlabs) were used to control the microindenter. Because profile microindentation requires only a single-axis piezoelectric, a micromanipulator (or two if another micropipette is introduced), a camera able to acquire images at 30 Hz, and a high magnification objective, it is a technique that is relatively low-cost and simple to implement.
Actin visualization
To visualize intracellular actin filaments in living cells, BAECs were transfected with the live-cell actin marker LifeAct. A day before transfection, cells were plated on a 35 mm-diameter FluoroDish (World Precision Instruments) at densities that led to 50-80% confluence the following day. For transfection, cells were incubated at 37 °C in a mixture of 200 µL cell culture medium, 2 µg LifeAct DNA (pIRES-LifeAct-GFP-puro3, IBIDI), and 8 µL GeneCellin (DNA Transfection Reagent, BioCellChallenge, Signes, France) for a period of 24 h. The cells were then washed with new medium before imaging. For fluorescence excitation, an Intensilight (C-HGFIE, Nikon) lamp with GFP illumination was used.
Single-cell profile microindentation
Culturing cells on Cytodex-3 beads allowed us to image the cells in profile, which permitted visualization of cell deformation upon indentation. Cells were indented above the nucleus. During cell indentation, the Cytodex-3 bead was held in place using a micropipette with an aspiration pressure as shown in Figure 1.1. Using the piezoelectric controller, we applied a known displacement z to the base of the glass microindenter, with the piezoelectric controller moving at a constant speed v. We monitored the position d of the microindenter’s spherical tip using an algorithm running in real-time in LabVIEW that cross-correlated the brightness profile of the current image with the brightness profile of the initial image before indentation, as already used by Husson et al. (Husson et al., 2009) and Laan et al. (Laan et al., 2008). This correlation was performed over a rectangular region of interest, and brightness was averaged over 4 pixels. Because we fit an entire region rather than a single pixel, our spatial resolution is smaller than the pixel size (60 nm/px at 100x magnification). Including the effect of ambient noise, we found that the standard deviation on the position of an indenter at rest was typically 30-40 nm. Contact between the microindenter and the cell was indicated by an increase in the indenter’s deflection (d-z) compared to its initial value before any piezoelectric controller movement (d –
(deformation ~deflection / length ~0.01), the applied force F was linearly related to the deflection through the indenter’s stiffness F = kind [(d - z) – (d0 – z0)]. We
continued the indentation until we reached a previously selected threshold force Fthreshold.
FIGURE 1.1: Experimental setup for profile microindentation. (a) Schematic (not
drawn to scale) of the experimental setup used for profile microindentation. Microindenter is used to exert force on the endothelial cell adherent at the equator of the Cytodex-3 bead. (b) Microindenter before (left) and during (right) cell indentation. Scale bar is 10 µm. (c) Photograph of fluorescein “whiffed” by the micropipette on the Cytodex-3 bead in order to visualize the convection cone coming out of the micropipette. Scale bar is 10 µm.
We recorded the tip’s position dmax (typically 1 to 2 µm indentation, which is
approximately 20% of the cell thickness above the nucleus) at this point in time and then used a feedback loop to adjust in real-time the displacement z imposed by the piezoelectric controller to maintain that position constant as the cell relaxed. Thus, after the approach phase, the strain was maintained constant throughout the relaxation phase. We let the cell relax for at least 10 s before retracting the indenter.
37°C. Cells were indented with a JPK Nanowizard 1 AFM (JPK Instruments), using the force mode with a closed loop 15 µm range piezo. The AFM sits on an Axiovert 200 microscope equipped with a Colibri 2 diode illumination system (Zeiss, Oberkochen, Germany) and a CoolSnap HQ2 camera (Photometrics, Tucson, AZ, USA). A glass sphere of diameter 10 µm was glued by micromanipulation (using a homemade micropipette/biomembrane force probe setup) to a gold-coated triangle-shaped MLCT cantilever (Bruker Instruments, Billerica, MA, USA), using UV polymerizable glue (Dymax OP-29) in order to measure cell mechanics on similar scales as in the microindentation experiments. The decorated AFM cantilever was calibrated in situ prior to the experiments using the thermal noise method implemented in the JPK SPM control software and found to be 11.5 nN/µm, compatible with the nominal data provided by the manufacturer (10 nN/µm). The approach and retract speeds of the indenter were 1 µm/s over a distance of 5 µm and the maximal applied force was set between 3 and 6 nN. The acquisition frequency was set at 1024 Hz.
Data and statistical analysis
Raw data acquired by LabVIEW were analyzed using a custom-written code in MATLAB (The MathWorks, Natick, MA, USA). We will provide the code upon request. AFM data were processed using JPK DP software (JPK Instruments) using built-in fitting procedures. Statistical comparisons between two groups were performed using the two-tailed Student t-test. Tests were unpaired unless otherwise noted. Statistical comparisons among three groups or more were performed using a one-way ANOVA test. Statistical comparisons between slopes were performed using an ANOCOVA test. Samples were deemed statistically significantly different for p < 0.05.
Results
Precision of displacement and force measurement in profile microindentation
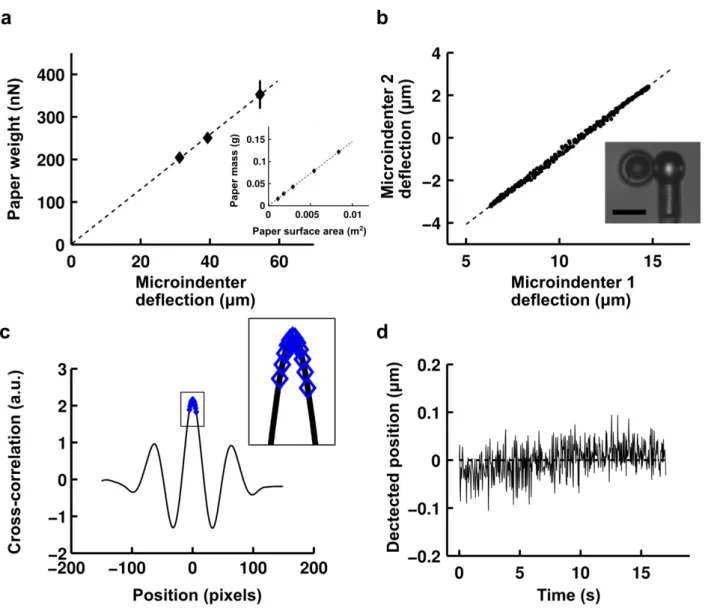
The first step in the microindentation experiments is to calibrate the microindenters. We first determined precisely the density of a type of paper by measuring the mass of pieces of this paper whose surface area was then measured under the microscope (Figure 1.2). We then calibrated reference microindenters by measuring their deflection under known weights of pieces of paper. The results demonstrated that we remain in the linear elastic regime for the range of deformations tested. Microindenters used in the experiments were calibrated against the reference
(Figure 1.2). The ratio of the deflections of the two microindenters directly provides the ratio of their rigidities.
To measure the position of the microindenters during profile microindentation, we acquire a profile of the light intensity on a line along the axis of indentation at a frequency of ~30 Hz. This intensity profile is compared using cross-correlation against a template profile for the image of the indenter. A parabolic fit over 10 pixels is then used to find the maximum of the cross-correlation curve (Figure 1.2), giving the position of the indenter.
At a magnification of 100x, the size of a pixel is ~60 nm. However, the parabolic fit used here allows sub-pixel resolution. Including the noise in the environment and at an acquisition frequency of ~30 Hz, we find on a typical day that we are able to determine the position of the indenter with a precision of half a pixel, or about ~30 nm (Figure 1.2). For a typical indenter of rigidity 5-10 nN/µm, this translates to a precision in force of 0.1-0.3 nN.
FIGURE 1.2: Profile microindentation calibration and noise level. (a) To calibrate a
reference microindenter, its deflection under the weight of pieces of dry paper of known mass is measured. Data are mean ± s.e.m. Papers adhere to the tip by dipping the tip in oil. The inset shows how paper density was ascertained by measuring the masses of pieces of paper whose surface areas were then measured under the microscope. (b) Microindenters used in the experiments were calibrated against reference microindenters by measuring the ratio of their deflections when pushed against one another. Scale bar is 10 µm. (c) A profile of the light intensity was measured on a line along the axis of indentation, and a template profile for the image of the indenter on that line indenter shaft was taken. A parabolic fit over 10 pixels (blue diamonds, see inset) was used to find the maximum of the cross-correlation curve, giving the position with sub-pixel resolution (~30 nm, see panel d). (d) The position of the indenter was measured at rest over a period of ~15 s, comparable to the time of stress relaxation experiments performed, to evaluate the combined error stemming from noise in the environment and measurement error. At an acquisition frequency of ~30 Hz, the standard deviation of the position is 32 nm in the
Profile microindentation gives similar apparent stiffness values to Atomic Force Microscopy
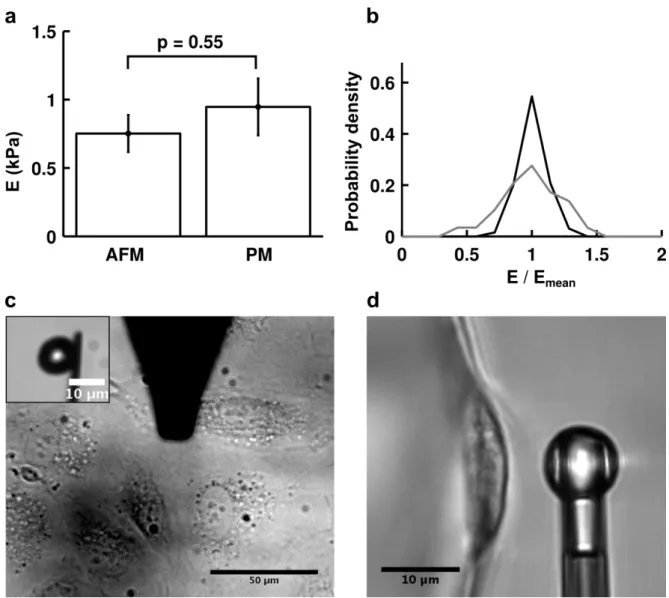
We compared the apparent stiffness of HUVECs measured using profile microindentation to that obtained via AFM, as this latter method is widely used to measure cell mechanical properties (Rotsch et al., 1997; Sato et al., 2000; Alcaraz et al., 2003; Mahaffy et al., 2004; Chaudhuri et al., 2009; Raman et al., 2011; Cartagena and Raman, 2014). In both cases, we used an approach speed of 1 µm/s, a spherical indenter of radius 5 µm, indented on top of the nucleus and fit the entire force-deformation curve using a Hertzian model (assuming a Poisson’s ratio of 0.5, see next paragraph for details). The threshold forces for indentation were in the same range, with 3-6 nN for AFM and 5 nN for profile microindentation, and so were the indenter rigidities, with respective values of 11.5 nN/µm and 5.0 nN/µm. The measurements were made at temperatures of ~37°C in both cases. The substrate was the main difference between the two setups. While HUVECs adhered to glass in the AFM experiment, they adhered to Cytodex-3 dextran beads in the profile microindentation experiment. However, with respective rigidities of ~70 GPa and ~50 kPa, both glass and dextran beads are much stiffer than cells, and previous investigators have shown that while substrate stiffness matters greatly when its rigidity is comparable to that of the cell, this is no longer the case when substrate stiffness is very high compared to the cell (Tee et al., 2011). Indeed, the measured apparent stiffnesses were found to be similar using the two different methods (0.75±0.14 kPa for AFM vs. 0.95±0.21 kPa for profile microindentation; p=0.55) (Figure 1.3). Such a comparison validates the profile microindentation technique and positions it as a low-cost complementary approach to more conventional AFM colloidal indentation systems.
The repeatability of the measurements of apparent stiffness was also assessed under these experimental conditions by investigating how the apparent stiffness varied for a given cell during several consecutive measurements. The dispersion of the measurements was found to be about twice as high for profile microindentation compared to AFM, as the standard deviation for the normalized apparent stiffness
FIGURE 1.3: Comparison of apparent stiffness obtained by AFM and profile
microindentation. (a) The difference between the two means is not statistically significant (p=0.55; two-tailed Student’s t-test). Data are mean ± s.e.m. n = 5 cells for AFM and n = 10 cells for profile microindentation. (b) Probability density for the measure of the apparent stiffness of a given cell normalized by the mean apparent stiffness found for that cell. Black is for AFM and grey for profile microindentation. The same cells as in panel a are used. (c) Top view of AFM measurement of HUVEC rigidity. (Inset) Side view of the spherical probe glued to the tip used in the AFM measurement. (d) Side view of profile microindentation measurement of HUVEC rigidity.
In profile microindentation stress relaxation experiments, cell mechanical properties can be described by two independent parameters: an apparent stiffness E* and a dimensionless relaxation parameter α.
1. The apparent stiffness E*
We first assess the cell rigidity by focusing on the approach phase of the indentation. The force-indentation curve of an adherent cell indented by a spherical indenter is well described by the classical Hertz equation (Johnson, 1985):
2 3 2 1 * 3 4 R E F (1)
where F is the force, E* the apparent stiffness ( 2
1 *
E
E , with E the Young’s
modulus and υ the Poisson’s ratio), R an effective radius which is a function of the indenter’s radius Rprobe and the cell apical surface radius of curvature Rcell (R=1/(1/
Rprobe+1/ Rcell)), and δ the indentation depth. In our case, the contact position dc must
be determined in order to assess indentation; therefore, we obtained E*, dc and )
( 0 0
0 k d z
F ind through a fit of the following equation:
2 3 2 1 0 * (( )) 3 4 ) ( c dc d ind d z F E R d d k (2) where 0 0 0 1 c c dc d d d if d d if
The characteristic function ddc is used to take into account the pre-contact case in
which no force is applied on the cell. An example of such a fit for a BAEC can be seen in Figure 1.4 and provides the first mechanical parameter: the apparent stiffness E* of the cell. We estimate the quality of the fit by evaluating the square root of the mean of the L2-norm of residuals between the fit and the experimental data. We obtain a value in the example given of 0.14 nN, which is of the same order of magnitude as our precision in force.
FIGURE 1.4: BAEC stress relaxation can be described using only two independent
mechanical parameters: the apparent stiffness E* and the relaxation parameter α. (a) Example of raw data extracted from cross-correlation image analysis. We obtain the indentation (d – dc) (black curve) and the deflection (d – z) – (d0 – z0) (grey curve). t =
0 s marks the beginning of the indentation (left arrow). By multiplying the deflection by the indenter’s rigidity kind (nN/µm), we find the applied force F (nN). After the
chosen force Fthreshold is attained (right arrow), we maintain the indentation constant,
ensuring constant strain during force relaxation. (b) Example force-indentation curve fitted with a single parameter: the apparent stiffness E*. In this example, approach speed is 1.4 µm/s. Data acquisition frequency is approximately 30 Hz. The inset represents a histogram of the apparent stiffness E* of BAECs (n = 20 cells and N = 139 indentation curves) measured with a microindenter whose base is moving at 1.4 µm/s, fitting the first 1.0 µm of the force-indentation curve. (c) Scatter plot of A/(R1/2dmax3/2) as a function of E*, where A is the pre-factor in the force relaxation as
given by equation (3), R is the effective radius given by R = 1/(1/ Rprobe+1/ Rcell) with
Rcell ~ 20 µm, dmax is the indentation maintained during relaxation, and E* is the
(correlation coefficient r = 0.95) shows that A and E* are inter-dependent variables, both measuring a cell’s apparent stiffness. (d) Example force-time relaxation curve at fixed indentation. Cell relaxation is observed over 80 s. Time is normalized by t0 = 1 s.
Force is normalized by its maximum value attained at the first time point.
In our data analysis protocol, we perform the fitting of the force-indentation curve twice: a first time to get an approximate contact point dcapp, and a second time
where we fit only the data where d [dcapp–2 µm; dcapp+1 µm]. For an indentation
speed of 1.4 µm/s, we find E* = 1.8 ± 0.086 kPa (mean ± s.e.m.) (Figure 1.4), in line with values found in the literature (Satcher and Dewey, 1996; Hochmuth, 2000; Mathur et al., 2001; Pesen and Hoh, 2005; Sato et al., 2007). To obtain the Young’s modulus, one can assume a Poisson’s ratio of 0.5 (Sato et al., 1990; Nijenhuis et al., 2014), corresponding to an incompressible medium, which is best suited when modeling the cell as a homogeneous isotropic medium during moderate indentations. Here, “moderate indentations” denotes indentations in which the applied pressure Papp is small compared to the osmotic pressure Posm of isotonic saline
which acts to maintain cell volume constant (Hochmuth, 2000).
In support of this notion, during indentations with a Papp on the order of 1 kPa
(close to our experimental values, see Figure 1.4 with Papp ~force / contact area ~7
nN/15 µm2 ~0.5 kPa) observed with a confocal microscope, Harris and Charras
reported no volume change (Harris and Charras, 2011) (see supplementary discussion for a more detailed discussion of appropriate values of Poisson’s ratio depending on the experiment).
An advantage of the profile microindentation technique is the ability to readily determine the apparent stiffness of adherent cells. To do so, we hold the non-adherent cell with a micropipette. To showcase this capability, we measured the mechanical properties of human primary T lymphocyte CD4 cells (Supplementary Material, Figure 1.10).
(corresponding to ~1 s since data acquisition frequency is ~30 Hz), which are due to our feedback loop that attempts to maintain the position constant.
We note that A is an extensive property. By analogy with the Hertz equation, we normalize A by R1/2dmax3/2 to make it an intensive property in order to compare it
with the apparent stiffness E* found previously. We find that A and E* are nearly proportional to one another (Figure 1.4). This was observed to be true for ~200 indentations performed on ~50 cells at three different approach speeds (1.4 µm/s, 2.8 µm/s and 14 µm/s), using two different indenters, and with and without incubation in cytochalasin-D (a drug that depolymerizes actin filaments and renders cells softer). This indicates that A and E* are inter-dependent variables; henceforth, we choose to retain E*.
The apparent stiffness E* is indentation depth-dependent, while the relaxation parameter α is not.
In order to test the dependence of the apparent stiffness E* on the indentation length scale, we fitted identical force-indentation curves on intervals of increasing lengths, from d [d0–2 µm; d0+0.3 µm] to d [d0–2 µm; d0+1.5 µm], with the function
described in equation (2). For each force-indentation curve, the values obtained for the apparent stiffness E* were normalized by those obtained when using the smallest interval [d0–2 µm; d0+0.3 µm] (Figure 1.5). We find that the cell’s apparent stiffness
FIGURE 1.5: Effect of indentation depth on measured cell mechanical properties. (a)
Apparent stiffness E* (mean: grey diamonds and S.E.M.: grey bars) of BAECs as a function of the indentation depth used for fitting the data (n = 20 cells). For each curve, E* was normalized by its value at an indentation depth of 0.3 µm. Also shown
is the apparent stiffness E* obtained by fitting an analytical force-indentation curve taken from Dimitriadis’ formula that accounts for cell depth (dotted black line) (Dimitriadis et al., 2002). The unique fitting parameter, the apparent stiffness E*, was chosen to match experimental data at an indentation depth of 0.3 µm. Data are mean ± s.e.m. (b) Relaxation parameter α as a function of indentation depth. Each point
(grey diamond) represents an indentation (n = 20 cells with 7 indentations each). Curves were separated into 3 groups sorted according to indentation depth. The x
axis represents a group’s mean indentation depth. Each group is represented as a violin boxplot (median: black line). A one-way ANOVA with the null hypothesis that
all samples are drawn from the same population gives a p-value of 0.86.
To test the hypothesis that this increase is due to the effect of the substrate, as has been previously observed (Yu et al., 1990; Saha and Nix, 2002), we fitted equation (2) for varying intervals to a theoretical force-indentation curve obtained using the following equation proposed by Dimitriadis et al. that accounts for substrate effects at small depths for an incompressible bonded substrate (Dimitriadis et al., 2002):
) 0048 . 0 386 . 0 781 . 0 884 . 0 1 ( * 3 4 12 32 2 3 4 E R F (4)
parameter does not depend on length scale, as has been reported elsewhere using oscillating beads (Fabry et al., 2001) or creep relaxation (Desprat et al., 2005).
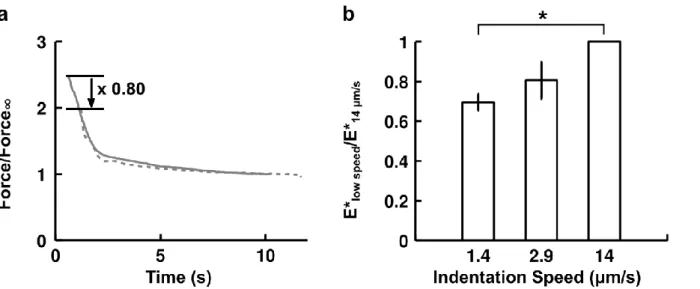
The apparent stiffness E* depends on indentation speed through the duration of the indentation
To test the dependence of our mechanical parameters E* and α on indentation speed, we compared the relaxation profiles at the two indenter speeds of 1.4 and 14 µm/s (Figure 1.6). Each force relaxation curve, obtained at a fixed indentation, was renormalized by its value after 10 s of relaxation. All the curves at a given speed were then averaged. When the reference time t = 0 s is taken to be the beginning of the indentation, we find rather good agreement between the two averaged relaxation curves, which collapse on a master curve. It thus follows, as can be seen in Figure 1.6, that the slower the indentation, the longer a cell will have to relax and hence the softer it will appear.
FIGURE 1.6: Effect of indentation speed on force relaxation and apparent stiffness.
(a) Average force relaxation curve at fixed indentation for fast (n = 13 cells, grey line, indentation speed 14 µm/s) and slow (n = 20 cells, dotted grey line, indentation speed 1.4 µm/s) indentations. Force is normalized by its value after 10 s of relaxation for each cell. Time on the x axis starts at the beginning of indentation. (b) Comparison of cells’ apparent stiffness as a function of indentation speed. For each cell, its apparent stiffness at low speed was normalized by its value at 14 µm/s. Data are mean ± s.e.m. n = 5 cells for 1.4 µm/s and n = 3 cells for 2.9 µm/s. The p-value from a paired two-tailed Student’s t-test with the null hypothesis being that the ratio is equal to 1 is significant for 1.4 µm/s (p = 0.002) but not for 2.9 µm/s (p = 0.171). An indentation speed of 2.9 µm/s means that the full indentation will last approximately ~1 s.
Tracking the evolution of cell mechanical properties upon “whiffing” a drug onto a cell
Because we measure cell mechanical properties in ~10 s, we are able to repeat that measurement to determine how the mechanical properties of a particular cell evolve in response to an external stimulus applied locally to that cell. To demonstrate this capability, we used a micropipette to “whiff” cytochalasin-D onto a BAEC, as depicted in Figure 1.1. The mean “whiffing” fluid velocity is ~10 cm/s; thus, cytochalasin-D convection dominates diffusion (characteristic convection time τconvection ~10-3 s << τdiffusion ~10 s; see supplementary discussion for details). We
performed measurements of mechanical properties every 30 s for a period of ~40 min. We compared our “whiffing” experiment to two other cases: a control case with no “whiffing” to verify that the mechanical measurements were not disruptive to the cell, and a case where the cells were continuously incubated in cytochalasin-D to see how effective “whiffing” a drug at a given concentration is compared to a more standard incubation protocol.
FIGURE 1.7: Impact of cytochalasin-D on BAEC mechanical properties. (a) Time
evolution of BAEC apparent stiffness E*. E* is normalized by its value at t = 0 min E*0.
The indentation speed is 1.4 µm/s. Thick black line is control (n = 7 cells), grey dotted line is for cells incubated in cytochalasin-D at 500 nM starting at t = 5 min (n = 9 cells), and thin black line is for cells that were “whiffed” with cytochalasin-D at 500 nM starting at t = 5 min (n = 5 cells). Large black pentagram positioned at t = 20 min represents a separate experiment where control cells’ apparent stiffness, E*control (n =
13 cells), was compared to that of cells incubated for 15 min in cytochalasin-D at 1000 nM, E*cyto-D (n = 18 cells). The y-coordinate of the pentagram is E*cyto-D/E*control. (b)
Time evolution of BAEC relaxation parameter α. The same notation as in panel a is used. (c) Time derivative of data in panel a: left column is control case, middle column represents cells incubated in cytochalasin-D, right column represents cells “whiffed” with cytochalasin-D. Data are mean ± s.e.m. Slopes in panel a were compared using the ANOCOVA test. *** indicates p < 0.001. (d) Time derivative of data in panel b. Data are mean ± s.e.m. The same notation as in panel c is used.
As can be seen in Figure 1.7, the cell’s apparent stiffness E* decreases by ~50-70% over the duration of the experiment, in line with values found in the literature (Wu et al., 1998). In addition to becoming softer upon initial indentation, the cell also relaxes faster, as indicated by a 2-3 fold increase in the relaxation parameter α over the duration of the experiment. Performing repeated indentations provides the advantage of directly observing the kinetics of a drug’s activity on the cell. Here, we see that the rates of both the decrease in apparent stiffness and the increase in the relaxation parameter are relatively constant in time.
To compare cytochalasin-D action kinetics quantitatively, we compared the slopes of the time evolution of the mechanical properties using an ANOCOVA test. This allows greater statistical robustness (p < 0.001, see Figure 1.7) than comparing cases at selected time points, thus partially overcoming the drawback of this technique’s low throughput. We find that, while the mechanical properties barely change in the control case, they evolve dramatically and qualitatively similarly in the two other cases. We note that with our choice of indentation duration (~1 s), the normalized apparent stiffness decreases nearly proportionally to the fluidization of the cell, as we have in all three cases |d(α/α0)/dt| ~2 |d(E*/E*0)/dt|.
FIGURE 1.8: Effect of cytochalasin-D on BAEC actin filaments. (a) Control
(untreated) BAEC. (b) Same cell as in panel a after incubation for 120 min in cytochalasin-D at 1000 nM. Note actin filament bundles being disrupted at various
filaments progressively depolymerize and form small bundles (bead-like structures in Figure 1.8).
Beyond simply “whiffing” a drug onto a cell, the second micropipette used for injecting cytochalasin-D above can also be used to bring in another cell and study cell-cell interactions and the effects of these interactions on mechanical properties. To demonstrate this capability, we used a micropipette to place human lymphoblast cells on human aortic endothelial cells (HAEC) and observed in profile view as the lymphoblast migrated on the endothelial cell surface (Supplementary Material Figure 1.11), all the while measuring the mechanical properties of the endothelial cell (data not shown).
Discussion
The scale-free power law found using profile microindentation is analogous to the one identified in creep relaxation and bead oscillation experiments. Indeed, the power-law behavior observed here has previously been reported, notably in creep relaxation (Desprat et al., 2005) and in bead oscillation experiments where several orders of magnitude of frequencies were sampled (Fabry et al., 2001). Following a calculation performed by Balland et al. (Balland et al., 2006), we show in what follows that although our experiment is performed at constant strain rather than constant stress and in the time domain rather than the frequency domain, these approaches are equivalent.
By analogy with our stress relaxation function F(t) A(t/t0) , we introduce
the creep relaxation function (t) B(t/t1) (strain evolution under constant stress)
for an elastic body with identical mechanical properties. Following some mathematical derivations (see supplementary discussion for details), we find that
and ) 1 )( 1 ( 1 B A ( B 1
for 0 1), where Γ is the Euler function.
Thus, the power-law exponent we find for our constant strain experiment can be compared to previous work reported in the literature for creep relaxation and bead oscillations experiments simply by changing the sign.
The current results also show that the pre-factor A in the stress relaxation law ) / ( ) (t A t t0
F and the apparent stiffness E* measured during the cell indentation
ramp-up are inter-dependent (Figure 1.4); therefore, E* and the relaxation parameter α are sufficient to describe cell indentation and subsequent relaxation.
In order to fit the force-indentation curve during the approach phase, we have used a non-adhesive contact model because the lack of measurable negative force
not surprising because the ions present in the medium (DMEM) screen electrostatic interactions. The medium is further supplemented with 10% serum, and hence contains a large amount of bovine serum albumin (BSA), which has a well-known anti-adhesive effect. The non-adhesive contact assumption, however, is not expected to be valid after contact has been made during the retraction phase where, for example, an adhesive force Fad = 0.14 Fmax (Fmax is the maximum force) is measured for
the BAECs in the inset of Figure 1.4b. In this case, we can use the resulting adhesion energy per unit surface area defined as γ=-Fad/(3πRprobe)=13 µN/m to compute the
dimensionless parameter λ proposed by Maugis (Maugis, 1992) 170 ~ ) 3 9 16 ( ) * 4 9 ( 0 3 / 1 2 h E Rprobe
, where h0 is the equilibrium separation between the
surfaces, typically taken to be 0.4 nm for solids. Because λ >> 5, the Johnson-Kendall-Roberts (JKR) model would apply during the retraction phase (not treated here).
Further, we observe that cell relaxation curves are self-similar if we consider the beginning of indentation as the initial point. In our cell indentation experiments, cell relaxation appeared independent of indentation speed (from 1.4 to 14 µm/s) and exhibited a self-similar behavior when the beginning of indentation was taken as the initial time point, i.e. t = 0 s (Figure 1.6). This means that if one sets the origin of time for relaxation not at the beginning of relaxation per se but rather at the moment where mechanical energy is injected into the system, the force relaxation curves of two groups of cells (n = 20 cells and n = 13 cells) indented at very different speeds (1.4 µm/s and 14 µm/s respectively) collapse on a master curve. This finding suggests that cell relaxation is driven by the time at which an external energy input initializes the system. We therefore propose that this time point is more relevant to study cell relaxation than the beginning of cell relaxation, which corresponds to the end of the indentation phase.
Finally, by performing 10 second-long profile microindentations every 30 s for more than 30 min, we were able to monitor the viscoelastic properties of endothelial cells almost continuously for an extended period of time (Figure 1.7). In the control case, cell viscoelastic properties remained nearly constant over a period of time longer than 30 min (Figure 1.7), indicating that the measurement technique itself is
Cusachs et al., 2006)). Consistent with these previous studies, we find that adherent endothelial cells’ apparent stiffness E* decreases over time (Figure 1.7), and that the absolute value of their relaxation parameter α (α has a negative sign) increases over time (Figure 1.7). Indeed, as discussed in (Fabry et al., 2001), a value of the relaxation parameter α close to 0 indicates solid-like behavior, while a value closer to -1 (and therefore with an increased absolute value) indicates fluid-like behavior (to compare to the quantity termed x in the cited work, one needs to recognize that 1 x). Further, we observe that at a given concentration, cytochalasin-D affects a cell’s mechanical properties in a near-continuous fashion. Finally, we note that at indentation speeds of ~1 s, the reduction in normalized apparent stiffness goes together with the fluidization of the cell, suggesting the same origin for both mechanical properties, presumably here the cytoskeleton as it is the primary component of the cell affected by cytochalasin-D (Figure 1.8).
These results demonstrate our ability to “whiff” a drug, in this case cytochalasin-D, at a well defined location and at selected time points and to simultaneously use profile microindentation to monitor the evolution of a cell’s viscoelastic properties.
Conclusion
We demonstrate the ability of the profile microindentation technique to measure mechanical properties of both adherent and non-adherent cells. Using our profile microindentation technique, we show that an adherent cell’s indentation and relaxation under constant strain can be characterized using only two mechanical parameters, the apparent stiffness E* and a relaxation parameter α. While the apparent stiffness E* depends on both indentation depth and speed, the relaxation parameter α is scale-free and is identical (with a minus sign) to the exponent in a weak power-law describing force relaxation found by other investigators using, for instance, bead oscillation (Fabry et al., 2001) or creep relaxation (Desprat et al., 2005) experiments. The apparent stiffness measured using profile microindentation matches that found using AFM, validating the approach.
Importantly, the profile microindentation technique offers the capability of easily adding a micropipette to the setup, which gives us the ability to test drugs by “whiffing” them onto a cell, at a controlled location and time, without introducing mechanical perturbation of the setup stability which is often challenging in AFM experiments. This makes this technique well suited to investigate the effect of a convective flux on a single-cell, to determine for instance if drug intake kinetics are impacted by fluid velocity when a drug is administered via convection-enhanced
bring another cell in contact with the cell whose mechanical properties are being measured and thus explore the effect of cell-cell contact on cell mechanics.
Author contributions
A. I. B. and J. H. designed research; L. G. and J. H. performed profile microindentations; P.-H. P. performed atomic force microscopy experiments and analyzed AFM data; A. B. provided technical support; L. G. analyzed data; all authors wrote the paper.
Acknowledgments
The authors gratefully acknowledge Julie Lafaurie-Janvore for introducing them to the plasmid transfection technique for live actin imaging. The authors acknowledge Claire Hivroz and her team at the Curie Institute (Paris, France), in particular Michael Saitakis and Stephanie Dogniaux, for kindly providing the human lymphoblast cells and the human T lymphocyte CD4 cells. The authors acknowledge Delphine L’Huillier, Caroline Foubert, Caroline Frot, Daniel Guy, Antoine Garcia, and Do Chi Toai Vu for technical support. This work was supported by a permanent endowment in cardiovascular cellular engineering from the AXA Research Fund. Lionel Guillou is supported by a Gaspard Monge fellowship from the Ecole Polytechnique. P.-H. Puech is supported by Prise de Risques CNRS, ANR JCJC “DissecTion” (ANR-0909-JCJC-0091), PhysCancer “H+-cancer”, Labex INFORM (ANR-11-LABX-0054) and the A*MIDEX project (ANR-11-IDEX-0001-02) funded by the “Investissements d’Avenir” French government program managed by the French National Research Agency (ANR) (to Inserm U1067 laboratory).
1.3 SUPPLEMENTARY MATERIAL
Equivalence between time and frequency domain and between creep and relaxation experiments
In the linear elastic regime, stress and strain are related as follows:
' ) ' ( ) ' ( ) ( ) ( 0 0 K t t t dt t K t t (1)
where σ is the stress, t the time, K the stress relaxation function at fixed strain, ε0 the
strain at t=0, and the strain rate. This translates in the Laplace domain to
) ( ~ ) ( ~ ) ( ~ s s K s s (2)
where the tilde denotes the Laplace transform. For a sinusoidal excitation
jwt
e w t) ( )
(
(with w the pulsation), we have jwt
e w t) ( )
(
and the complex viscoelastic modulus G is defined by G(w) (w) (w). In our experiment,
) / ( ) (t A t t0
K , which translates in the Laplace domain to ) ( ) 1 ( ) ( ~ 0 st s A s K , where Γ
is the Euler function and (1 ) exp ( x)xdx
0
. Comparing to the result obtained for the creep function J(t) B(t/t1) in Balland et al. (Balland et al., 2006), we
conclude that: (3) and ) 1 )( 1 ( 1 B A ( B 1 for 0 1) (4)
Equation (3) implies that the power-law exponent for a constant strain experiment is the opposite of that of creep function experiments and oscillating bead trapping (Desprat et al., 2005). We note that according to Fabry et al. (Fabry et al., 2001), the exponent α provides access to the loss tangent η at low frequencies (η = απ/2), which in turn provides access to the loss modulus, knowing the storage modulus (by definition, η = G’’/G’, where G’’ is the loss modulus and G’ the storage modulus).