To cite this document: Sarron, Vanessa and Robert, Éric and Fontane, Jérôme and Darny,
Thibault and Riès, Delphine and Dozias, Sébastien and Joly, Laurent and Pouvesle,
Jean-Michel Plasma plume length characterization. (2013) In: 21st International Symposium
on Plasma Chemistry - ISPC, 04 August 2013 - 09 August 2013 (Cairns, Australia).
O
pen
A
rchive
T
oulouse
A
rchive
O
uverte (
OATAO
)
OATAO is an open access repository that collects the work of Toulouse researchers and
makes it freely available over the web where possible.
This is an author-deposited version published in:
http://oatao.univ-toulouse.fr/
Eprints ID: 10661
Any correspondence concerning this service should be sent to the repository
administrator:
[email protected]
Plasma plume length characterization
V. Sarron1, E. Robert1, J. Fontane2, T. Darny1, D. Riès1, S. Dozias1, L. Joly2and J.M. Pouvesle1 1
GREMI, UMR 7344, Université d’Orléans/CNRS, BP 6744, 45067 Orléans cedex 2, France 2
Université de Toulouse, ISAE, Département d’Aérodynamique, Énergétique et Propulsion (DAEP), France
Abstract: In this paper, neon and helium plume length, generated by a plasma gun (PG) are studied.
The combination of ICCD imaging, Schlieren visualization and Pitot glass probe allow to characterize the strong influence of the plasma on rare gas flow. Beyond the shifting of the transition from laminar to turbulent, a plasma induced channeling of turbulent flow is achieved. Finally, the benefit of using a capillary for plasma propagation before in-air expansion is evidenced through the generation of long plumes in ambient air at low flow rates.
Keywords: plasma jets, PAPS, atmospheric pressure, Schlieren visualization, Pitot glass probe
1. Introduction
Since few years, applications of cold atmospheric pressure plasma jets have increased in plasma medicine and other fields. Plasma treatments are realized by the plasma plume, i.e. the plasma developing at the outlet of the discharge reactor flushed with rare gas expanding in the ambient air. Plasma plume length and gas jet physics are coupled as already mentioned in literature [1-3]. Plasma plume length depends on several parameters such as pulse width, applied voltage, and also the gas flow. The plasma gun developed at GREMI, generates Pulsed Atmospheric pressure Plasma Streams (PAPS), which travel in long and flexible capillaries [4]. The benefit of a long capillary to facilitate treatments is discussed in this paper.
2. Experimental setup
The plasma gun is based on a dielectric barrier discharge. An inner hollow electrode (1 mm inner diameter) is inserted in a borosilicate capillary, 4 mm inner diameter, 1 mm thick. Around this capillary is placed an outer electrode connected to the ground. The inner electrode is
powered by a high voltage pulse with a rise time of 20 ns (ns driver) or 2 µs (µs driver), as illustrated in fig. 1. The applied peak voltage is ranging from 10 kV to 25 kV, positive or negative polarity, with a pulse repetition rate ranging from single shot to 10 kHz.
Time integrated, 10 µs exposure, ICCD PiMax3 camera was used to measure plasma plume length. Gas jet characteristics have been studied by Schlieren visualization and by flow pressure measurements using a glass Pitot probe (0.5 mm outer diameter).
3. Plasma plume regimes
As already mentioned in literature [1], an increase of the gas flow should increase the plasma plume length until a critical value. The fig. 2 illustrates the evolution of the plasma plume for increasing neon flow rates and two capillary lengths. The plasma gun is powered by the ns driver. When the plasma propagates in a 5 cm long capillary before expanding in air, the plume has a conical shape for flow rates up to 1000 sccm, threshold above which the plume gets troubled (fig. 2a)). Whereas, when PAPS propagates in a 15 cm long capillary, the plasma plume observed at the outlet keeps having a conical shape, even at high flow rates (fig. 2b)).
Fig. 2: Evolution of a neon plasma plume as a
function of gas flow rate.
Fig. 1: a) Plasma Gun setup. The right-hand side
inset is a schematic description of plasma plume
length measurements; Typical voltage waveform for a
ns driver (b) and µs driver (c)
Surprisingly, these regimes can be modified by the pulse repetition rate applied to the plasma gun. The fig. 3 illustrates the influence of the pulse repetition rate on the plume length, for both short and long length capillaries length. These experiments have been realized with the µs driver. For the short length capillary (Lcap = 5 cm), at 200 Hz the evolution is equivalent to the one observed at the same repetition with the ns driver (fig. 2c)). At 200 Hz, the maximal plume length is obtained for a flow rate of 700 sccm. Karakas et al. [1] have obtained an equivalent evolution of the plasma plume generated by the plasma pencil at 5000 Hz, which is not the case for the plasma plume generated by the plasma gun. Conversely, in our case, at 2000 Hz, the plasma plume length increases linearly with the flow rate.
Fig. 3: Evolution of a neon plasma plume length as
a function of gas flow rate and pulse repetition rate.
The plasma plume generated at the nozzle of a 15 cm long capillary continuously increases with the gas flow rate at 200 Hz and even at 2000 Hz. The longest plume obtained with a 5 cm long capillary is 15 mm, and 33 mm with a 15 cm long capillary. Even if high repetition rate allows an increase of plasma plume, it will be more enhanced if a long capillary is used. The combined increase of both gas flow and pulse repetition rates allows for a substantial increase of the plasma plume length.
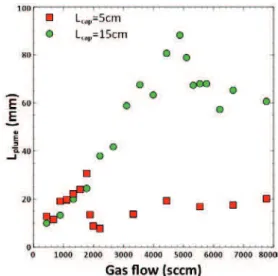
Same experiments have been realized in helium with the plasma gun also powered by the µs driver. The evolution of a helium plasma plume as a function of gas flow and capillary length is illustrated in fig. 4. As well as for neon, with a 5 cm long capillary, two plasma plume regimes are observed: conical and troubled. The transition between these regimes occurs around 2000 sccm, whereas it is 700 sccm in the case of neon. It can be noticed that the transition occurs for the two gases for a Reynolds number around 100. In this case, the helium plume maximal length is 30 mm. For a 15 cm capillary, the plasma plume length continuously increases up to 90 mm with the gas flow rate, and keeps conical up to ~5000 sccm. For higher flow rates, the plume gets troubled and its length decreases.
Fig. 4: Evolution of a helium plasma plume length
as a function of gas flow rate. Plasma gun is
powered by the µs driver at 2000 Hz.
As we use higher gas flow rate than in neon, we could obtain longer plume. Nevertheless, differences between neon and helium could also be induced by the gas properties such as dynamic viscosity, or the plasma. In a first approximation, plasma plumes seems to be constrained by the topology of the gas flow, i.e. the length of the plasma plume is controlled by the natural laminar-to-turbulent transition of the jet. However, the impact of the pulse rate on the plasma plume observed for short length capillary suggests that the plasma has a strong feedback on the jet flow dynamics.
4. Effect of plasma on gas phase transition
The expansion of the gas in surrounding air can be analyzed with Schlieren visualization. This technique enables to observe the neutral rare gas jet induced at the nozzle of the capillary. The fig. 5 presents different Schlieren visualizations obtained for two capillary lengths (5 cm and 15 cm).
Three flow regimes can be observed as the gas flow rate increases: first an almost fully laminar jet, then a jet becoming turbulent near the outlet, and, again a jet with a long laminar region, that will be named “laminar II” in the following. While the measurement of the two first regimes simply reveals the well known transition from laminar to turbulent regime when gas flow rate increases, the third stage “laminar II” was not expected and probably requires further analysis, including the study of the role of the gas as well as the tube diameter and length. Nevertheless, as will be documented in the next section, the existence of these three successive regimes is confirmed through Pitot measurements. These regimes are shown at the outlet of a 5 cm long capillary, when plasma is not activated (fig. 5a)). For a flow of ~2000 sccm, a helium laminar region is observed up to 70 mm from the capillary outlet. As the flow rate increases, the turbulent region gets closer to the capillary outlet (5500 sccm). For higher flow rates, a new laminar region is observed at the
capillary outlet. When the plasma is ON, regimes are still observed, but the transition is obtained for different flow rate. At ~2000 sccm, the extension of the laminar region is reduced by a factor 10. The “laminar II” regime is observed above around 5500 sccm with an increase in length with the gas flow rate. For longer capillaries, same phenomena have been observed but with much higher amplitude and impact. For 15 cm long capillary, the transition to the turbulent regime occurs at much smaller distances from the capillary outlet when the plasma is triggered for low gas flow rate while for higher flow rates a reverse and very pronounced extension of the laminar flow length is measured, reflecting the strong influence of plasma species on the flow topology. To the best of our knowledge, this is the first evidence that plasma plume does not simply develop in the region where helium air fraction is sufficiently high with respect to the cold gas flow calculation, but that the plasma species produced in the ionization front and along the plasma tail modify or build up an helium channel through which plume expansion occurs. This is especially emphasized, with the plasma gun using a 15 cm long capillary, and flow rates ranging from 3 to 5 l/mn: while neutral gas flow is turbulent close to the capillary outlet, the activation of plasma induces a much longer laminar region in the flow and consecutively longer helium plumes.
Fig. 5: Schlieren visualization of helium jet induced at the
nozzle of a capillary of 5 cm length (a) and 15 cm length (b).
By combining ICCD imagery and Schlieren visualization, it has been observed that the plasma plume propagates down to the end of the laminar region. The conical regime is characteristic of the laminar region. Some branching can be observed at the tip of the plume, which corresponds to the plasma propagating in the turbulent region.
5. Correlation between helium and neon
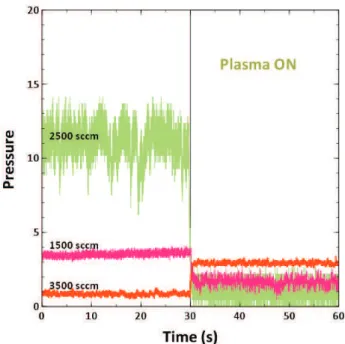
The transition between the different neutral and plasma activated flow regimes were also measured using Pitot glass probe for both helium and neon gas and plasma flows. The tip of the Pitot probe was placed at 2 cm from the outlet of the 5 cm long capillary. The Pitot probe is connected to a differential manometer (0-20 Pa), and
allows to measure the dynamic pressure, which corresponds to:
Pdynamic= Ptotal– Pstatic (1) where Pstatic is the pressure of the room, and Ptotal the pressure collected by the Pitot probe. The fig. 6 presents the evolution of the pressure of helium with and without plasma. The first 30 s correspond to pressure measurements with the plasma OFF, and the last 30 s with the plasma ON. Without plasma, two ranges of pressure are observed. For a flow rate from 1000 sccm to 3500 sccm, the pressure increases and fluctuations appear. These fluctuations can be related to the transition to a turbulent regime and at the location of the Pitot tube tip. Above 3500 sccm, the pressure drastically decreases and fluctuations too. The activation of plasma is also detected by the Pitot probe. At 1000 sccm, fluctuations of pressure are observed, so the transition from laminar to turbulent regime is shifted closer to the capillary outlet, according to Schlieren visualization. At 2000 sccm, the plasma induces a pressure drop. This drop is significative of the effect of plasma on the transition laminar-to-turbulent at low flow rate. For higher flow rate (4500 sccm), an increase of the pressure is observed when the plasma is on. This can confirm the plasma induced helium flow channeling (“laminar II”) of the helium jet, as observed with Schlieren visualization.
So, a Pitot glass probe appears as a convenient way to identify the different gas flow regimes of the jet.
Fig. 6: Evolution of pressure with or without plasma, for
helium.
Same experiments have been carried out with neon, and presented in fig. 7. As for helium, the transition from laminar to turbulent flow regime is identified for low flow rate (1500 sccm). At 3000 sccm (data not shown), the gas is turbulent near the outlet and transition is shifted downstream when the plasma is on. Over 3500 sccm, an increase of the pressure is observed that confirms the
channeling of the jet at the capillary outlet. These results allowed us, to suggest that such plasma action on gas flow and plume length, reported for helium also occurs for neon plasma produced with the plasma gun.
Fig. 7: Evolution of pressure with or without plasma for
neon.
6. Conclusion
The control of the plasma plume length depends on different parameters, especially the gas flow rate and the length of the capillary used for the PAPS propagation before expanding in air. The plasma plume length is directly linked to the capillary length. Capillary length has an influence on the gas jet too. The transition between laminar and turbulent regimes can be controlled by the capillary and by the plasma. PAPS generated by the plasma gun will induce some effects on the gas jet regime. These effects can be a turbulent region occurring closer to the capillary outlet (low flow), or a channeling of the gas jet (high flow). These effects have been observed with Pitot pressure probe and Schlieren
visualization for Helium and neon. These studies may provide some new opportunities to develop much controlled plume volume. Such an example is evidenced with the plasma gun device which allows, when plasma generation and propagation are matched, the generation of 10 cm long plasma plume for rather low Reynolds numbers in comparison with most of small diameter high flow rate plasma jets reported in the literature. Recent publications also indicate plasma role on the neutral gas flow with AC driven argon plasma jets [5]. The combination of three diagnostics (ICCD imaging, Schlieren visualization and Pitot glass probe) allows a better understanding of the propagation of the plasma plume, in case of helium and neon. Characterization of plasma plume in argon will be soon carried out using the same combination of diagnostics.
Acknowledgements. This work was supported by Région Centre through the APR program “Plasmed” and ANR PAMPA. D.R. was financially supported by CNRS and Région Centre, T.D. by Ministère de la recherche and V.S. by Conseil Général du Loiret.
References
[1] E. Karakas, M. Koklu and M. Laroussi, Journal of Physics D: Applied Physics, 43, 155202 (2010).
[2] N. Jiang, J.L. Yang , F. He and Z. Cao, Journal of Applied Physics, 109, 093305 (2011).
[3] S.J. Oh, O.T. Olabanji, C. Hale, R. Mariani, K. Kontis and J.W. Bradley, Journal of Physics D: Applied Physics, 44, 155206 (2011).
[4] E. Robert, V. Sarron, D. Riès, S. Dozias, M. Vandamme and J.M. Pouvesle, Plasma Sources Sciences and Technologies, 21, 034017 (2012).
[5] X.J. Shao, Z.J. Chang, H.B. Mu, W.L. Liao and G.J. Zhang, IEEE Transactions on plasma science, 41, 4, 899-906 (2013).