Titre:
Title
: Multilayer virtualized systems analysis with kernel tracing
Auteurs:
Authors
: Cédric Biancheri, Naser Ezzati-Jivan et Michel R. Dagenais
Date: 2016
Type:
Communication de conférence / Conference or workshop itemRéférence:
Citation
:
Biancheri, C., Ezzati-Jivan, N. & Dagenais, M. R. (2016, août). Multilayer
virtualized systems analysis with kernel tracing. Communication écrite présentée à 4th International Conference on Future Internet of Things and Cloud
Workshops (FiCloudW 2016), Vienna, Austria (7 pages). doi: 10.1109/w-ficloud.2016.18
Document en libre accès dans PolyPublie
Open Access document in PolyPublie
URL de PolyPublie:
PolyPublie URL: https://publications.polymtl.ca/2988/
Version: Version finale avant publication / Accepted versionRévisé par les pairs / Refereed Conditions d’utilisation:
Terms of Use: Tous droits réservés / All rights reserved
Document publié chez l’éditeur officiel
Document issued by the official publisher
Nom de la conférence:
Conference Name: 4th IEEE International Conference on Future Internet of Things and Cloud Workshops (FiCloudW 2016)
Date et lieu:
Date and Location: 2016-08-22 - 2016-08-24, Vienna, Austria
Maison d’édition:
Publisher: IEEE
URL officiel:
Official URL: https://doi.org/10.1109/w-ficloud.2016.18
Mention légale:
Legal notice:
© 2016 IEEE. Personal use of this material is permitted. Permission from IEEE must be obtained for all other uses, in any current or future media, including
reprinting/republishing this material for advertising or promotional purposes, creating new collective works, for resale or redistribution to servers or lists, or reuse of any copyrighted component of this work in other works.
Ce fichier a été téléchargé à partir de PolyPublie, le dépôt institutionnel de Polytechnique Montréal
This file has been downloaded from PolyPublie, the institutional repository of Polytechnique Montréal
Multilayer virtualized systems analysis with kernel tracing
C´edric Biancheri, Naser Ezzati-Jivan and Michel R Dagenais
Abstract— This paper studies interactions between virtual machines and their host through the sharing of resources like physical CPUs. We present an analysis based on kernel tracing that erases the bounds between virtual machines and their host to reduce the multilayer system into a single layer. For this analysis we developed a view that displays a time line for each host’s CPU, showing across time which process is running, even if it is from a virtual machine. By using a system of filters, we added the possibility to highlight in this view either traced machines, virtual CPUs or specific processes. This last feature grants the possibility to precisely see on the host where and when a virtual machine’s thread is running.
I. INTRODUCTION
Among the advantages of cloud environments we can cite their flexibility, their lower cost of maintenance, and the possibility to easily create virtual test environments. Those are some of the reasons explaining why they are widely used in industry. However using this technology also brings its share of challenges in terms of debugging and detecting performance failures. Indeed it can be more straightforward, when using the right tools, to detect performance anomalies while working with a simple layer of virtualization. For instance, if we have information about all the processes running on a machine through time, then it is possible to know for a specific thread which processes interrupted it. Because virtual machines (VM) are running in a layer independent of the host they are running on, it becomes more tedious to detect direct and indirect interactions between tasks happening inside a VM, on the host, or even on nested or parallel VMs.
In this study, we focus on a way to analyze information, coming from a host and multiple VMs, as if all the execution was only happening on the host. The main objective is to erase as much as possible the boundaries between a host and the different virtual environments to help a user visualize in a clearer way how the processes are interacting with each other.
To achieve this, we use kernel tracing on both the host and VMs, synchronize those traces, aggregate them into a unique structure and finally display the structure inside a view showing the different layers of the virtual environment during the tracing period. Considering the set of recorded traces as a whole system is the core concept of our fused virtual machines (FVM) analysis presented here.
This paper is structured as follow: Section II exposes some related work about performance anomalies related to virtual environments. Section III explains in more details the multiple steps of the FVM analysis and introduces the view we created to visualize the whole system. Section IV presents
some use cases for the FVM analysis and view. Section V concludes this paper.
II. RELATED WORK
Dean et al. [1] created an online performance bug infer-ence tool for production cloud computing. To accomplish this, they created an offline function signature extraction using closed frequent system call episodes. The advantage of their method is that the signature extraction can be done outside the production environment, without using a workload that usually triggers a performance default. By using their tool, they can identify a deficient function out of thousands of functions. However, their work is not adapted to performance anomalies involving multiple virtual machines. In their work, Shao et al. [2] proposed a scheduling analyzer for the Xen Virtual Machine Monitor [3]. The analyzer uses a trace provided by Xen to reconstruct the scheduling history of each virtual CPU. By doing so, it is possible to retrieve interesting metrics like the block-to-wakeup time. However, this approach is limited to Xen and not directly applicable to other hypervisors. Furthermore, a trace given by Xen is not enough to identify a process inside a VM that creates a perturbation across the VMs.
To gain in generality, some work was initiated with the intention to detect performance anomalies across virtual machines by using kernel tracing.
With PerfCompass [4], Dean et al. used kernel tracing on virtual machines and created an online system call trace analysis, able to extract fault features from the trace. The advantage of their work is that it is only needed to trace the virtual machine’s system calls and not the host. Conse-quently, their solution has a low overhead impact and is able to distinguish between external and internal faults. However, it is not possible to see the direct interaction of the VM with neither the host nor the other VMs.
Another work proposed by Gebai et al. [5] focused more on the interactions between several machines. The authors proposed at first an analysis and a view showing for each virtual CPU when it is preempted. They also created a way to recover the execution flow of a specific process by crossing virtual machines boundaries to see which processes preempted it.
Their work is similar to ours but differs on multiple points. For instance, in their work, the Virtual Machine view displays one row for each virtual CPU. This number can easily grow if numerous VMs are traced. Consequently, the readability of the view can be altered. Additionally, by doing so, information about physical CPUs is lost. It is therefore
impossible to track a VM, a virtual CPU or a process on the host.
No previous work tries to represent the full execution of a multilayered system as if everything was happening on the host. Nonetheless, in reality, every process, even in nested VMs, eventually runs on a physical CPU of the host. Our study will fulfill this gap.
III. FUSED VIRTUAL MACHINES ANALYSIS Computerized systems tend to rely on a multilayer ar-chitecture. Those layers can either be physical, in which case each layer will be represented by physically separated resources, or logical, meaning all layers will be contained inside a unique physical machine. A heavily logically mul-tilayered system can for instance be simply identified as all the steps between: user interface, data processing, and data storage on physical media or transmission via network.
In this paper, a layer will be analogous to an execution environment that can relate to either a host, or a virtual machine running on a host. Containers are also described as a level of virtualization [6]. However, we will not consider them here since their behavior is quite different from virtual machines. Figure 1 shows how the different layers can be organized in practical cases. Systems not using layers of execution environment have a simple layer which is the host. Virtual machines add a layer above the host. In some cases, users can have containers directly running on the host but, for some security reasons [7], they are most often used on top of virtual machines.
Fig. 1: Examples of different configurations of layers of execution environment.
The idea we introduce here is to erase the bounds between a physical machine and its VMs to simplify the analysis and the understanding of complex multilayer architectures. Some methods for detecting performance drops already exist for single-layer architectures. To reuse some of these techniques on multilayer architectures, one might remodel such systems as if all the activity was involving only one layer.
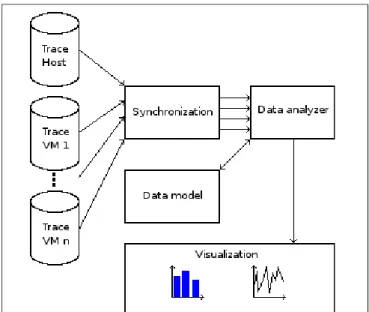
Architecture
The architecture of this work is described as follows: first we need to trace the host and the virtual machines, then because of clocks drift [8] we have to synchronize those traces. After this phase, we use a data analyzer that will fuse all the data available from the different traces to put them in
a data model. Finally, we need to provide an efficient tool to visualize the model that will allow the user to distinguish easily the different layers and their interactions. Those steps are summarized in Figure 2.
Fig. 2: Architecture of the fused virtual machines analysis.
A trace consists of a chronologically ordered list of events characterized by a name, a time stamp and a payload. The name is used to identify the type of the event, the payload provides information relative to the event and the time stamp will specify the moment when the event occurred.
In this study, we use the Linux Trace Toolkit Next Gen-eration (LTTng) [9] to trace the machines’ kernel. This low impact tracing framework suits our needs, although other tracing methods can also be adopted. By tracing the kernel, there is no requirement to instrument applications. Therefore, even a program using proprietary code can be analyzed by tracing the kernel. However, some events from the hypervisor administering the VMs are needed for the efficiency of the fused analysis. The analysis needs to know when the hypervisor is letting a VM run its own code or when it is stopped. Since, in our study, we are using KVM [10], merged in the Linux kernel since version 2.6.20 [11], and because the required trace points already exist, there is no need for us to instrument the hypervisor. The event indicating a return to a VM running mode will be generically called a vmentry, while the opposite event will be called a vmexit.
Synchronization is an essential part of the analysis. Since traces are generated on multiple machines by different in-stances of tracers, we have no guaranty that a time stamp for an event in a first trace will have any sense in the context of a second trace. Figure 3 shows that without synchronization two traces recorded at the same time can seem to be created at two different times. The right scheduling of events, even coming from different traces, is crucial because when fusing the traces of a VM with its host, the events of the VM will
Fig. 3: Traces visualization without synchronization.
have to be exactly between the vmentry and the vmexit that delimit the beginning and the end of the VM’s execution. An imperfect synchronization can be the vector of incoherent observations that would impede the fused analysis.
Because VMs can be seen as nodes spread through a network, a traces synchronization method for distributed systems [12] can be adapted. As [5] we use hypercalls from the VMs to generate events on the host that will be related to the event recorded on the VM before triggering the hypercall. With a set of matching events, it is possible to use the fully incremental convex hull synchronization algorithm [13] to achieve traces synchronization.
The purpose of the data analyzer is to extract from the synchronized traces all relevant data and to add them in a data model. As a result, still being a kernel analysis, the fused analysis is based on a preexisting kernel analysis used in Trace Compass, a trace analyzer and visualizer framework. Therefore, the fused analysis will by default handle events from the scheduler,the creation, destruction and waking up of processes, the modification of a thread’s priority, and even the beginning or the end of system calls.
Unlike in a basic kernel analysis, the fused analysis will not consider each trace independently but as a whole. Consequently, the core of our analysis is to consider events coming from VMs as if they were directly happening on the host. As shown in Figure 4, the main objective is to construct one execution flow by fusing those occurring on the host and its VMs. The result should be a unique structure reviewing all the executions layers at the same time, replacing what was seen as the hypervisor’s execution, from the point of view of the host, by what was really happening inside the VM.
Data model
The data analysis needs an adapted structure as data model. This structure needs to satisfy multiple criteria. A fast access to data is preferred to provide a more pleasant visualizer, so it should be efficiently accessible by a view to dynamically display information to users. The structure will also need to provide a way to store and organize the state of the whole system, while keeping information relative to the different layers. For this reason, we need a design that can store information about diverse aspects of the system. As seen in Figure 5, the structure will contain information relating to the state of the different threads but also of the
Fig. 4: Construction of the fused execution flow.
numerous CPUs and VMs. In red is shown the information specific to a multilayer analysis, like the condition of the CPU (running a VM or not) or the number of the virtual CPUs currently running on a physical CPU.
Fig. 5: Structure of the data model.
Finally the data model provides a time dimension aspect, since the state of each object attribute in the structure is relevant for a time interval. Those intervals introduce the need for a scalable model, able to record information valid from a few nanoseconds to the full trace duration.
In this study, we chose to work with a State History Tree (SHT) [14]. A SHT is a disk-based data structure designed to manage large streaming interval data. Furthermore, it provides an efficient way to retrieve, in logarithmic access time, intervals stored within this tree organization [15].
Algorithm 1 constructs the SHT by parsing the events in the traces. If the event was generated by the host, then the CPU that created the event is directly used to handle the event. However, if the event was generated by a virtual machine, we need to find the physical CPU harboring the virtual CPU that created the event, before handling it.
Algorithm 1 Handling multilayer kernel traces Input: StateHistoryTree s, List <Event> list
1: for each event in list do
2: // the machine that generated the event 3: machine = event.getMachine(); 4: if machine is a VM then
5: // translation between virtual and physical CPU 6: cpu= getPhysicalCPU(machine, cpu);
7: else
8: // the CPU that generated the event 9: cpu= event.getCPU():
10: end if
11: handleEvent(s, event, cpu); 12: end for
Algorithm 2 describes the handling of a vmentry event. In this case, we query the virtual CPU that is going to run on the physical CPU. Then, we restore the state of the virtual CPU in the SHT, while we save the state of the physical CPU. The exact opposite treatment is done for handling a vmexit event.
Algorithm 2 Handling vmentry event Input: StateHistoryTree s, Event e, int cpu
1: if event == vmentry then
2: VirtualCPU vcpu = Query the virtual CPU going to run on cpu;
3: Save the state of cpu contained in s; 4: Restore the state of vcpu in s; 5: end if
Visualization
After the fused analysis phase, we obtain a structure containing state information about threads, physical CPUs, virtual CPUs and VMs through the traces duration. Our intention at this step is to create a view made especially for kernel analysis and able to manipulate all the information about the multiple layers contained inside our SHT. This view is called the Fused Virtual Machine (FVM) view.
This view shows, in a time graph representation, the state of the physical CPUs during a tracing session with one line for each CPU. This state can either be idle, running in user space, or running in kernel space. Those states are respectively represented in gray, green and blue. However,
there is technically no restriction on the number of CPU states if an extension of the view is needed.
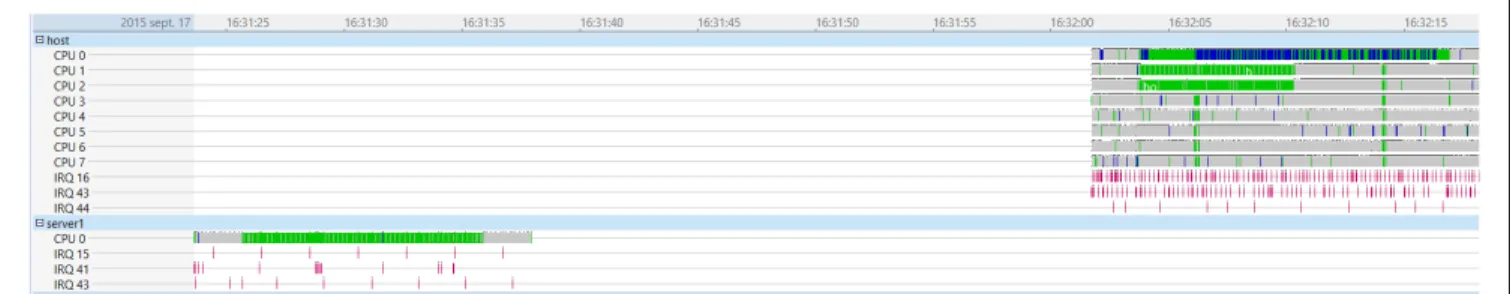
The Resources view is a time graph view in Trace Compass that is also used to analyze a kernel trace. It normally manages different traces separately and doesn’t take into account the multiple layers of virtual execution. Figure 6 shows the difference between the FVM view and the Resources view displaying respectively a fused analysis and a kernel analysis coming from the same set of traces.
In this set, servers 1, 2 and 3 are VMs running on the host. All VMs are trying to take some CPU resources. As should be, the FVM view shows all the traces as a whole, instead of creating separate displays as seen in the Resources view. The first advantage of this configuration is that we only need to display the physical CPUs rows instead of one row for each CPU, physical or virtual. With this structure, we gain in visibility. The multiple layers’ information is condensed within the rows of the physical CPUs.
To display information about virtual CPUs and VMs without adding a row for each, the FVM view asks the data analyzer to extract some information from the SHT. Consequently, for a given time stamp, it is possible to know which process was running on a physical CPU, and on which virtual CPU and VM it was running, if the process was not directly executed on the host.
We noticed that, in the Resources view, the information is often too condensed. For instance, if several processes are using the CPUs it can become tedious to distinguish them. Therefore, this situation is worse in the FVM view, because more layers come into play. For this reason, we developed a new filter system in Trace Compass that allows developers of time graph views to highlight any part of their view, depending on information contained in their data model.
Using this filter, it is possible to highlight one or more physical or virtual machines, some physical or virtual CPUs, and some specifically selected processes. In particular, this filter will display what the user doesn’t want to see, as if it was covered with a semi opaque white band. Selected areas will appear highlighted in contrast. Consequently, it is possible to see the execution of a specific machine, CPU or process directly in that view.
Figure 7 shows the real execution location of a virtual machine on its host. With this filter, we can distinctively see when the CPU was used by another machine, instead of the highlighted one.
IV. USE CASES AND EVALUATION Use cases
The concept of fusing kernel traces can have very inter-esting applications. In this section, we expose two different use cases.
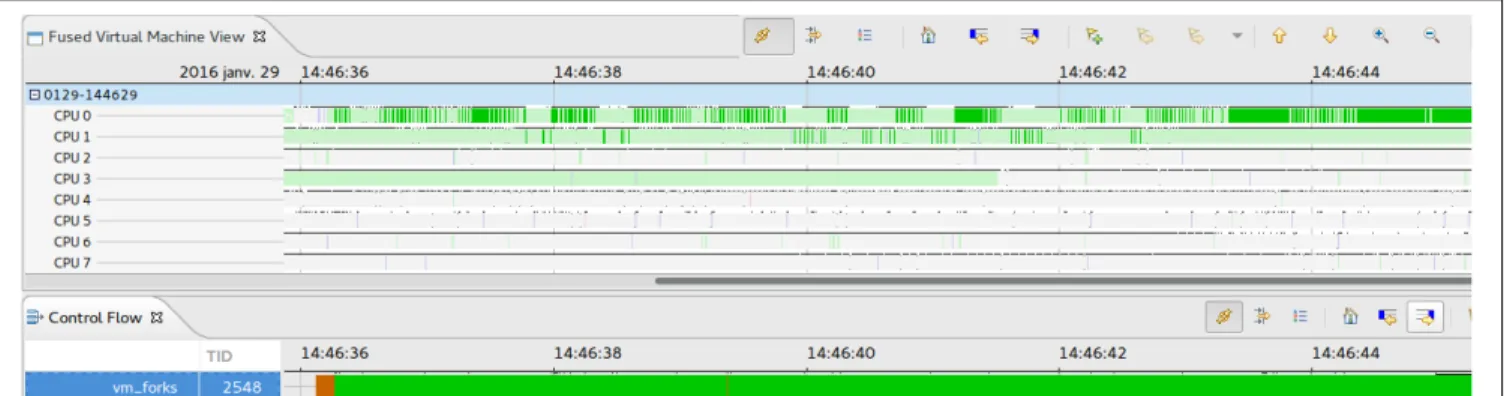
Our first use case is selecting a specific process running on a virtual machine in order to observe with the FVM view when and where the process was running.
Figure 8 shows that from the point of view of the VM, the process vm forks was running without interruption according to the Control Flow view. The Control Flow view is a view
Fig. 6: Comparison between FVM view and Resources view.
Fig. 7: VM server1 real execution on the host.
listing all the threads that were running during the tracing session, giving the state of those threads (running, waiting for cpu, blocked. . . ). However, when we highlight the process in the FVM view, we clearly see that the selected process was preempted. If we magnify the view, we can even directly see which process from which machine is preempting our highlighted process, and when the process migrated to an other CPU.
These observations are a direct result of both creating an analysis that considers a set of traces as a whole and creating a view that takes into account the existence of the different layers.
Our second use case benefits from the fact that, by erasing the bounds between a virtual machine and its host, this
analysis and view provide a tool to better understand the execution of an hypervisor. With the FVM view, it is possible to precisely see the interactions between the hypervisor and the host, depending on the instrumentation used. For instance, we can observe how an interruption is handled inside a VM.
Figure 9 shows what occurred during an I/O interruption happening in a VM running on physical CPU 1. We high-lighted the execution of the VM to see when the hypervisor is involved. The hypervisor stopped the VM, meaning that the thread went out of guest mode, returned to kernel mode, then to user mode to handle the I/O interruption, then back to kernel mode and finally let the VM run by switching back
Fig. 9: Handling of an ata piix I/O interruption by the hypervisor on the physical CPU 1.
to guest mode. This behavior is completely consistent with what is expected in [10].
Evaluation
If we compare the time needed to complete a fused analysis for a set of traces and the one needed to complete a simple kernel analysis for the same set, we come to the conclusion that the simple kernel analysis is faster. LetTibe the time needed to analyze tracei. Since the simple kernel analysis doesn’t consider the set of traces as a whole but each trace independently, the analysis of the set can be done in parallel, each core dedicated to one trace. If we suppose that we have more cores than traces, then the elapsed time during the analysis will bemax1≤i≤nTi wheren is the number of traces.
If the set is considered as a whole, then it is difficult to process the traces in parallel. The elapsed time during the fused analysis will consequently be n1≤iTi.
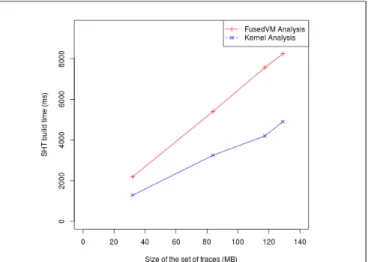
Figure 10 shows experimentally the time needed for the fused analysis and a simple kernel analysis to build SHTs for different sizes of sets of traces. We see that the build time for the fused analysis is directly related to the size of the set of traces.
Fig. 10: Comparison of construction time between FusedVM Analysis and Kernel Analysis.
However, we need to realize that the traces of the set are correlated. All the events generated on a physical CPU between two consecutive vmentry and vmexit events are coming from the same virtual CPU. This observation means that, in reality, the fused analysis is as fast as a simple kernel analysis where all the events are coming from the host. It also means that there are as many events treated as if the processes in the VMs were directly running on the
host. Consequently, if a method to analyze a kernel trace in parallel is developed, it will be directly applicable to the fused analysis.
V. CONCLUSION AND FUTURE WORK In this paper, we presented a new concept of kernel traces analysis adapted to cloud computing and virtualization that can help the development of those technologies. This concept is independent of the kernel tracer and hypervisor used. By creating a new view in Trace Compass, we showed that fusing multilayer traces allows us to reuse existing tools targeted to single layer architectures. Finally, by adding a new filter feature to the FVM view, we showed how it is possible to observe the real execution on the host of a virtual machine, one of its virtual CPUs or its processes. In the future, we can expect more tools being reused to support a fused kernel analysis. We could also use the same principle to analyze more thoroughly systems using applications and programs in virtual execution environments, such as Java, Python or even containers. Finally, we can also extend our work to be able to visualize VMs’ interactions between nodes to better understand the internal activity of cloud systems.
REFERENCES
[1] Dean, D. J., Nguyen, H., Gu, X., Zhang, H., Rhee, J., Arora, N., Jiang, G. (2014, November). Perfscope: Practical online server performance bug inference in production cloud computing infrastructures. In Pro-ceedings of the ACM Symposium on Cloud Computing (pp. 1-13). ACM.
[2] Shao, Z., He, L., Lu, Z., Jin, H. (2013). Vsa: an offline scheduling analyzer for xen virtual machine monitor. Future Generation Computer Systems, 29(8), 2067-2076.
[3] Dragovic, B., Fraser, K., Hand, S., Harris, T., Ho, A., Pratt, I., ..., Neugebauer, R. (2003). Xen and the art of virtualization.
[4] Dean, D. J., Nguyen, H., Wang, P., Gu, X. (2014). PerfCom-pass: Toward runtime performance anomaly fault localization for infrastructure-as-a-service clouds. In 6th USENIX Workshop on Hot Topics in Cloud Computing (HotCloud 14).
[5] Gebai, M., Giraldeau, F., Dagenais, M. R. (2014). Fine-grained pre-emption analysis for latency investigation across virtual machines. Journal of Cloud Computing, 3(1), 1-15.
[6] Vaughan-Nichols, S. J. (2006). New approach to virtualization is a lightweight. Computer, 39(11), 12-14.
[7] Stephen Soltesz, Herbert Ptzl, Marc E. Fiuczynski, Andy Bavier, and Larry Peterson. 2007. Container-based operating system virtualization: a scalable, high-performance alternative to hypervisors. SIGOPS Oper. Syst. Rev. 41, 3 (March 2007), 275-287.
[8] Marouani, H., Dagenais, M. R. (2008). Internal clock drift estimation in computer clusters. Journal of Computer Systems, Networks, and Communications, 2008, 9.
[9] Desnoyers, M., Dagenais, M. R. (2006, July). The LTTng tracer: A low impact performance and behavior monitor for GNU/Linux. In OLS (Ottawa Linux Symposium) (Vol. 2006, pp. 209-224).
[10] Kivity, A., Kamay, Y., Laor, D., Lublin, U., Liguori, A. (2007, July). kvm: the Linux virtual machine monitor. In Proceedings of the Linux symposium (Vol. 1, pp. 225-230).
[11] ”Linux 2 6 20 - Linux Kernel Newbies”. Kernelnewbies.org. N.p., 2016. Web. 7 Mar. 2016.
[12] Jabbarifar, M. (2013). On line trace synchronization for large scale distributed systems (Doctoral dissertation, cole Polytechnique de Mon-tral).
[13] Poirier, B., Roy, R., Dagenais, M. (2010). Accurate offline synchro-nization of distributed traces using kernel-level events. ACM SIGOPS Operating Systems Review, 44(3), 75-87.
[14] Montplaisir-Gonc¸alves, A., Ezzati-Jivan, N., Wininger, F., Dagenais, M. R. (2013, September). State history tree: an incremental disk-based data structure for very large interval data. In Social Computing (SocialCom), 2013 International Conference on (pp. 716-724). IEEE. [15] Montplaisir, A., Ezzati-Jivan, N., Wininger, F., Dagenais, M. (2013, September). Efficient model to query and visualize the system states extracted from trace data. In Runtime Verification (pp. 219-234). Springer Berlin Heidelberg.