Modeling End User Performance Perspective for Cloud Computing
Systems Using Data Center Logs from Big Data Technology
BY
Anderson RAVANELLO
THESIS PRESENTED TO ECOLE DE TECHNOLOGIE SUPERIEURE
IN PARTIAL FULFILLMENT FOR THE DEGREE OF
DOCTOR OF PHILOSOPHY PH.D.
MONTREAL, OCTOBER 16, 2017
ÉCOLE DE TECHNOLOGIE SUPÉRIEURE
UNIVERSITÉ DU QUÉBEC
© Copyright reserved
It is forbidden to reproduce, save or share the content of this document either in whole or in parts. The reader who wishes to print or save this document on any media must first get the permission of the author.
BOARD OF EXAMINERS THIS THESIS HAS BEEN EVALUATED BY THE FOLLOWING BOARD OF EXAMINERS
Mr. Alain April, Thesis Supervisor
Department of Software Engineering and IT, École de Technologie Supérieure
Mr Abdelaoued Gherbi, Thesis Co-supervisor
Department of Software Engineering and IT, École de Technologie Supérieure
Mr Ambrish Chandra, President of the Board of Examiners
Department of Electrical Engineering, École de Technologie Supérieure
Mr Stephane Coulombe, Member of the jury
Department of Software Engineering and IT,École de Technologie Supérieure
Mrs. Cherifa Mansoura Liamani, external evaluator Business Architect at TEKsystems
THIS THESIS WAS PRESENTED AND DEFENDED
IN THE PRESENCE OF A BOARD OF EXAMINERS AND THE PUBLIC SEPTEMBER 5TH, 2017
ACKNOWLEDGMENTS
This thesis would not have been possible without the guidance of my research supervisors, Professors Alain April and Abdelouahed Gherbi, which frequently provided constructive feedback and direction on the work to be done. I am also grateful for the assistance provided by Professors Alain Abran and Jean-Marc Desharnais who patiently reviewed my work on the published papers and to Mrs. Rosalia Falco for the careful proofreading.
I owe my deepest gratitude to my family who provided the stable background and environment without which would have made this work even harder to accomplish.
MODÉLISER LA PERSPECTIVE DE L’UTILISATEUR FINAL CONCERNANT LA PERFORMANCE DE LOGICIELS INFONUAGIQUES À L'AIDE DES REGISTRES
DE JOURNAUX DU CENTRE DE DONNÉES ET DE TECHNOLOGIES DE DONNÉES MASSIVES (BIG DATA)
Anderson RAVANELLO
RÉSUMÉ
La mesure de la performance des systèmes d'information obsède encore les ingénieurs en logiciel depuis que s'est développé ce champ de recherche. Progressivement, de nombreuses techniques et méthodologies se sont développées en vue d’aider les ingénieurs et les entreprises à mieux comprendre, à gérer et à améliorer les performances que les utilisateurs finaux perçoivent lorsqu'ils utilisent les systèmes d'information lors de leurs opérations quotidiennes. Certaines techniques de mesure de la performance se servent d'enquêtes pour examiner quels aspects de la performance va satisfaire ou ne satisferont pas aux exigences des utilisateurs finaux. D’autres techniques de mesure de la performance proposent de dupliquer les mêmes opérations entre différents services afin de comparer les performances en utilisant un ensemble de tâches similaires. Une autre manière d'aborder le problème a été expérimentée et a permis de modifier légèrement les données échangées entre les clients et les serveurs afin d'inclure des composantes qui vont favoriser le suivi détaillé de la performance en tenant compte ce de qu’a été modifié.
L’approche de mesure à l’aide d’enquêtes n’offre pas d'informations détaillées en ce qui a trait au temps de la journée, à l'humeur du répondeur et à de nombreux autres facteurs humains, dissimulant ainsi une cause fondamentale qui ne favorise pas suffisamment l'interaction qui permettrait des actions préventives et correctives lorsqu'un problème de performance se dessine. D’autres recherches proposent l’utilisation de techniques de simulation à titre de solution potentielle permettant ainsi de produire des informations précises en ce qui concerne les caractéristiques de la performance d’un logiciel, mais la faiblesse de cette approche est qu’elle ne permet pas la participation réelle de l’utilisateur. De plus, les simulations, dans l'état actuel de la technologie, ont du mal à refléter avec précision la complexité du raisonnement
VIII
derrière les décisions de l’utilisateur concernant l'emploi ou non d’un système d'information selon le cheminement suivi par chacun des utilisateurs. Finalement, les techniques proposées qui manipulent les données transactionnelles, entre clients et serveurs, ont comme effet secondaire d’influencer de manière négative la performance, la confidentialité et la réfutabilité des données. Si un système de modélisation de la performance modifie des données transactionnelles (même le plus légèrement), ce système pourrait causer des problèmes ce qui en décourage généralement l’utilisation.
Dans cette thèse, la question fondamentale qui se pose est de savoir si la performance telle que perçue par des utilisateurs finaux qui se servent d’applications opérant sur l’infonuagique peut être modélisée de manière fidèle et peu ou non intrusive de sorte que l’information puisse être analysée et utilisée pour la prévention et la correction de problème le plus rapidement possible. Pour modéliser fidèlement la notion de performance du point de vue d’un utilisateur final, la solution considérée inclut la combinaison d’une analyse exhaustive des requêtes interactives qui tient compte de l’état de l’environnement opérationnel et du suivi détaillé de la manipulation des données tout en minimisant les faiblesses de chacune de ces techniques.
Au fur et à mesure que les entreprises mettent en place des infrastructures et des systèmes d´infonuagique, les difficultés de mesure de la performance sont influencées par de nombreux facteurs, mais surtout celui de la complexité accrue de ces systèmes qui se trouvent à être beaucoup plus complexes que les technologies précédentes. L’infonuagique souffre actuellement d’un manque d’outils de mesure de la performance telle que perçu par l'utilisateur; influencé par des aspects sociotechniques tels que les connaissances techniques, la fiabilité, la performance du système, la disponibilité et l'efficacité. (Armbrust, Fox, & Griffith, 2009; Gruschka & Jensen, 2010; Grobauer, Walloschek, & Stocker, 2011)
Afin de pouvoir relever ce défi, la solution proposée et expérimentée lors de cette recherche vise à mieux utiliser les journaux de performance disponibles au sein des centres de données. Ces journaux de performance sont très rependus et contiennent des données textuelles mettant en évidence différentes consommations de ressources ainsi que des activités réalisées dans
IX
différentes composantes opérationnelles des applications opérant sur l’infonuagique. La journalisation est largement utilisée dans l'industrie pour le dépannage et les enquêtes concernant les problèmes de performance ponctuels. Dans cette thèse, les données de ces journaux sont explorées de façon plus approfondie afin de répondre au besoin de précision, de granularité et de réactivité dans un court temps de décision requis de façon à répondre au défi d’une modélisation fidèle de la performance telle que perçue par l’utilisation et potentiellement pour sa prédiction. La quantité et la granularité des données recueillies dans ces journaux sont actuellement massives. Chacune des composantes informatiques et chacune des composantes du réseau utilisé par une application infonuagique analysées pourraient générer jusqu'à 800 Ko de données par minute. Cette quantité massive de données est difficile à traiter et à explorer à l'aide de technologies traditionnelles. Afin de résoudre cette problématique, l’utilisation de technologies Big Data émergentes, tel que Hadoop Distributed File System et Apache Spark sont utilisées afin de collecter et traiter, en temps réel, les données de toutes ces sources et de traiter simultanément ces nombreux journaux.
Cette thèse propose un nouveau modèle de mesure de la performance telle que perçue par les utilisateurs finaux permettant de modéliser la performance d’un système d'information opérant sur l’infonuagique. Ce modèle possède de nombreuses applications pratiques dans le domaine de la mesure du niveau de service et de la prévision de la performance. Il utilise un faible sous-ensemble de données de mesures de journaux (c.-à-d. des mesures directes et des mesures dérivées) qui s’avèrent plus significatives et exploitables afin de modéliser fidèlement et rapidement la performance d’un système d’information telle que perçues par son utilisateur final. Ce nouveau modèle de performance proposé a été inspiré du modèle théorique de la mesure infonuagique et des caractéristiques de qualité préalablement proposée par Bautista (Bautista, Abran, & April, 2012). Ce nouveau modèle de mesure de la performance d’un logiciel infonuagique telle que perçue par l’utilisateur final a été validé à l’aide d’une quantité massive de données provenant de journaux de transactions et fait une extension des principes de mesure suggérés par Bautista en proposant l’utilisation d’un indicateur de performance et en ajoutant une interaction avec les utilisateurs finaux afin de confirmer la perception pressenti par ce modèle.
X
Une expérimentation à grande échelle sur un cas de figure réel d’une grande entreprise qui possède des logiciels opérant sur une infrastructure infonuagique privée a été réalisée et décrite. Cette expérimentation du modèle proposé, dans laquelle des mesures sont analysées à partir d'une infrastructure Big Data moderne, a permis de confirmer qu’il est possible de modéliser fidèlement la performance perçue par l'utilisateur final; cette performance étant représentée comme un ensemble d'indicateurs de performance basés sur l'accord de niveau de service pour l’infonuagique étudié. Cette recherche permet finalement d’apporter une solution à la question de la modélisation de la performance d’un logiciel telle que perçue par les utilisateurs finaux. Elle offre une avenue de solution pour la mise en œuvre de la mesure lors d’ententes de service pour les applications logicielles opérant sur l’infonuagique de manière à favoriser l'analyse de données de performance dans un court laps de temps. Le modèle ouvre aussi la porte à la mise en place future d’algorithmes de prévision de la performance.
MODELING END USER PERFORMANCE PERSPECTIVE FOR CLOUD COMPUTING SYSTEMS USING DATA CENTER LOGS FROM BIG DATA
TECHNOLOGY Anderson RAVANELLO
ABSTRACT
Information system performance measurement has been a concern for software engineers since the early days of the field’s development. Over time, numerous techniques and methodologies have been developed that help engineers and companies better understand, manage and improve the performance that the end users perceive when using information systems in their daily operations. Some performance measurement techniques employ surveys that investigate which aspects satisfy or do not satisfy end user requirements. Other performance measurement techniques simulate the same operations across different services in order to compare performance given a similar workload. Yet another approach that has been experimented slightly modifies the data exchanged between clients and servers in order to include components that help with tracing the performance of different operation statuses.
When we consider surveys or questionnaires as a performance measurement technique, they do not include detailed information about the sources of problems that may be impacted by the time of day, the responder’s mood and many other human factors, thus masking the root cause and they are not sufficiently interactive to allow for a timely reaction when there is a performance problem. Simulation is also proposed as a potential solution where the same operations, over different platforms, correctly report fundamental characteristics of performance. This approach however, removes the user’s perspective. It is difficult to assume that a simulation would be able to, with the current state of technology, accurately reflect the complexity of a user’s reasoning and decisions regarding the use of a specific information system in a particular way. Finally, the manipulation of the transactional data between client and hosts could affect the confidentially and refutability of the data used to determine the performance; if an information system includes the possibility of data being modified, even slightly, the end user could lose trust in it, negatively affecting the human-machine relation.
XII
The question that is considered here is how can the end user performance perspective of cloud computing-based applications be modeled in a way so that timely analysis can be enacted upon the information? The best possible solution for understanding performance from the end user’s perspective could emerge from combining the completeness of interactive surveys with the controlled environment of simulations and the traceability of packet manipulation, while minimizing the weaknesses of each of these techniques. As companies continue to rollout cloud computing infrastructures and systems, the difficulty with performance measurement increases due to a number of factors, most noticeably, the increased complexity of these systems in comparison with their previous versions as well as the unreliability of the performance experience as perceived by the end user, which is influenced by socio-technical aspects such as technical knowledge, trust, system performance, availability and efficacy (Armbrust, Fox, & Griffith, 2009) (Gruschka & Jensen, 2010) (Grobauer, Walloschek, & Stocker, 2011).
In order to be able to address these particular challenges, one possible solution could be to make better use of the ubiquitous industry standard performance logs. Performance logs are textual representations of different resource consumption and activities performed in the various operational cloud system components. Logs have been extensively deployed in the industry and used for both troubleshooting and punctual investigations of performance problems. In this research, logs are explored more extensively in order to address the need for precision, granularity and responsiveness within the decision time required for the current management/prediction challenges. The amount and granularity of the data harvested could potentially be massive. Each of the analyzed hosts or network components can generate as much as 800 KB of data per minute. This could quickly turn into a very large amount of data that is difficult to process and access using traditional SQL-based technologies. One of the possible alternatives for resolving this issue is employing Big Data technologies such as the Hadoop Distributed File System and Apache Spark in order to interactively collect the data from multiple sources and process the individual files simultaneously, which would prove difficult using classic relational database technology.
XIII
This research proposes a novel performance measurement model for cloud-based information systems as perceived by end users, with many practical applications in the domain of service level measurement and performance prediction. It identifies meaningful and actionable data center logs of low-level direct and derived measurements to model the end user performance perspective. The cloud computing measurement model and quality characteristics presented by Bautista’s framework (Bautista, Abran, & April, 2012) are implemented and experimented. The model for the end user performance perspective for cloud computing systems using data center logs from Big Data technology expands Bautista’s original work by proposing the utilization of a performance indicator and including end user response in order to forecast possible performance anomalies.
A large-scale experimentation is described where the measures are analyzed using a modern Big Data infrastructure in order to model the end user performance perspective as an expression of performance indicators based on the service level agreement for the cloud computing services studied.
The experimentation addresses the research question and offers a solution avenue for modelling the end user performance perspective of cloud computing based applications in future service level agreements so that a timely analysis of the data can be expected and a predictive algorithm developed to anticipate upcoming performance issues.
TABLE OF CONTENTS
RÉSUMÉ………..…………VII ABSTRACT………...………XI LIST OF TABLES… ... XVII LIST OF FIGURES ...XVIII LIST OF ALGORITHMS ... XX TABLE OF ABBREVIATIONS ... XXII
INTRODUCTION ………...………7
CHAPTER 1 Research Introduction ... 17
1.1 Motivation ...17
1.2 Problem definition ...22
1.3 Research question ...23
1.4 Methodology ...23
1.4.1 Definition of the research ... 24
1.4.2 Planning ... 25
1.4.3 Development of theory and experimentation ... 26
1.4.4 Interpretation of the results ... 29
1.5 Chapter conclusion...30
CHAPTER 2 Literature review ... 31
2.1 Performance management ...32
2.1.1 Performance Measurement – Software Engineering Perspective ... 32
2.1.2 Performance Measurement – Business perspective ... 49
2.2 Cloud computing ...54
2.2.1 Definition ... 54
2.2.2 Service and deployment models ... 55
2.2.3 Advantages and disadvantages of cloud computing technology ... 57
2.2.4 Section conclusion ... 59
2.3 Analysis of the previous research ...60
2.3.1 End user performance perspective ... 60
2.3.2 System measurement process ... 62
2.3.3 Big Data and Machine learning ... 64
2.3.4 Section conclusion ... 66
2.4 Chapter conclusion...66
CHAPTER 3 Research problematic ... 69
3.1 Research Problematic...69
XVI
3.3 Planned solution and validation method for the research problem ... 70
3.4 Chapter Conclusion ... 72
CHAPTER 4 Experiment ... 73
4.1 Introduction ... 73
4.2 Association of end user performance perspective with low level and derived measures . 75 4.2.1 Experiment description ... 76
4.2.2 Data Analysis ... 77
4.2.3 Experiment conclusion ... 80
4.3 Mapping performance measures for CCA, platform and software engineering concepts 80 4.4 Validation of quality measures for representing performance from an end user perspective on CCA ... 82
4.4.1 Validation description ... 83
4.4.2 Data analysis ... 85
4.4.3 Validation conclusion ... 86
4.5 Laboratory experiment for end user performance modeling... 86
4.5.1 Description ... 86
4.5.2 Setup ... 86
4.5.3 Data preparation ... 87
4.5.4 Analysis ... 88
4.5.5 Experiment conclusion ... 89
4.6 Extension of Bautista’s performance measurement model ... 89
4.6.1 Setup ... 89
4.6.2 Data preparation ... 91
4.6.3 Feature Extraction ... 92
4.6.4 Correlation analysis ... 95
4.6.5 Anomaly detection ... 96
4.6.6 Application of the model ... 98
4.6.7 Discussion ... 100
4.6.8 End user feedback and anomaly forecasting ... 108
4.6.9 Experiment conclusion ... 115
4.7 Chapter conclusion ... 117
CHAPTER 5 Proposition of a model for end user performance perspective for cloud computing systems using data center logs from Big Data technology ... 119
CHAPTER 6 Conclusion ... 125
ANNEX I RESEARCH CONTRIBUTIONS ... 129
ANNEX II COMPLETE LIST OF IDENTIFIED MEASURES ... 131
ANNEX III ANOMALY DETECTION (SCREENS, UNTRAINED, TRAINED BAYES) ... 133
XVII
LIST OF TABLES
Page
Table 1.1 Research Definition………...………..………….24
Table 1.2 Research Planning ...25
Table 1.3 Interpretation of the results ...30
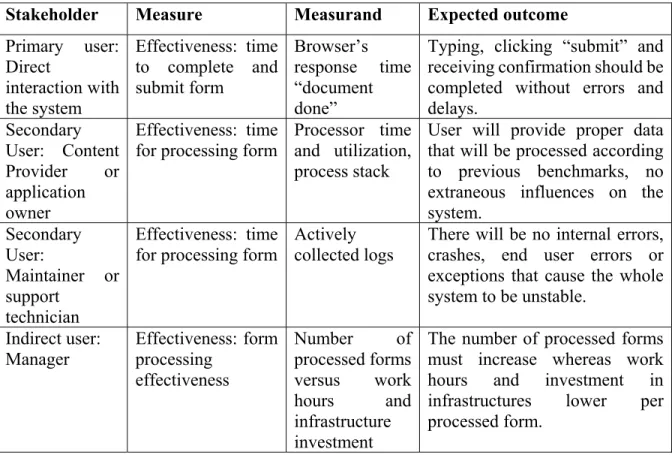
Table 2.1 Different stakeholder perspectives for the quality of "Time Effectiveness" ...39
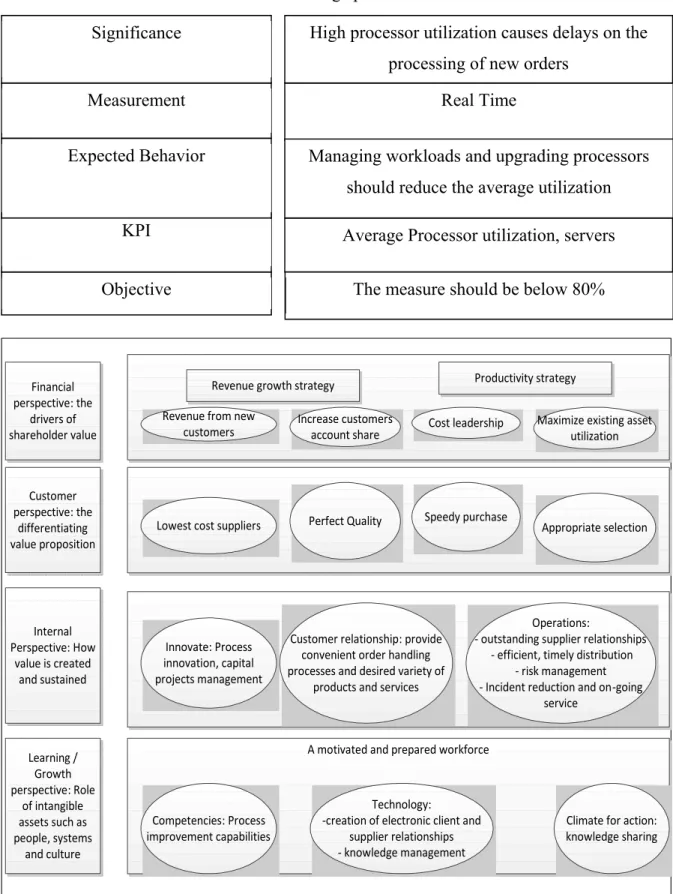
Table 2.2 Generic KPI – Average processor utilization for servers ...51
Table 2.3 Generic Strategic map containing a simple IT objective aligned to the business 52 Table 4.1 Association of the identified LLDM and ISO 25023 concepts ...79
Table 4.2 Average LLDM value for the machines identified in the degradation reports. ...79
Table 4.3 Excerpt of the Data Collected and the location and type of CCS component (where * means affecting multiple components)...81
Table 4.4 Excerpt of the association between performance log data and PMFCCA quality sub-concepts (where * means affecting multiple components) ...82
Table 4.5 Performance measurement and manipulation technique ...84
Table 4.6 Excerpt of Performance Log Measures, the simulation values and the effects on job turnaround. ...85
Table 4.7 Excerpt of collected measures and qualitative evaluations ...99
Table 4.8 Most Frequently Extracted Features ...101
Table 4.9 The intra-component correlation of performance measures of one component .102 Table 4.10 Trans-component correlation ratios, (svchost#1)\IO Read Operations/sec ...103
Table 4.11 Trans-component correlated performance measures ...104
LIST OF FIGURES
Figure 0.1 Quality characteristics and attribute association (Bautista, Abran, & April,
2012) ...8
Figure 1.1 Common three-tiered client-server architecture (IBM, 2013) ...19
Figure 1.2 Cloud computing architecture (Martensson, 2006) ...19
Figure 2.1 ISO/IEC 25000 compliant measure versus BSC & KPI compliant measure ...31
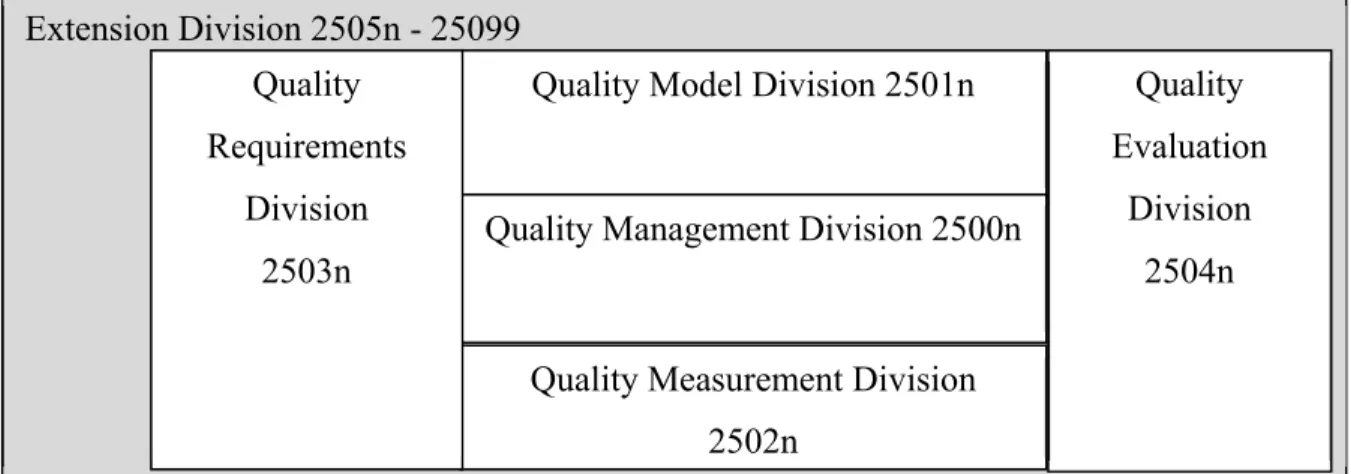
Figure 2.2 ISO/IEC 25000 - Groups of documents, adapted from (ISO/IEC, 2005) ...33
Figure 2.3 Quality in Use and Product Quality models (ISO/IEC, 2005) ...36
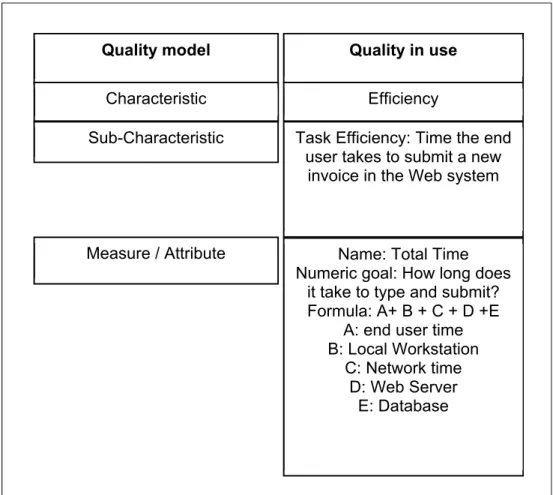
Figure 2.4 Quality in use: New Invoice Submission efficiency measure ...37
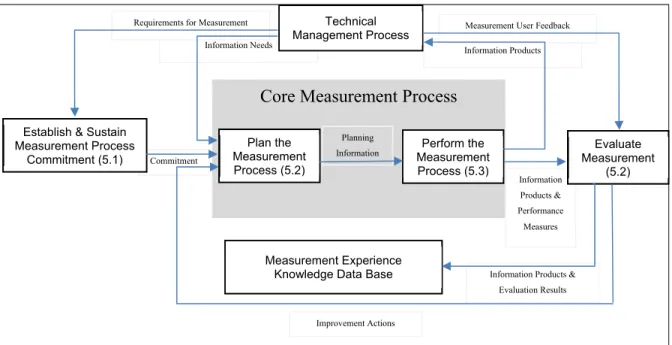
Figure 2.5 ISO/IEC 15939:2007 - Measurement process ...41
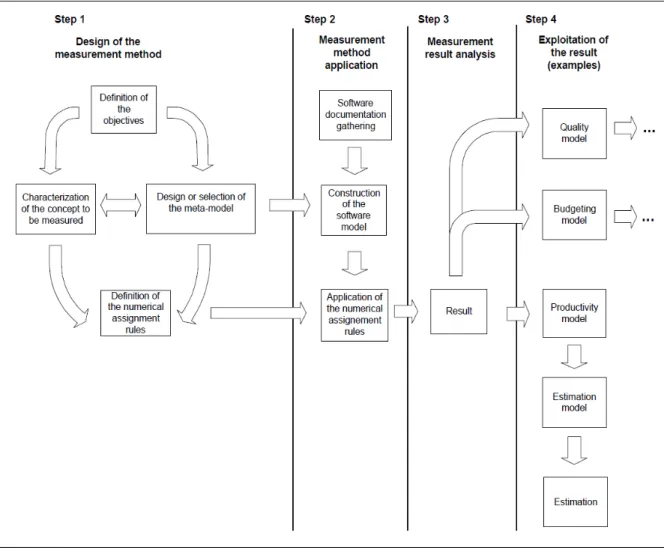
Figure 2.6 Detailed Model – Measurement Process (Jacquet & Abran, 1997) ...45
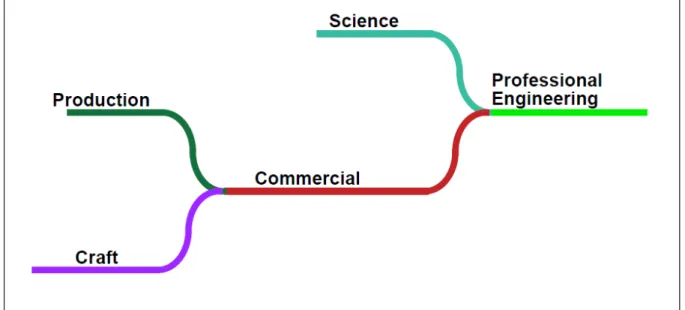
Figure 2.7 Evolution of engineering disciplines (Finch, 1951) ...47
Figure 2.8 Balanced Scorecard Strategic Map – adapted from (Kaplan & Norton, 1992) ....51
Figure 2.9 A Private SaaS cloud that will be used in the experimentations ...57
Figure 4.1 Research and experiments schema ...74
Figure 4.2 Relative presentation of collected and referenced data ...77
Figure 4.3 Graphical representation of the data for 3 consecutive points in time ...88
Figure 4.4 Experiment components and relationships ...90
Figure 4.5 Performance degradation versus improvement through time ...93
Figure 4.6 Non-linear processing lengths, 5 trials, 500MB Chunks ...100
Figure 4.7 One point, multiple time behavior measures displayed on a virtual plane ...107
Figure 4.8 Time behavior representing peaks in occurrence 765 and 2343 ...108
Figure 4.9 End User feedback mechanism ...111
2
Figure 5.1 Bautista’s framework (Bautista, Abran, & April, 2012) ...119 Figure 5.2 Proposed model for end user performance perspective for cloud computing
systems using data center logs from Big Data technology ...123 Figure A.1 Sample anomaly screen for automatically detected anomalies………133 Figure A.2 Sample anomaly screen for voluntary performance anomaly registration……...133 Figure A.3 Naïve Bayes statistics for experiment 4.6.8.3……….133 XIX
3
LIST OF ALGORITHMS
Algorithm 4.1 Performance measurement validation simulation ...84
Algorithm 4.2 Experiment 1 data preparation ...87
Algorithm 4.3 Experiment 1 data organization ...87
Algorithm 4.4 Oozie coordinator Algorithm ...90
Algorithm 4.5 Feature extraction via Variance and Kurtosis analysis. ...94
Algorithm 4.6 Anomaly Detection employing Holt-Winters second-order algorithm ...98
Algorithm 4.7 Circumscribed polygon of N sides area calculation, Python ...106
Algorithm 4.8 Voluntary end user-feedback ...109
Algorithm 4.9 Interactive anomaly detection ...110
5
TABLE OF ABREVIATIONS
Abbreviation Description APIs Application Programming Interface
BSC Balanced Score Card
CC Cloud Computing
CCA Cloud Computing Application CCS Cloud Computing System CIF Common Industry Format COTS Commercial Off-The-Shelf CSV Comma Separated Value HDFS Hadoop Distributed File System IaaS Infrastructure as a Service
ICA Independent Component Analysis
IT Information Technology
ITSM Information Technology Service Management system KPI Key Performance Indicators
LLDM Low Level and Derived Measure MTBF Mean Time Between Failures NAS Network Area Storage
NIST National Institute of Standards and Technology
MAC Machine Address
PaaS Platform as a Service
PCA Principal Component Analysis PDCA Plan-Do-Check-Act
PMFCCA Performance Measurement Framework for Cloud Computing Applications
6
RAM Random Access Memory
RC Root Cause
SaaS Software as a Service SLA Service Level Agreement
S.M.A.R.T Specific-Measurable-Achievable-Relevant-Time Phased. SPQM-RM Software Product Quality Measurement Reference Model SQuaRE Systems and software Quality Requirements and Evaluation XXIII
7
INTRODUCTION
Performance measurement of information systems, which is the ability to complete a given task measured against known standards of accuracy, completeness, cost, and speed, is a challenging research topic. Measuring the quality of information systems has been a concern for organizations, academia and software engineers since the early days of information technology. In the 1970’s, Juran, a renowned quality expert, had already identified that measuring the quality of software, systems and Information Technology (IT) services is a challenging task (Juran & De Feo, 2010). This is, in part, caused by both the immaturity of software engineering as a science and that the industry as well as individual organizations are seldom able to keep up with rapidly evolving technologies (HP, 2013).
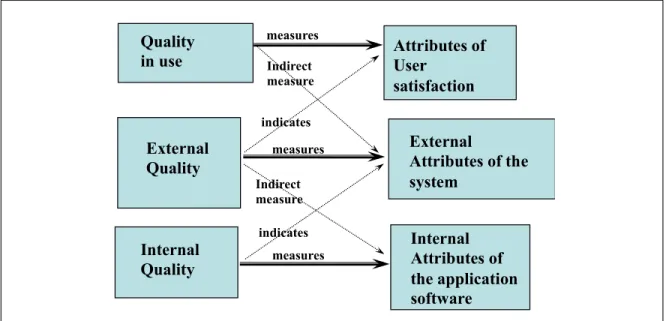
The measurement of a software used by an end user can be described from three main perspectives:
1) Internal quality perspective that measures how well built and maintainable is the application system.
2) External quality perspective which focuses on how well its underlying system infrastructure behaves to satisfy its end users.
3) Quality in use which is concerned with the end user perception when using the system to achieve daily tasks.
External measures try to reflect the actual utilization of the system by end users−one of the stakeholders of the software and the ones who use it to perform a task−to achieve their particular business goals (ISO/IEC, 2005). These perspectives and their interrelationships are documented in the ISO/IEC 25000 family of standards as described in Figure 0.1
There is a difference between the ISO software engineering standard definition of the quality perspectives of software performance measurement and the organizational, or business, perspective of software and IT performance. Software engineering performance, according to ISO, is related to the software construction, deployment and operational quality. Sustaining
8
high internal quality has the potential of offering greater end user (or external) quality, as long as it is well integrated with the operational environment. If this is achieved, it then has a better potential for achieving a high quality in use. It is also reported that if the end users are well trained and comfortable with using the software, the end user satisfaction (reflected in a high quality rating) will be high (Stavrinoudis, 2008). For high quality to be achieved, a number of factors must be controlled and measured to ensure success.
Figure 0.1 – Quality characteristics and attribute association (Bautista, Abran, & April, 2012)
Businesses, on the other hand, consider software to be a part of the service it renders to its customers; it is either useful or not to the organization in fulfilling its business goals (Bundschuh & Dekkers, 2008). This perspective of software system quality is focused mainly on the end results. This means that the utilization of software, and the resulting end user satisfaction, is the most important factor and is influenced by its availability and also by its performance. The usefulness is the ability of a software to solve organizational needs and is reported by Robert Glass as “the main criteria that the organizations use to state if a software is useful or not.” (Glass, 1998)
As presented earlier, measuring end user perception of system performance has been a concern of software engineering researchers since the early 60’s (Emery, 1964). Many experiments
Quality
in use Attributes of User
satisfaction External Quality External Attributes of the system Internal Attributes of the application software Internal Quality measures measures measures indicates indicates Indirect measure Indirect measure
9
about this topic have been designed, tested and validated (Buyya, Yeo, Venugopal, Brober, & Brandic, 2009) (Davis F. D., 1989) (Davis S. &., 2001) (Etezadi-Amoli & Farhoomand, 1996) (Fagan & Neill, 2004) (Law, Roto, Hassenzahl, Vermeeren, & Kort, 2009) (Mahmood, Burn, Gemoets, & Jacquez, 2010) (Tullis & Albert, 2010). Initially, these researchers used surveys with end users to understand the impacts of poor quality on their activities. It has been reported that using surveys in this context has important limitations, such as not being appropriate for following trends in real time, not providing a good source for cause and effect, having poor timing response, demonstrating low response rates and being vulnerable to responder bias (Couper, 2012). To minimize these issues and complement survey data, some form of automated, user-independent system performance measurement has been proposed over the years.
Literature reviewed on this topic describes how system performance measurement is conducted in many ways. One popular approach is to use data center logs as a source of information. This is popular because IT infrastructure (i.e. each component of the IT infrastructure) produces readily available operational data that are reported in the daily logs of its operational systems, applications, computers and telecommunications equipment (all of which we will call components in this thesis). These logs are often composed of binary files that include data from different components comprised in a system (the term "system" includes hardware and software in this thesis). Logs contain large quantities of data and are typically stored in a file or a database for further analysis when needed. Recently, many commercial, open source, and easily accessible log tools are available for collecting, analyzing and generating performance dashboards that present different measures of the IT infrastructure components used by an information system ("information system" is the application used by an end user in this thesis) (Microsoft, 2013) (Kopp, 2011) (Omniti Labs, 2014) (Agendaless Consulting and Contributors, 2017) (Tidelash Inc, 2017) (Massie, 2012) (Munin and colaborators, 2017) (The Cacti Group, 2017) (Nagios, 2013) (Zabbix, 2017) (Observium Limited , 2013) (Zenoss, 2013) (Forster F. , Collectd Open source project, 2017) (Weisberg, 2013). How these log measures are analyzed and interpreted and how these measurement results reflect the organizational goals, especially the end user’s perspective of system performance, are still to be resolved and
10
are part of the objectives of this research (St-Amour, 2011). One promising theoretical proposal to address this problem was submitted in a recent PhD dissertation by Luis Bautista entitled: "A Performance Measurement Model for Cloud Computing Applications". His theory and limited experimentation is described in greater detail in section 2.3, where we explore what has already been attempted by other researchers and how this research can contribute to help solve this problem.
As early as 1996 (Laguë & April, 1996), research showed that systems performance measurement using internal measures issued from data center logs tend only to measure the internal and very technical quality perspectives of an information system. This is why the end user performance perspective is often inferred, estimated, approximated and even sometimes guessed at based on experience and only sometimes using log data that may or may not directly affect the actual user’s perceived performance according to the observer’s perspective and experience (Huffman, 2017) (Friedl & Ubik, 2008) (Kufrin, 2005). As an example, data center analysts have observed that whenever a desktop’s processor reaches 100% of utilization according to the performance logs, the end user experience, that is, what the end user perceives while using that specific information system at that specific moment, is degraded (Bundschuh & Dekkers, 2008). It has also been reported that a very high level of utilization of a particular component is not always a guarantee that it directly affects the performance experience of the end user at that time. This has also been reported in publications in the field of reliability engineering (Denney, 2005), where a stressed system with different levels of stress applied to each of its individual components (i.e. different components are placed under distinct stress levels, aiming for a balanced cost effectiveness of the software-hardware-communications arrangement) did not necessarily affect the performance of the system as perceived by its end users (Rapoza, 2015) ( CA Technologies, 2014). For example, scenarios where the end user isn’t interacting with the system but the performance is deemed as “bad” at that time represent a false positive, as the individual was not there to perceive it and consequently was not affected. Other scenarios where the quality is considered as degraded by the end user but was not properly measured by the internal and external measures have also been reported as false negatives (Mahmood, Burn, Gemoets, & Jacquez, 2010) (Tullis & Albert, 2010).
11
ISO 9141-10 defines end user experience as "a person's perceptions and responses that result
from the use or anticipated use of a product, system or service" (ISO, 2009). This definition
relates to human emotions, evidence that the end user experience is dynamic, context-dependent and subjective (Law, Roto, Hassenzahl, Vermeeren, & Kort, 2009). Information systems performance measurement, on the other hand, focuses on collecting quantic (i.e. quantitative, measurable and scalable) data to determine how the end users employ the system. This data can then be interpreted, compared with the organizations’ benchmarks (Castor, 2006), the data center analyst’s empirical proof and personal experience and with this system's typical daily operation, in order to give an opinion on the presence or absence of degraded performance ex post facto. Law, Roto et al. reported that the many log measures collected by any of the many available automated log data production tools always need to be interpreted by different stakeholders allowing for an interpretation in the organization context, that is, interpreting (the measure) and how it feels (the end user experience). This is a great source of debate and research both in academia and in today’s organizations (ISO, 2009).
One characteristic of performance logs that should also be highlighted here is that there is little or no control over the quality of the design of the existing measures created by the individual software developers which are in turn used on this research. Software measurement theory insists that the design phase of a measurement process requires that both the direct and indirect measures collected should measure either the measurand, the perceptible portion of the software execution, or a model of its interaction with the real world. Additionally, the measurement process or model should aim to build a consensus on what will or will not be measured, describing the entity and the attribute, and documenting an adequate model that characterizes the attributes and their relationships. In this thesis, the quality of the resulting measurement model will be assessed by following the activities proposed in the recent Software Metrics and Software Metrology book published in 2010 by Dr. Alain Abran (Abran, 2010).
The recent, rapid and broad adoption of cloud computing technology (Weinman, 2009) by organizations presents many operational challenges in measuring system performance. Cloud
12
computing allows for the development of fragmented systems with multiple distinct components that rely on the performance of complex IT infrastructures that often include components that are dispersed geographically, are shared and distinct, often concurrently executing software (Mirzaei, 2008) (Mei, Liu, Pu, & Sivathanu, 2010). This rapidly emerging technology uses recently developed and emerging hardware and software technologies to deliver ubiquitous, resilient, scalable, billed-by-use, application agnostic systems (Prasad & Choi, 2010). Cloud computing technology is often categorized by three different service models:
1) Infrastructure as a Service (IaaS). 2) Platform as a Service (PaaS). 3) Software as a Service (SaaS).
To add to the complexity of this emerging technology, each of these service models can be hosted within an organization or supplied by third parties.
With this emerging technology, the challenges associated with the collection of data that is physically and logically displaced amongst different service providers and over different hardware is a major concern (Gilbert, 2011) (Trappler, 2011). For example, let’s look at a very common infrastructure used by a typical internet-based information system:
1) Has a web page.
2) Runs on a distributed web server.
3) Is hosted on a clustered, multi-homed hardware. 4) Accesses a database that has local and remote content.
This is a very simple example. Organizational reality can get much more complicated. When using this information system on cloud computing technology, issues like the location of the data, the ownership of the servers, the accessibility of the logs, the security and privacy on the shared resources and the quality of the service provided are now pressing concerns for the organizations (Prasad & Choi, 2010) (Dillon, Wu, & Chang, 2010).
13
These new technologies pose interesting challenges. For example, cloud computing applications and their supporting infrastructures, when measured, generate large amounts of measures (Buyya, Yeo, Venugopal, Brober, & Brandic, 2009). When an end user reports degraded performance of the application software he currently uses on a cloud computing infrastructure, how can the data center analyst diagnose, and potentially prevent, such problems? What are the techniques and technologies that allow for a better understanding of performance monitoring and performance management using these new cloud computing technologies? (Jackson & Ramakrishnan, 2010)
Cloud computing performance measurement is an emerging research topic and is currently addressed by different authors. Some empirical approaches propose that automated software be used to simulate access to services, then measure response times (Suakanto, Supangkat, & Suhardi, 2012). Third-party performance evaluation services propose comparative tests amongst different providers (Pivotal Software, 2013) (Gartner, 2013) (Avran, 2010). When considering these proposals closely, very few details of how this is done are provided. Other approaches suggest the collection of internal measures of different service configurations over the same infrastructure (Meijer, 2012). Finally, Croll suggests that cloud performance should be approached from a business perspective first and the use of internal measures be considered afterwards (Croll, 2013).
Although there are numerous proposals, they all fall short of the goal of our main research question: how can the end user performance perspective of cloud computing based applications be modeled so that a timely analysis of the data can be enacted upon?
The literature review has helped summarize the state of the art in end user perspectives of systems performance. The review concludes that the end user perspective is rarely addressed, is not explained in detail when it is and is still not solved for cloud computing based applications. Beginning with a theoretical and unimplemented model proposed by Bautista, “A Performance Measurement Model for Cloud Computing Applications” (Bautista, Abran, & April, 2012), this research will design a novel model for the end user performance perspective
14
for cloud computing systems using data center logs from Big Data technology that not only expands Bautista’s original theory by enhancing the original proposal, it will test the theory in a large scale private cloud case study, propose the use of a performance indicator and include end user feedback in order to validate and potentially forecast possible performance affecting anomalies.
Additionally, Bautista’s research considered that the measures, once associated with a performance concept, would be used in adapted formulas to represent the referred concept. In this research, a particular combination of measures is only considered relevant at an individual point in time and proposes that the particular performance concept be represented as adequate or degraded depending on a combination of not only the associated characteristics, but of the whole application delivery chain. This representation is discussed in detail in section 4.6. The proposed measurement model will include both internal measures, directly collected from performance logs, as well as context-dependent, end user interactive satisfaction measures as suggested by previous researchers (Law, Roto, Hassenzahl, Vermeeren, & Kort, 2009) (Marshall, Mills, & Olsen, 2008) (Etezadi-Amoli & Farhoomand, 1996) (Baer, 2011). Experimentation in a large scale private cloud case study will explore if this proposed approach offers advancement for this problem compared with previous proposals and the state of the art.
As stated earlier, this research proposes that log data be collected during the experimental part of this research to validate the proposed measurement model. This will be performed on an actual private cloud computing information system and consequently will process very large amounts of data in real time. Log data will become increasingly larger as each experimentation iteration will increase the size of our experimental database. One possible solution for processing very large quantities of data, in real-time, is the utilization of recent and emerging Big Data technologies (Cohen, Dolan, Dunlap, & Hellerstein, 2009) (Trelles, Prins, Snir, & Jansen, 2011) such as the Hadoop Distributed File System and Apache Spark. These technologies can process data from multiple sources and individual log files simultaneously. This could prove to be difficult using a classic SQL-based technology (Reeve, 2012). Big Data cluster computing parallel programming approaches have recently been used successfully and
15
have shown to be useful for processing large performance logs (Rabl, 2012) (Dean & Ghemawat, 2008).
In summary, the objective of this research is to design a novel measurement model that includes a performance management framework that allows for the modelling of the performance, as perceived by the end user, of a cloud computing-based information system. This model shall employ, as much as it is possible, data center log measures currently in use in the industry for the convenience of their wide availability and the technical familiarity for data center analysts. Finally, this model should facilitate the future implementation of some form of performance management technique such as an SLA (Service Level Agreement) audit or continual improvement process. Finally, utilization of the end user feedback in the model will provide additional validation for the proposed anomaly detection model. A test for forecasting anomalies using the model will be attempted using a simple forecasting mechanism to explore if the present research can be further improved upon in the future.
In order to achieve this objective, a research methodology comprised of seven sub-steps is proposed and further explained in section 1.5:
1) Phase 1 – associating end user satisfaction with low level and derived measures (LLDM) extracted from performance logs.
2) Phase 2 – mapping LLDM measures into the Performance Measurement Framework. 3) Phase 3 – Validation of the quality measures using a validation method (Jacquet &
Abran, 1998).
4) Phase 4 – Laboratory experiment for end user performance modeling.
5) Phase 5 – Design of an automated mechanism for end user performance modeling and proposition of a performance measurement model.
6) Phase 6 – Experimental validation of the proposed end user performance model. 7) Phase 7 – Discussions of the end user performance model’s abilities and shortfalls.
CHAPTER 1
Research Introduction
1.1 Motivation
It has already been stated that managing IT infrastructure has been a challenge since the early days of the implementation of information systems in organizations (e.g. technology, data, and knowledge level of end users) (Laudon & Laudon, 2013). The accelerated adoption of recent technology, such as the emergence of new and highly mobile technologies, distributed knowledge, real time collaboration as well as growing competition have increased, or, more specifically, have constantly increased the complexity of information technology. In order to be able to compete, are companies leveraging their information systems in a way that enables end users to be as productive as possible? Are the investments required to keep these increasingly complex systems and infrastructures efficient really spent in a way that ensures a firm’s competitiveness?
As we approach information systems as an ensemble of technology, information, knowledge and people, performance measurement becomes increasingly difficult to precisely define. When performance of an application system is measured, the goal is generally the reporting of a measure, usually mathematical or percentile, that explains how the system performs in the form of 0% - 100% of an N-dimension resource consumption: what does 0% resource consumption mean? What does 30% utilization mean? And what does 100% resource consumption mean? Who is concerned with these measurements being either high or low?
Goodhue and Thompson propose possible answers to these questions. A good management approach states that resources should be applied in such means that end users should be able to fulfill their task based on the “Fitness to Task Theory” (Goodhue & Thompson, 1995). This means consuming the least possible amount of resources with the help of techniques like the “Resource Allocation Matrix Theory” (Martensson, 2006). For example, measuring using an interval, such as from 0 – 100, would be just a quantitative way of measuring if an end user is
XVIII
capable of completing a specific task using the available resources. On the other hand, Davis highlights that both resource availability and end user capability are directly dependent on the end user’s motivation to actually fulfill tasks as described in the “End User Acceptance Theory” (Davis F. D., 1989). This theory is a derivation from two other research results: 1) the “Theory of Reasoned Action” (Fishbein & Ajzen, 1975) which is a widely used model from social psychology that describes performance, for a particular action, as a result of a person’s intention, attitude and subjective norms towards that action; and 2) the “Technology Acceptance Model” (Davis F. D., 1989), which describes that the resulting use of a system is a result of the end users intention to use it, weighted by the attitude of perceived usefulness and ease of use, as well as other external variables.
Fundamental to the “End User Acceptance Theory” is the author's use of a seven question “Likert Scale” for measuring time effectiveness, ease of use, improved quality, exclusivity, accessibility, dependability and refutability of the end user's use of a particular information system. This was presented to the end users of a particular information system in scenarios of both brief-exposure (e.g. a one-hour hands-on controlled experiment) as well as direct interviews at the end of the school semester. The outcomes that concern this particular research is that perceived usefulness, which is what the information system does to help the end user to achieve his goal, and perceived ease of use, which is how effortless it is to perform the said actions, were the key factors found to impact the end user’s acceptance and thus the perceived quality of an information system. The information system analyzed by this case study was a simple text processing program. In this case, it is easy to understand the task that has to be performed and the increase in performance in comparison to the alternatives: either handwriting, using an old-fashioned typewriter or even the use of a different text processing software. The same parallel is valid for the concept of ease of use; features like auto correction, automatic saving and the ability to work with revisions can be compared to alternatives that would give the end user the impression of what is easier to use. It is reported that this early research approach is still a fundamental concept employed by many recent software engineering research approaches to the study of end user acceptance of different information systems (Hambling & van Goethem, 2013). The emergence of cloud computing technologies 18
XIX
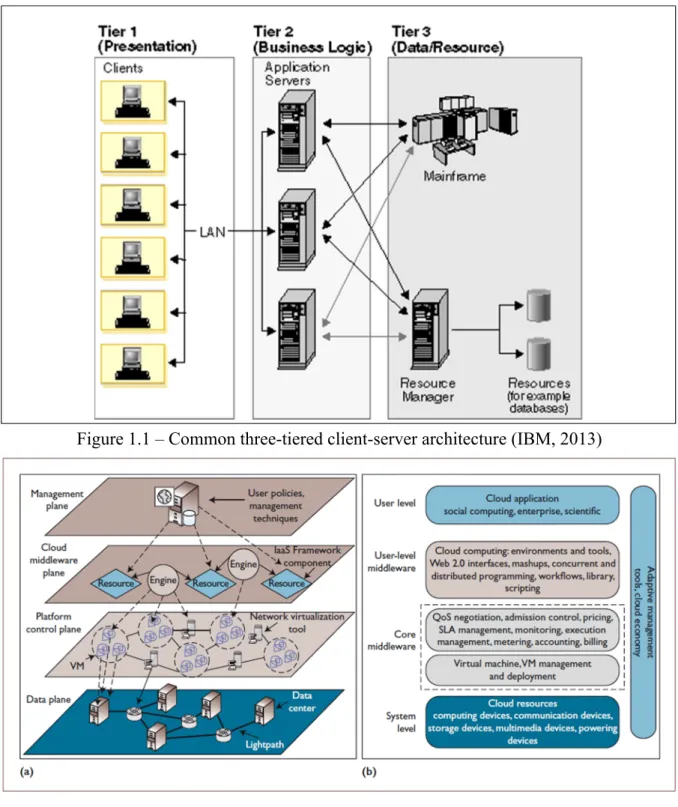
adds complexity to this measurement approach. Figures 1.1 and 1.2 demonstrate the difference between an older IT client-server architecture versus a modern cloud computing architecture used by an information system.
Figure 1.1 – Common three-tiered client-server architecture (IBM, 2013)
Figure 1.2 - Cloud computing architecture (Martensson, 2006)
XX
In a cloud computing environment, after an end user is trained on a specific information system and engages in its daily execution, what components between his end user interface and the data repositories and processors should be included in order to actually measure (or try to measure as accurately as possible) the end user's perceived performance when using the information system? One of the possible approaches to measuring performance from the end user perspective is the industry default approach of data center log analysis. This practice is already used for numerous applications as both a troubleshooting and a monitoring technique. To cite a few, data center logs are present in different operational systems, types of hardware and applications (also called components in this thesis), and the resulting operating information is created at different granularity levels (Agendaless Consulting and Contributors, 2017) (Kopp, 2011) (Bundschuh & Dekkers, 2008) (The Cacti Group, 2017) (Friedl & Ubik, 2008). Employing log files for modeling the end user perceived performance of the information systems in use could be an approach that reveals itself to be both simpler and more easily automated than performing the end user acceptance theory and interviews of all the end users of a cloud computing application as proposed by the fundamental theory presented in the previous section.
Performance measurement frameworks for cloud computing applications (CCA) are still in the early stages of research (Bautista, Abran, & April, 2012). Adoption of cloud computing technology by the industry is also in its early stages (Phaphoom, Wang, & Abrahamsson, 2012) (US General Service Administration, 2010). The study of cloud computing performance management has the potential for innovative research, particularly in conjunction with the utilization of recent very large volume data processing technologies such as Big Data (Lin & Dyer, 2010).
With this understanding, we now have a possible solution for addressing this research question by designing a performance measurement model and experimenting with it in a real cloud computing world setting, where a variety of complex and interconnected individual IT infrastructure components can be measured using emerging Big Data technologies. The proposed measurement model would include measures from the information system and its IT
XXI
infrastructure components to provide an end user perspective of the performance of the information system. Once these measurements are collected and related to each other, there is an opportunity to model the perceived performance from the end user’s perspective over time and maybe even predict it. To achieve this goal, many research activities will have to take place. Here is an overview of the proposed research method steps considered in regards to this question. Beginning with Bautista’s theoretical and unimplemented model (Bautista, Abran, & April, 2012), we identify specific performance measures currently available from the data center logs of an actual private cloud computing application, expanding the initial model that only used a partial set of controlled measures with the addition of end-to-end measures that represent the complete cloud computing application delivery chain, including the end user performance perspective.
It is important to note that performance log measures may not be sufficient to completely model the end user perceived performance. The following scenario can explain this: it is possible that a component, at in any given moment, is performing an action while unattended. If this action consumes many resources, modeling the performance only by monitoring the logs would create a false-positive. In a similar way, if a problem occurs with a component for which the measure wasn’t automatically identified as important but affects the end user, the model wouldn’t flag that particular situation as a problem, resulting in a false-negative. Many authors reported the importance of end user feedback as an additional validation for understanding the actual perceived performance of an information system at a given moment.
A possible solution to this problem is correlating candidate measures that are extracted from the performance logs with end user performance degradation reports for the different components in order to identify potential systemic issues that degrade the performance across multiple components. This can be complemented by an anomaly detection process, performed on the analyzed logs, in order to identify if a particular point in time has potential performance degradation. The result of the anomaly detection along with the end user's feedback could then be used to compose a degradation scenario. To some extent, the possibility of the occurrence 21
XXII
of degradation events could potentially be forecast. This solution scenario will be further discussed in section 2.3.3.
1.2 Problem definition
Measuring the performance of an information system from the end user perspective is a complex task. First, internal software performance concepts, measured through a number of internal measures, must be correctly defined, designed, then validated to ensure the measurement correctly produces what it is supposed to measure. Secondly, these internal measures must be transformed or translated into information (e.g. external measures) and applied/communicated to yield results within the decision time specified or required by the organization. Finally, these measurement results need to be exploited/interpreted by some form of intelligent mechanism that may either be machine or human in order to infer significance to the measurement and potentially take preventive actions.
These quantitative measures, when collected with a high level of granularity (for example, one value per second per measure) will quickly accumulate in a large data repository. Initial experimental estimates indicate that each host, network device and server can generate 800 KB of data per minute. For this organizational case-study network, this could reach 1.2 GB and ~800000 columns per minute. By comparison, this is more than 80 times bigger than the highest recommended configuration for the most recent SQL databases (US General Service Administration, 2010). Considering such a challenging experimental scenario, the problem definition of this research can be summarized as: modeling end user experience on cloud computing environment with the proposition of a performance measurement model, using data currently available from data center logs and gathering end user feedback as needed and if possible, and, because of the amount of data, employing emerging Big Data technology such as Spark, for its capture and experimentation. If the use of the data center logs is insufficient, additional feedback mechanisms will be proposed.
XXIII
1.3 Research question
Given the opportunities for discovery in the field of software performance measurement from an end user perspective using cloud computing technology, this research focuses on the proposition of a performance measurement model considering two main objectives: 1) Is it possible to measure and analyze the performance of an information system operating on the cloud, from an end user perspective, using only data center log data?; 2) What are the useful internal measures among all of the available measures that would reflect the application software performance as perceived by its end users?
The general research question can be formulated as: how can end user perceived performance of an information system be measured in a cloud computing environment? This question is then segmented in the following four specific research questions:
1) What defines a cloud computing environment?
2) What influences the end user performance perspective measurement in a cloud computing environment?
3) Are performance logs sufficient for modeling the end user performance perspective? If not, which other sources are required?
4) Can the theoretical proposal of the performance measurement framework for CCA (Bautista, Abran, & April, 2012) be used for the creation of a performance model using data center logs that represents the end user performance perspective of an application using cloud computing technology in a timely fashion?
1.4 Methodology
In order to answer the research questions outlined in the previous section, the software engineering research methodology proposed by Victor Basili (Basili, Selby, & Hutchens, 1986) is used to plan this research and is described using four main research activity phases: 1) definition of the research, 2) planning, 3) development of theory and experimentation and 4) interpretation of the results which are presented in sections 1.4.1 to 1.4.4.
XXIV
1.4.1 Definition of the research
This first research phase, presented in Table 1.1, clarifies the research motivation, objective, goal and end users.
Table 1.1 - Research Definition
Motivation Objective Goal Users
The design of a performance
measurement model that reflects the end user experience for an information system operating on a cloud computing
environment.
. Define/clarify the notion of end user performance perspective;
. Define/Clarify the cloud computing technology;
. Identify the data center log direct measures that best reflect the end user perspective of an application operating on a cloud;
. Design a measurement model and its toolset to support the infrastructure specialist in proactively managing the cloud infrastructure to identify the performance issues from the end user’s perspective.
Design a performance
measurement
model and its prototype that is
capable of representing the end user experience of an application operating on a cloud by mainly using data center measures currently
available in commercial and open source tools.
Students, researchers, IT professionals and managers.
This next phase presents the specific planning of research activities that have to be achieved in order to meet the objective.
XXV
1.4.2 Planning
The planning phase contains the description of deliverables which address each of the four research questions. This research begins with the required literature reviews (see Table 1.3).
Table 1.2 - Research Planning
Planning Steps Inputs Outputs
State of the art of the concept of end user quality/performance perception when using an information system Literature review: . Software Engineering performance;
. End user expectation and perception of information system performance;
. End user performance perception, and other psychosocial entities that affect end user performance perception.
-Literature review of the state of the art of containing IS performance standards, models, techniques and methods;
-State of the art of the end user performance perspective for cloud computing- based systems.
State of the art of cloud computing and Big Data technology for data
center log processing
Literature review:
. Cloud computing technology, components, types and utilization; . Existing data center log data analysis;
. Apache Spark project documentation;
. REAP project data.
- Literature review of existing data center log uses and techniques for its analysis, open source Big Data technology and corroboration of the Cloud computing syllabus by matching of components with the experiment’s infrastructure;
-First publication: proposal on how to measure performance as perceived by the end user that uses cloud applications.
XXVI
1.4.3 Development of theory and experimentation
The development phase of this research presents activities that support new knowledge and theories. It also describes the definition and preparation required for the experimentations and validations as well as the key research activities that attempt to answer the main research question. In order to address this, we segment the task into the following research sub-steps:
1) Association of end user performance with LLDM measures. 2) Mapping LLDM into the Performance Measurement Framework.
3) Validation of the quality measures using a validation method (Jacquet & Abran, 1997). 4) Laboratory experiment for end user performance modeling.
5) Expanded laboratory experimentation.
6) Design of an automated mechanism for end user performance modeling and proposition of a performance measurement model.
7) Validation of the automated model. 8) Proposition of the model.
1.4.3.1 Association of end user performance with low level and derived measures
Measuring end user perceived performance and satisfaction with the use of an information system has already been presented by several researchers (Baer, 2011) (Buyya, Yeo, Venugopal, Brober, & Brandic, 2009) (Davis F. D., 1989) (Davis & Wiedenbeck, 2001) (Etezadi-Amoli & Farhoomand, 1996) (Fagan & Neill, 2004) (Law, Roto, Hassenzahl, Vermeeren, & Kort, 2009) (Mahmood, Burn, Gemoets, & Jacquez, 2010) (Marshall, Mills, & Olsen, 2008) (Tullis & Albert, 2010). In these publications, end user performance and end user satisfaction were identified as intrinsically interdependent, meaning that whenever end users where satisfied with information systems these proved to be well performing, and vice versa. These research results were mostly based on conducting surveys and interviews with the end users in order to identify factors, determine performance and evaluate information system
XXVII
quality. One of the challenges of this research is mapping measures to end user performance characteristics. Assuming that a way for the end user to communicate the dissatisfaction with a system is to present a complaint, a survey could be performed on these complaints, and, in this survey, identify the events where the end user was not satisfied with the system’s performance. The performance logs of these events could be investigated to look for evidence of which measures were in a degraded state at the time reported for each of the events. This could lead to a non-exhaustive list of measures and states reported for moments of end user dissatisfaction.
1.4.3.2 Mapping low level and derived measures into the Performance Measurement Framework
Measuring the performance of cloud computing-based applications using ISO quality characteristics is a complex activity for various reasons. Among them is the complexity of the typical cloud computing infrastructure on which an application operates. Beginning with the quality concepts proposed in the ISO 25010 standard (maturity, fault tolerance, availability, recoverability, time behavior, resource utilization and capacity) this research maps the collected measures into the performance concepts by associating the influence of each particular measure in regards to the concepts. This is fundamentally different from Bautista’s proposition where the measures are manually associated to the performance concepts and the formulae are built depending on the context selected. In the present research, the combination for particular measures is only relevant for that particular moment in time and, for another observation, different measures can fulfill the same concept. This is explained in detail in section 4.
1.4.3.3 Validation of the quality measures using a validation method
Jacquet and Abran (Jacquet & Abran, 1998) propose a validation framework for software quality measures which address three main validation issues: 1) the validation of the design of the measurement method; 2) the application of the measurement method; and 3) the predictive
XXVIII
system. This measurement validation framework is based on a measurement model which is detailed in Figure 2.5 and presented later in this thesis. For this research, we use the results of sub-steps 1.4.3.1 and 1.4.3.2 using this model and conduct 3 experiments: 1) the validation of the representation theorems; 2) the application of different numerical values to these rules in order to simulate the response of the theorem; and 3) the proposition of a quality model.
1.4.3.4 Laboratory experiment for end user performance modeling
This sub-step will consider the measures collected during sub-step 1.4.3.1 and the validated mapping to the measurement framework from sub-steps 1.4.3.3 and 1.4.3.4 to manually create an end user performance model for the experimental case study. The objective is to gather information for the creation of an automated solution that would be able to respond to the information needs of the decision makers in a timely manner. This experiment will also attempt to represent the end user performance perspective in a graphical manner, facilitating the interpretation of results. In this experiment, we will also determine if the log data is sufficient for modeling end user performance perspectives.
1.4.3.5 Expanded laboratory experimentation
Leveraging the outcomes of sub-step 1.4.3.4, this next step will expand the initial population to a larger infrastructure of servers and desktops, aiming to target approximately 500 servers and 30000 end users in North America. The objective of this is to verify the reproducibility and expandability of the earlier findings. If the log data has been found to be insufficient in the previous sub-step, a feedback mechanism will be proposed during this sub-step in order to gather further information about the user’s perspective under different information system performance scenarios, such as where there is evidence of degradation, evidence of good performance, lack of end user complaints or increased end user complaints.
XXIX
1.4.3.6 Design of an automated mechanism for end user performance modeling and proposition of a performance measurement model
With the utilization of emerging Big Data technology, it may be possible to design an experiment that will apply the measurement rules and allow for the analytic functions to model the performance as perceived by the end user in a case study.
1.4.3.7 Validation of the automated model
This sub-step is a repetition of sub-step 1.4.3.3 and aims at validating the automated model using the same process.
1.4.3.8 Proposition of the end user performance model for cloud computing applications
This is the final sub-step of this research that will propose a model for end user perceived performance of the information system operating on a private cloud. This model will be based on the results from the previous sub-step and might include, if necessary, a self-reporting mechanism where the end users can point to a degraded performance. Additionally, this proposed model will include a prototype using a Big Data processing cluster-based on Spark in order to test machine learning algorithms capable of predicting end user behavior given the analysis of the performance time series.
1.4.4 Interpretation of the results
This section contains the planned activities for properly understanding the methods, use cases, scenarios and results that will be obtained during the experimentation of the proposed model, as well as for providing grounds for conducting future research.