Université de Montréal
Residential choice and sustainability
Comparing people and place performances in sprawled city
Simin Lotfi
Faculté de l’aménagement, École d’urbanisme et d’architecture de paysage
Thèse présentée à la Faculté des études supérieures et postdoctorales en vue de l’obtention du grade de Philosophiae Doctor (Ph.D) en aménagement
17 Janvier 2017
i
RÉSUMÉ
Cette thèse examine la performance de durabilité du comportement des ménages et les compare à leur lieu de résidence. Elle porte sur un sujet novateur et important. Les résultats apportent un éclairage singulier sur la complexité des liens qui unissent comportements résidentiels et des milieux de vie en matière de durabilité. Dans le but d'identifier les variables pour évaluer la durabilité du comportement, elle étudie les preuves scientifiques. Les résultats montrent que les indicateurs utilisés le plus souvent pour évaluer la durabilité des lieux de résidence représentent l'environnement bâti en relation avec sa forme, avec ses fonctions et avec sa densité, ainsi que ses caractéristiques socio-économiques. Pour évaluer la durabilité du comportement, des indicateurs multiples de différentes natures sont utilisés. Ces derniers sont environnementaux, sociaux, économiques et les modes de transport de la mobilité quotidienne, ainsi que l'espace et le temps parcourus. Les liens trouvés entre la performance de durabilité des lieux et les comportements sont décrits comme correspondant ou ayant un manque de congruence. Un cadre d'inventaire est proposé pour aider à étudier la performance du choix résidentiel concernant les trois piliers de la durabilité. Pour ce faire, un groupe de 740 ménages, avec au moins un répondant travaillant à temps plein, est analysé. La base de données est «Demain Québec» : un sondage en ligne réalisé auprès des résidents de la région métropolitaine de Québec, et ce, détaillant leurs profils socioéconomiques, résidences et caractéristiques de mobilité. Pour évaluer la durabilité du comportement, une analyse en composante principale est effectuée sur 20 variables. Six facteurs représentant 74,9% de la variance sont extraits. Ils sont les suivants: 1) la dépendance au véhicule, la distance globale parcourue, et les coûts économiques 2) l’intensité globale d’activité, 3) l’intensité d'activités récréatives et les distances parcourues, 4) l’intensité d'activités de magasinage et les distances parcourues, 5) les distances parcourues dans les transports en commun et les dépenses temporelles et 6) les dépenses de logement et les distances parcourues moyennant le transport actif. Ces facteurs sont soumis à l’analyse Two-step Cluster conduisant à l'identification de sept profils comportementaux: « Immobile Shoppers », « Immobile Recreationist using Public Transport », « Savers-on-Time and Spenders-on-Housing », « Mobile Individuals using Public Transport », « Mobile
ii
Individuals using Active Transport », « Hypermobile Shoppers using Car », and « Recreationist using Car ».
Pour évaluer la performance de durabilité des lieux et pour la comparer aux profils de comportements, nous utilisons le Walk Score. Pour certains profiles, les résultats confirment la correspondance entre la performance des lieux et des ménages, alors que pour d’autres, l'influence de la localisation semble être perturbée par les caractéristiques socio-économiques des ménages. Dans certains groupes, ces indicateurs ne tiennent compte ni de la congruence ni de la discordance entre la durabilité du lieu et de la durabilité du comportement. Ce sont plutôt les activités dominantes des ménages par rapport à l'endroit où elles se déroulent qui jouent un rôle crucial dans la prospérité durable. Dans la dernière étape, la thèse examine la désirabilité de choix résidentiels durables conçue comme satisfaction acquise et aspiration future. Cet examen se base sur les typologies comportementales développées à l'étape précédente. Les résultats montrent que des choix résidentiels à la fois durables et désirables sont possibles. Cependant, les ménages qui font de tels choix sont moins satisfaits de la verdure, de la tranquillité, de l'ambiance, de la sécurité et des caractéristiques des voisins. En outre, les sources d'insatisfaction ne constituent pas nécessairement les intentions de déménagement. Les principales raisons de déménagement sont souvent liées au désir de devenir propriétaire ou d'avoir accès à une résidence plus grande. Pour ce qui est des choix de logements, les ménages tiennent surtout compte des caractéristiques environnementales qui correspondent à leurs besoins et à leurs objectifs à un stade particulier de leur vie et à leurs activités dominantes. Bien que le milieu bâti joue un rôle majeur dans la réalisation de choix durables et désirables, les ménages sont les protagonistes de l'amélioration de la prospérité durable.
Mots-clés : Choix résidentiel, Comportements des ménages, Performance de durabilité, Enquête quantitative, Analyse typologique
iii
ABSTRACT
This thesis examines the sustainability performance of households’ behaviors and compares it to their place of living. This thesis deals with an innovative and important subject. The results shed light on the complexity of the links between residential behaviors and the living environment regarding sustainability behaviors. With the aim of identifying variables to evaluate behavioral sustainability, it investigates the scientific evidence. The results show that the indicators frequently used to assess the sustainability of the places depict the built environment regarding its form, functions and density, and its socio-economic features. To evaluate the behavioral sustainability, multiple indicators are used of different natures, that is, environmental, social, economic, and transport modes related to daily mobility, as well as traveled space and time. The links found between sustainability performance of places and behaviors are described as matching or lacking congruity. An inventory framework is proposed to help to study the performance of residential choice concerning the three pillars of sustainability. Applying this framework, a group of 740 households with at least one respondent working full-time is analyzed. The database is « Demain Québec » an Internet survey of residents of the Quebec City metro area detailing their socio-economic profiles, residences and mobility characteristics. To assess the behavioral sustainability, a principal component analysis is performed on 20 variables. Six factors are extracted accounting for 74.9% of the variance. They are as follows: 1) Car dependency, global travel distance, and economic costs, 2) Global activity intensity, 3) Recreational activity intensity and travel distance, 4) Shopping activity intensity and travel distance, 5) Travel distance in public transport and global travel time costs, and 6) Housing expenditures and global active transport distance. These factors are put on to a two-step clustering analysis leading to identification of seven behavioral profiles: « Immobile Shoppers », « Immobile Recreationist using Public Transport », « Savers-on-Time and Spenders-on-Housing », « Mobile Individuals using Public Transport », « Mobile Individuals using Active Transport », « Hypermobile Shoppers using Car », and « Recreationist using Car ».
To assess the sustainability performance of places and to compare it to the profiles of behaviors, we use the neighborhood Walk Score. The results confirm the correspondence between place and people’s performance for some profiles, while for the others, the influence
iv
of location seems to be interfered by socio-economic characteristics of households. In some groups, neither these indicators do not account for the fitness or discrepancy between the both. It is rather the households’ prevailing activities in relationship with the location in which they go on that plays a crucial role in sustainable prosperity. In the final step, the thesis examines the desirability of sustainable residential choices, understood as satisfaction-with and aspiration for, based on the behavioral typologies developed in the previous step. The results show residential choices that at once sustainable and desirable are possible. However, households who make such choices are less satisfied with the greenery, quietness, and ambiance, security, and characteristics of neighbors. Also, sources of dissatisfaction does not necessarily drive the moving intentions. The main reasons for moving are often connected to the desire to become a homeowner or having access to a larger residence. On their residential choice decisions, households regard mostly the environmental features which are in accordance with their needs and goals at a particular stage in their life’s course, as well as their dominant activity. Although the built environment plays a major role in the achievement of desirable sustainable choices, the households are the protagonist in enhancing sustainable prosperity.
Keywords: Residential choice, Household behaviors, Sustainability performance, Quantitative survey, Cluster analysis
v
TABLE OF CONTENTS
RÉSUMÉ ... i
ABSTRACT ... iii
TABLE OF CONTENTS... v
LIST OF TABLES ... viii
LIST OF FIGURES ... i
ACKNOWLEDGMENT ... ii
CHAPTER 1 INTRODUCTION ... 4
1.1 Research problems and questions ... 4
1.2 Research aims and objectives ... 6
1.3 Research Significance ... 7
1.4 Outline of thesis ... 8
CHAPTER 2 DOES “WHERE WE LIVE” REFLECT “WHAT WE DO”? AN OVERVIEW OF EMPIRICAL EVIDENCE ON PLACE-PEOPLE CORRESPONDENCE WITH REGARDS TO SUSTAINABILITY PERFORMANCE (Article 1) ... 11
2.1 Abstract ... 11 2.2 Introduction ... 11 2.3 Method ... 11 2.3.1 Search Strategy ... 13 2.3.2 Corpus Description ... 13 2.4 Results ... 21
2.4.1 Operationalizing the sustainability performance of people-place interaction ... 21
2.4.2 Which imperative of sustainability is evaluated in the studies? ... 23
2.4.3 How congruent are place and people’s sustainability performance? ... 24
2.4.4 Why are the sustainability performance of place and behaviors related in such ways? 25 2.5 Discussion: Learning outcomes ... 29
2.5.1 Sustainability is the results of a complex interplay of factors ... 30
2.5.2 Sustainability performance is hard to evaluate ... 31
vi
CHAPTER 3 RESEARCH METHODOLOGY ... 33
3.1 Introduction ... 33
3.2 Research strategy ... 33
3.3 Research design ... 36
3.4 Description of the survey ... 39
3.5 Study area... 40
3.6 Sample selection ... 40
CHAPTER 4 RESIDENTIAL CHOICE AND SUSTAINABILITY: COMPARING THE PERFORMANCE OF PEOPLE’S PLACE WITH THEIR OUT-OF-HOME BEHAVIORS IN SPRAWLED CITY (Article 2) ... 42
4.1 Abstract ... 42
4.2 Introduction ... 43
4.3 Study area, database and sample ... 45
4.3.1 The study area ... 45
4.3.2 Database and Sample ... 47
4.4 Methods and results ... 49
4.4.1 Measuring the people’s performances ... 49
4.4.2 Defining people’s performance profiles ... 54
4.4.3 Accounting for clusters’ intensity, diversity and sustainability of behaviors ... 58
4.4.4 Conformity between people’s performance and their place of living ... 80
4.5 Discussion and Conclusion ... 85
CHAPTER 5 ARE SUSTAINABLE RESIDENTIAL CHOICE ALSO DESIRABLE? A STUDY OF HOUSEHOL SATISFACTION AND ASPIRATIONS WITH REGARD TO CURRENT AND FUTURE RESIDENTIAL LOCATION (Article 3) ... 89
5.1 Abstract ... 89
5.2 Introduction ... 90
5.3 Are sustainable residential choices desirable? A theoretical framework ... 91
5.3.1 Households’ Residential Satisfaction ... 91
5.3.2 Households’ Residential Aspirations ... 92
5.4 Data and methods ... 93
5.5 Results ... 95
vii
5.5.2 Residential satisfaction ... 95
5.5.3 Residential Aspirations ... 105
5.6 Discussion ... 120
5.7 Conclusion ... 121
CHAPTER 6 DISCUSSION AND FINAL CONCLUSION ... 124
6.1 Introduction ... 124
6.2 Discussion of the main findings ... 126
6.3 Main contributions ... 131
6.3.1 Knowledge Contribution ... 131
6.3.2 Theoretical and Methodological Contribution ... 132
6.3.3 Knowledge transfer and application ... 133
6.4 Limitations and recommendations for future research ... 134
6.5 Conclusion ... 136
LIST OF REFERENCES ... i
APPENDIX 1 ITEMS FROM THE DEMAIN QUÉBEC SURVEY QUESTIONNAIRE USED IN ARTICLE 2 xii A.1.1 To measure people’s performance ... xii
A.1.2 To explore the socio-economic characteristics of clusters ... xxii
A.1.3 To explore the spatial characteristics of clusters ... xxvi
APPENDIX 2 ITEMS FROM THE DEMAIN QUEBEC SURVEY QUESTIONNAIRE USED IN ARTICLE 3 xxviii A.2.1 To measure residential satisfaction ... xxviii
A.2.2 To explore residential projects ... xxix
viii
LIST OF TABLES
Table 2.1 Empirical studies on place-people correspondence with a view of sustainability 15 Table 2.2 Category of variables used in the 17 reviewed studies to measure people’s behaviors 23
Table 4.1 Socio-economic characteristics of the 746 respondents selected for the analysis 48
Table 4.2 Descriptive statistics of variables used to describe people’s performance ... 50
Table.4.3 Statistical validity measures ... 52
Table 4.4 Principal component analysis of behavioral ... 53
Table 4.5 Comparison of the scores of six factors within the seven clusters of people’s behavior 55 Table 4.6 Comparison of the scores of five variables situated in the Evaluation Fields within the seven clusters ... 56
Table 4.7 Socio-economic characteristics of the clusters by decreasing levels of association 59 Table 4.8 Clusters’ Sustainability Performance by decreasing strength of indicators... 65
Table 4.9 Spatial characteristics of the clusters ... 77
Table 4.10 Analysis of Walk Score of dwelling address of respondents ... 81
Table 4.11 Boroughs of dwelling address of respondents ... 82
Table 5.1 Behavioral, social and spatial characteristics of the seven clusters ... 96
Table 5.2 Qualifying indicators retained for measuring the satisfaction among the seven clusters 99 Table 5.3 Desired status of occupancy for the residence by groupings of behaviors (Percentage of answer selection in each cluster) ... 109
Table 5.4 Reason(s) for moving (Percentage of answer selection in each group). ... 113
Table 5.5 The results of Chi-Square test for desired neighborhood type ... 116
Table 5.6 Desirable location for future neighborhood (%) ... 118
i
LIST OF FIGURES
Figure 1.1 Elements of sustainable residential choice ... 6
Figure 2.1 Four types of relationship between people and place performance with regard to their residential location ... 25
Figure 2.2 Portraying the performance of people’s behaviors in terms of sustainability .. 30
Figure 3.1 The model of strengths and weaknesses of qualitative and quantitative research methodologies (Choy, 2014, p. 101) ... 35
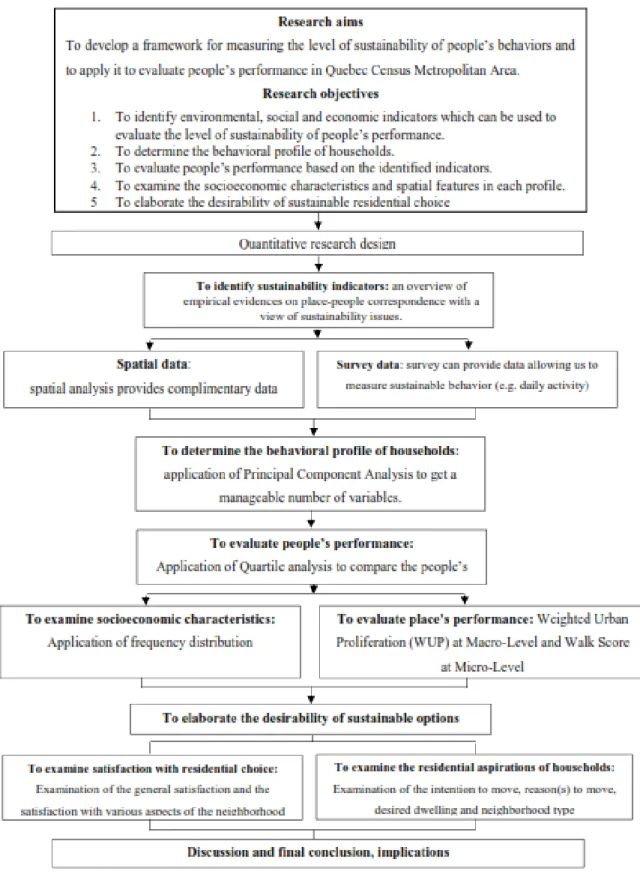
Figure 3.2 Research design ... 37
Figure 4.1 Urban sprawl (WUP) at the census tract level in the Quebec CMA from 1951 to 2011. 46 Figure 4.2 Cluster analysis to derive behavioral clusters in Quebec CMAs ... 54
Figure 4.3 Sustainability performance assessment (SPA) of the Recreationist using car .. 71
Figure 4.4 Sustainability performance assessment (SPA) of the Hypermobile Shoppers using Car 72 Figure 4.5 Sustainability performance assessment (SPA) of the Mobile Individuals using Active Transport ... 73
Figure 4.6 Sustainability performance assessment (SPA) of the Mobile Individuals using Public Transport ... 73
Figure 4.7 Sustainability performance assessment (SPA) of the Savers-on-Time and Spenders-on-Housing ... 74
Figure 4.8 Sustainability performance assessment (SPA) of the Immobile Recreationist using Public Transport ... 75
Figure 4.9 Sustainability performance assessment (SPA) of the Immobile shoppers... 75
Figure 5.1 Examination of satisfaction among the seven clusters of people’s behaviors 100 Figure 5.2 Intention to move among the seven groupings of behaviors (%) ... 105
Figure 5.3 Desired status of residence for each grouping o behaviors (%) (P-Value=.035, Cramer’s V=.214). ... 108
Figure 5.4 Desired dwelling type ... 114
Figure 5.5 Desired neighborhood type ... 116
i
ii
ACKNOWLEDGMENT
I would like to acknowledge all who in one way or another contributed to the completion of this thesis. My first appreciation goes to my first research advisor, Prof. Sébastien Lord, for his solid support, motivation, caring and patience. His vast knowledge and logical way of thinking helped me throughout this process. I also wish to express my deep and sincere gratitude to my second research advisor, Prof. Carole Després, for her advice, encouragement, commitment, immense knowledge, and unsparing support, as well as for providing me with an excellent atmosphere in which to conduct my research. The lessons she taught me go beyond what is written in this thesis and will help me in all aspects of my life.
I would like to acknowledge the members of my committee for taking interest in my work, examining my thesis and providing insightful comments and suggestions that improved further the quality of my thesis.
I also wish to gratefully acknowledge the financial support from GIRBa (Groupe interdisciplinaire de recherche sur les banlieues), Prof. Carole Després, Prof. Sébastien Lord and Faculté de l’aménagement at Université de Montréal, which made this research work possible.
I would like to offer my special thanks to Prof. Anthony Morven Gould from Université Laval, Prof. Eric Crighton and Dr. Saeid Homayouni from the University of Ottawa for their unforgettable kindness.
I would like to acknowledge the staff at Faculté de l’aménagement at Université de Montréal and CRAD (Centre de recherche en aménagement et développement) at Université Laval, especially Madams Francine Baril, Mirland Félix, Simon Zriel.
I would also like to extend my thanks to all my colleagues in GIRBa, and who helped me at various points during the PhD thesis process. Among them, I can name Jacky Rioux, Laurence Jodoin-Nicole, and Martin Tremblay-Beault.
My deepest appreciation goes to my colleague, friend, and officemate Michel Després for his excellent assistance, sharing their knowledge and ideas. His brilliant comments and sound advice considerably improved the quality of my dissertation. Thank you Michel. You have always been there for me.
iii
I appreciate all the help and support I received from my friends. Among them, I can name Bahar Masoumi-Hamedani, Hoda Jafarian, Ibeth Rojas, Mohammd Jaber Darabi Mahboub, Navid Moghadam, Vincent Shawi Metlej, and many others. I appreciate their presence and support, particularly in difficult times and wish them all good luck.
I would also like to express my endless gratitude to lovely sister, Samira, and her husband, Roozbeh, for the absolute support they have provided during my PhD period, and without whose love, spiritual encouragement and altruism I would not be where I am now. Words are powerless to express what I feel in my heart for them.
I extend my deepest gratitude to my father and mother who went through a lot while I was absent. They have given me tremendous support and deserve more than a simple “thank you.” I owe them a lot and apologize them sincerely because of my long absence and therefore not being able to help them at their old age. Words cannot express how grateful I am to them for all the sacrifices that they made on my behalf.
Last but not least, I genuinely express my profound gratefulness to my spouse, Reza, and my child, Artin, for being tolerant angels and bringing happiness and enjoyment to my life. I owe my success to their love, patience, heartfelt sympathy, and support. I apologize them for the shortcoming and not being the wife/mother they deserve during my PhD period.
CHAPTER 1
INTRODUCTION
1.1 Research problems and questions
In North America, we observe a trend in residential choice with a steady increase in the size of houses (despite shrinking households) and the expansion of low-density residential neighborhoods away from the city centers (Schor, 2010). The resulting urban sprawl is an acute phenomenon in the Quebec metropolitan area where suburban expansion is ongoing since WWII. Several related sustainability problems have been associated with this territorial expansion at the environmental level (e.g. ecosystem degradation), the social level (e.g. lack of proximity services) and the economic level (e.g. costs of urban infrastructure and local services) (Després, Brais, & Avellan, 2004; Lovejoy, Handy, & Mokhtarian, 2010) . Urban planners and policymakers are proposing and implementing measures to increase public transport services, develop eco-friendly neighborhoods as well as densify existing ones. Among these measures, providing diverse and sustainable housing, taking into account the needs and financial resources of households has become an issue in policy making (Société d’habitation du Québe, 2011). Despite the presumed detrimental role of suburbia in the realization of sustainable development, many households are attracted by the suburban life for different types of reasons. A first one comprises micro-level factors influencing the decision-making process at the scale of households, e.g. the relationship with nature, experiences of past homes, distance to the workplace and the geography of social ties (Fortin & Després, 2009; Kährik, Leetmaa, & Tammaru, 2012; Vidal & Kley, 2010). A second type corresponds to macro-level structural factors such as the housing market and offer, namely in suburban areas (Kährik et al., 2012). The metropolitanization of cities creates at once concentration and dispersion, polarization and urban diffusion of activity centers, as well as territorial fragmentation (Gaussier, Lacour, & Puissant, 2003). The traditional city/suburb distinction becomes blurry, which makes it more complex to apprehend households’ housing choices. The interposition of different factors leads to residential choices with varying levels of sustainability. In such wise, this thesis examines the sustainability performance of residential choices among different households living in different types of settlements in the Quebec metro area.
5
The sustainability performance of a residential choice is composed of two dimensions (Figure 1.1): first, the objective characteristics of the neighborhood and their compliance with the sustainability criteria; second, how people use their environment outside the home on a daily basis with regard to work, family and consumption (Enaux, Lannoy, & Lord, 2011). In sprawled cities, even though some employment is available in the neighborhood of residence, two spouses in the same household are very likely to work elsewhere. The same holds true for kindergartens and schools, while their children attend them somewhere else, or for groceries they may choose to shop elsewhere on the way home from work. On the other hand, other households in the same neighborhood may take advantage of all these local amenities. Living in the same neighborhood (with the same sustainability performance), these two households would have two different behavioral performances (influenced namely by green gas emissions associated with driving or walking). It is this complexity of residential choices and the contradictions that emerge regarding sustainability that lies at the heart of this thesis.
This thesis aims at answering the following general questions: How sustainable are the residential choices of the many households living and working in a metropolitan area? To what extent the choice of an inner-city neighborhood is more “sustainable” compared to one on the outskirt? How can this be measured? How much is associated with the objective characteristics of the neighborhoods compared to lifestyle choices? In a more specific way, the following questions need to be answered: What types of behavioral profiles co-exist in the Quebec metro area with regard to residential choices? Where are the households belonging to theses profiles located? How congruent are household patterns of behaviors with the characteristics of their residential environment, with respect to sustainability? If a mismatch is observed, how can it be explained?
Recognition of micro and macro level factors of the phenomenon of metropolitanization and of the two aspects of residential choice would evoke the hypothesis that, at the level of household, the contribution of residential choice (involving both place and people’s behaviors) may be equal or higher than the place (residential environment), with regard t sustainability achievement.
6
Figure 1.1 Elements of sustainable residential choice
1.2 Research aims and objectives
This study attempts to clarify the degree of congruence between the levels of sustainability of the residential environments where people live and of their out-of-home associated behaviors. Only regular daily activities associated with work, school, and consumption will be considered in the measurement of the ecological footprint (e.g. traveling, energy saving or recycling habits, consumption of organic products will be excluded). Furthermore, residential choice will be considered only at the neighborhood scale even though this concept encompasses the dwelling unit. A range of explanations that may account for the degree of correspondence between the sustainability of people’s behaviors and the sustainability of their residential neighborhood will then be examined.
Approaching sustainability in the context of residential choice, as Bell & Morse (2008) put, we are “moving toward a measurement of the immeasurable […], a highly complex term open to a wide variety of interpretations and conceptualizations.” (p. 127). We define sustainability as the reconciliation of three imperatives: environmental, social and economic. It refers to an accomplishment in which natural environment can thrive and human needs are met
7
while promoting social equity and economic viability (Coffman & Umemoto, 2009; Dale & Hill, 2001). Sustainability performance refers to the amount of useful outcome accomplished with respect to sustainability. People performance is the amount of useful outcome accomplished by household behaviors in their daily life. Place performance refers to the extent to which residential neighborhoods contribute to sustainability, more specifically, the degree to which patterns of behaviors stem from the concomitant aspects of an environment. As previous studies (Myers & Gearin, 2001 ; Walker & Li, 2006) demonstrated, there may be congruity or incongruity between the level of performance of a residential location and the level of performance of a concerned household (e.g. using a private car in a single-family low-density neighborhood and using it in inner-city neighborhood adapted to walking and well-serviced in public transport).
The specific objectives of the thesis are:
1. to identify indicators which can be used to evaluate the level of sustainability of people’s behaviors as well as that of their residential location;
2. to develop an assessment framework to measure the sustainability performance of residential neighborhoods and household behaviors;
3. to apply the assessment framework (Figure 1.1) to evaluate the sustainability performance of different residential locations and the associated behaviors and determine the level of (in)congruity between the two.
1.3 Research Significance
This study examines the degree of correspondence between the sustainability performances of people’s behaviors and of that their residential environment. Its objective is to shed light on the variables linking the two and the gap that need to be bridged in order to achieve more sustainable development. This research will contribute to the knowledge base on residential choice by exploring not only the environmental dimension of their sustainability but also the social and economic aspects. The assessment framework to be developed may help planners and policy makers evaluate the effectiveness of the measures put forward to increase sustainability in residential neighborhoods to improve the sustainability of the people living in
8
them. Indeed, it is important for decision makers to develop reliable empirical evidence on the potential effectiveness of these measures and on the conditions and mechanisms facilitating or inhibiting their potential effects.
This thesis deals with an innovative and important subject. The results shed light on the complexity of the links between residential behaviors and the living environment regarding sustainability behaviors. The most original part of the research is to verify not only the level of congruity between the level of sustainability of the place of residence and the behaviors associated with mobility out of home but to assess the desirability for households of their residential situation in relation to their future aspirations.
This type of "demonstration" is essential in view of the lack of integration of studies aimed at either objectively measuring the sustainability of the premises or evaluating the sustainability of household or individual behaviors and the scarcity of studies targeting the two simultaneously. Studies that evaluate sustainable behaviors are predominantly conducted by psychologists and those that evaluate the sustainability of the built environment by transportation engineers. This thesis contribute both theoretically and methodologically to combine these two perspectives.
1.4 Outline of thesis
This thesis is organized into six chapters, three of them in scientific article formats to be submitted to peer-reviewed journal.1 For publication purposes, the thesis is constructed in a way
that these chapters are independent. The chapters include a general introduction (chap. 1), a literature review (article 1) to which the conceptual framework of this study is integrated (chap. 2), the research methodology (chap. 3), two chapters on the results of the analyses: a first one comparing place and people’s performance (chap. 4, article 2), a second one reporting on the desirability of (un)sustainable residential choice (chap 5, article 3); and finally, a discussion
1The first author of each article is Simin Lotfi, the author of this thesis. She conducted the data analysis and wrote
the articles. The two other authors, Sébastien Lord Ph.D and Carole Després, Ph.D. are respectively director and co-director of the thesis.
9
of the results, followed by the general conclusion (chapter 6). Annexes have been added to this thesis to provide all the necessary additional information that the reader might need to consult to fully understand the research project.
Chapter 1: Introduction. Overview of the study: discussion of the background to the research, research problem, aim and objectives of the research, significance of the research, and the scope of the study.
Chapter 2: Literature review (article 1). The first article aimed at relocating this research in the scientific context. The scientific evidence discussed was identified through a search in multidisciplinary databases from 1994-2016, in addition to recommendations from experts. Their content was classified and analyzed according to how it answered the following questions: 1) What aspects of places and people’s behaviors are considered to evaluate sustainability?; 2) To which pillar of sustainability do these characteristics of places or behaviors refer?; 3) How or by which mechanisms are places and people related; and finally, 4) why are places and behaviors linked the way they are? This article attempted to clarify the concepts of people’s performance and place performance regarding sustainability in the context of residential choice. We discuss how previous researchers have approached the two concepts, the previous works’ strengths and weaknesses, and the actual gaps which need to be bridged. We classify the empirical evidences about the relationship between residential neighborhood and people’s behaviors. An important outcome of this chapter is the framework developed for the assessment of the sustainability of people’s performance.
Chapter 3: Methodology. Discussion of how the research was developed and conducted. The methodology used to address the study objectives is also presented. A thorough understanding of the survey that provided the database is presented, along with the study area, sample, and operational framework and research procedures before advancing analysis.
Chapter 4: Comparing the sustainability levels of people’s behaviors and their residential location (Article 2). The article is aimed at studying, with a quantitative and cross-sectional perspective, the profiles of people’s behaviors for out-of-home activities and assessing their sustainability performance, and then comparing these with the sustainability performance of their residential location. A group of 740 households with at least one respondent who worked
10
full-time was analyzed. The database was “Demain Québec”, an Internet survey of residents of the Quebec City metro area detailing their household, residence and mobility characteristics. To assess the sustainability performance of people’s behaviors, a principal component analysis was performed on the variables, developed in chapter 2 (article 1), based on the available database, which led to six factors. These variables were later applied to a two-step clustering analysis leading to seven profiles of behaviors. To assess the sustainability performance of people’s residential location and compare it with behavior profiles, we used the neighborhood Walk Score.
Chapter 5: The desirability of (un)sustainable residential choice (Article 3). This article is aimed at understanding to what extent working households are satisfied with their residential choices with varying levels of sustainability and aspire to continue similar or different choices in their residential projects. This article is based on the sustainability performance of behavioral typologies developed in the latter article.
Chapter 6: Discussion and conclusion. The findings are discussed according to the research objectives presented in chapter 1. The implications of the research include the study’s contribution to the body of knowledge and practice. The limitation of the study and recommendation for future research are also outlined. The chapter finally concludes with an overall comment on the study.
CHAPTER 2
DOES “WHERE WE LIVE” REFLECT “WHAT WE DO”?
AN OVERVIEW OF EMPIRICAL EVIDENCE ON PLACE-PEOPLE
CORRESPONDENCE WITH REGARDS TO SUSTAINABILITY
(Article 1)
Simin Lotfi1, Carole Després and Sébastien Lord
École d’urbanisme et d’architecture de paysage, Faculté de l’aménagement, Université de Montréal, Montreal, Quebec, Canada
1Corresponding author: Simin Lotfi
E-mail address: simin.lotfi@umontreal.ca
(Prepared for submission to Journal of Sustainable Development)
Keywords: Residential choice, daily mobility, sustainability performance, sustainability indicators
2.1 Abstract
Despite substantial effort to uncover the link between people’s behaviors and places over the last decade, the findings remain ambiguous. While some research shows a clear relationship between sustainable neighborhoods and behaviors, others fail to do so. This paper presents a critical overview of the empirical evidence on this issue. In the end, an inventory framework is proposed to help the design of studies on the performance of residential choice with regard to the three pillars of sustainability. The scientific evidence discussed was identified through a search in multidisciplinary databases from 1994-2016, in addition to recommendations from experts. A total of 17 papers was retained for the review. Their content was classified and analyzed according to how it answered the following questions: 1) What aspects of places and people’s behaviors are considered to evaluate sustainability?; 2) To which pillar of sustainability do these characteristics of places or behaviors refer?; 3) How or by which mechanisms are places
12
and people related; and finally, 4) why are places and behaviors linked the way they are? In response to the first question, the indicators most often used to evaluate the sustainability of the places describe the built environment in terms of its form, functions and density, as well as its socio-economic characteristics. To evaluate the sustainability of people’s behaviors, multiple indicators are used of different natures, that is, environmental, social, economic, and daily mobility-related indicators with regard to transport modes, as well as the traveled space and time. The relationships identified between levels of sustainability of places and behaviors are described as matching (sustainable behaviors in sustainable places or unsustainable behaviors in unsustainable places) or lacking congruity (unsustainable behaviors in sustainable place and sustainable behaviors in unsustainable places). Reasons why places and people are linked in such ways are most often analyzed with regards to factors belonging to different types of variables having to do with life situations, lifestyles, and conveniences. The conclusion underlines the need for researchers to embrace the complexity of residential choice and the associated daily mobility in future research as well as for policymakers to define actions to be taken for unsustainable places to be improved and more sustainable behaviors to be adopted.
2.2 Introduction
With regard to residential choice, it is often assumed that people who choose to live in locations defined as more sustainable will show or adopt more sustainable behaviors at the neighborhood scale (Boarnet, Forsyth, Day, & Oakes, 2011; Van Acker & Witlox, 2010). Because of this expected determinant role of residential neighborhoods on behaviors, it is important for policy-makers, planners, and practitioners to better understand the interaction between "where people live" and "what people do". To investigate the level of congruity between the two, sustainability must be embraced in all its complexity, that is, its environmental, social and economic imperatives. One difficulty in making sense of existing scientific evidence is that the findings commonly stem from the consideration of only one imperative, or two at the most. Another difficulty is that the bulk of the scientific literature investigates the sustainability of either the places where people live or the associated behaviors; examining scientific evidences linking the two is at the heart of the critical overview presented in this paper. The considered behaviors are those related to daily mobility and activities outside the domicile. From
13
the collected evidence, a conceptual framework was developed to analyze “people-place” correspondence as a transactional unit of analysis, to help elucidate which features make both place and people reach their full potential with regards to sustainability performance.
2.3 Method
2.3.1 Search Strategy
A literature search using keywords Residential choice AND Lifestyle OR Behavior AND Residential neighborhood OR Built environment OR Urban forms AND Sustainability, was performed on databases (e.g. Web of science and SpringerLink). In addition to the web search, 22 references were provided from two experts. A total of 112 papers published after 19922 were
thus first identified on the basis of their titles. Since this review aims at understanding the mechanisms linking people’s behaviors to their places of residence with regard to sustainability, we considered the two following exclusion criteria after reading the abstracts: 1) abstracts focusing exclusively on either places or behaviors were excluded; 2) papers focusing on scenario situations instead of real life situations were also excluded. Of the 112 initial papers, we were left with 32 articles which were read entirely after which half of them were further excluded because of the similarity between their contents.
2.3.2 Corpus Description
The seventeen articles retained for the critical overview were published after 2011 (Table 2.1). Six were written by geographers, five by civil engineers, and one by an environmental psychologist; the five others were led by interdisciplinary teams among which transport and urban planners and only one including architects. The majority of the research was conducted in Western countries, more than half in European countries (3 in the UK, 2 in Belgium, 1 in Austria, 1 in Denmark, 1 in Finland and 1 in Germany); the rest in North America (4 in the US,
2We considered the papers published after 1992 because Action for sustainable development was the key proposal
of the first UN Conference on Environment and Development, held in Rio de Janeiro in June 1992, in response to concerns about global environmental problems (United Nations, 1992). Agenda 21 was enacted and, since then, major groups participated in the SD process in a constant manner. Lifestyle, formalized as the patterns of production and consumption, was addressed in Principal 8 of the Rio Declaration for the first time (UN-Rio Declaration, 1992).
14
1 in Canada); Australia (2); only one was conducted in China (Yu, Zhang, & Fujiwara, 2012). Two main types of strategies are used for evaluating the sustainability of residential choice and the level of congruity between people’s place and behaviors. The first type favors the objective measurement of the built environment and socio-economic factors (twelve studies focus strictly on these dimensions). The second favors subjective variables associated with psychological factors (eight studies target solely these dimensions). Finally, eight studies mix both approaches, incorporating objective and subjective variables. Most studies used cross-sectional survey designs (9 quantitative, 1 qualitative and 2 mixed), the others proceeded through cohort observation with quantitative research design: quasi-longitudinal, prospective and retrospective. The sample sizes among studies are highly variable (from n=26 to n=75331). The primary criterion for sample selection is to have respondents residing in different types of places (e.g. suburban vs. urban neighborhoods; transit-oriented development vs. “regular” neighborhood). For cohort studies, another considered criterion is that respondents have experienced relocation.
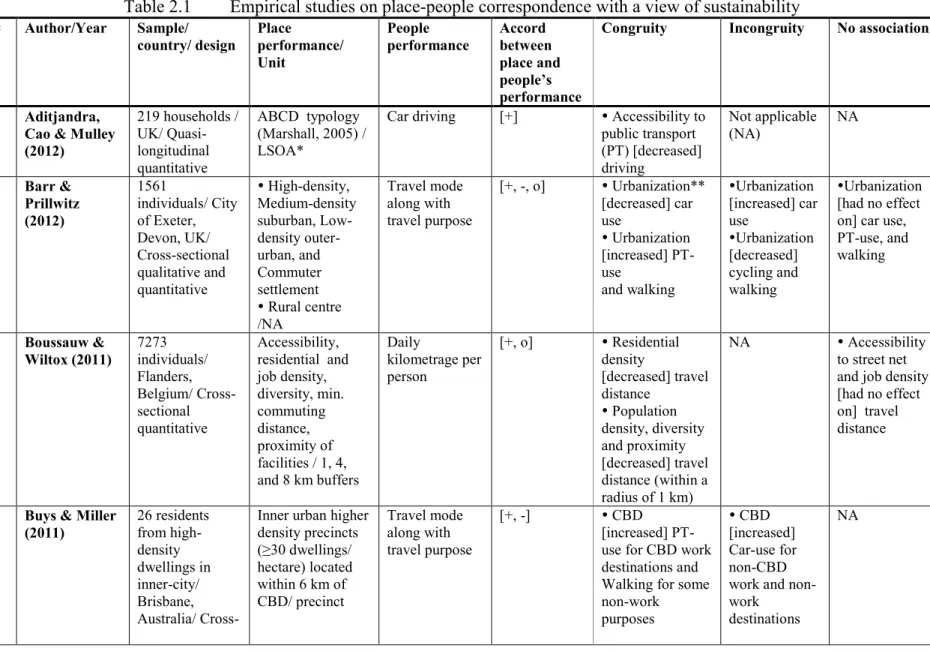
Table 2.1 Empirical studies on place-people correspondence with a view of sustainability
# Author/Year Sample/
country/ design Place performance/ Unit
People
performance Accord between place and people’s performance
Congruity Incongruity No association
1 Aditjandra, Cao & Mulley (2012) 219 households / UK/ Quasi-longitudinal quantitative ABCD typology (Marshall, 2005) / LSOA*
Car driving [+] Accessibility to public transport (PT) [decreased] driving Not applicable (NA) NA 2 Barr & Prillwitz (2012) 1561 individuals/ City of Exeter, Devon, UK/ Cross-sectional qualitative and quantitative High-density, Medium-density suburban, Low-density outer-urban, and Commuter settlement Rural centre /NA Travel mode along with travel purpose [+, -, o] Urbanization** [decreased] car use Urbanization [increased] PT-use and walking Urbanization [increased] car use Urbanization [decreased] cycling and walking Urbanization [had no effect on] car use, PT-use, and walking 3 Boussauw & Wiltox (2011) 7273 individuals/ Flanders, Belgium/ Cross-sectional quantitative Accessibility, residential and job density, diversity, min. commuting distance, proximity of facilities / 1, 4, and 8 km buffers Daily kilometrage per person [+, o] Residential density [decreased] travel distance Population density, diversity and proximity [decreased] travel distance (within a radius of 1 km) NA Accessibility to street net and job density [had no effect on] travel distance
4 Buys & Miller (2011) 26 residents from high-density dwellings in inner-city/ Brisbane, Australia/
Cross-Inner urban higher density precincts (≥30 dwellings/ hectare) located within 6 km of CBD/ precinct Travel mode along with travel purpose [+, -] CBD [increased] PT-use for CBD work destinations and Walking for some non-work purposes CBD [increased] Car-use for non-CBD work and non-work
destinations
16
Table 2.1 Empirical studies on place-people correspondence with a view of sustainability
# Author/Year Sample/ country/ design Place performance/ Unit People performance Accord between place and people’s performance
Congruity Incongruity No association
sectional qualitative 5 De Vos et al. (2012) 1657 university students and staff members / Flanders, Belgium/ Cross-sectional quantitative Urban and suburban/ NA
Travel mode [+, -] Urbanization [Increased] AT-use and PT-AT-use -Urbanization [decreased] car use -Urbanization [decreased] AT-use and PT-use -Urbanization [increased] car use NA 6 Delmelle, Haslauer & Prinz (2013) 8700 individuals/ Vienna, Austria/ Cross-sectional quantitative Population density, centrality, transportation factors, and dwelling types/ NA Social
satisfaction [+, -] PT services and Population density [increased] social satisfaction Residing in apartment complex [decreased] social satisfaction NA 7 Fan, Khattak & Rodríguez (2012) 2886 households/ Triangle area in North Carolina (Orange, Wake, and Durham), US/ Cross-sectional quantitative Building density, retail accessibility, and street connectivity/ 0.25 miles buffer Observed, required and excess travel, travel mode, travel purpose, and travel time
[+] Connectivity and accessibility to retail stores [decreased] travel distances Density, mixity, and street connectivity [decreased] required and excess travel NA NA
8 Farber & Lio
(2013) NA/ 42 metropolitan area, US/ Cross-sectional quantitative Sprawl indicators (Ewing, Pendall, & Chen,2003): decentralization, big city, fragmentation, low mixing, long
Social Interaction Potential (SIP) [+] Decentralization and fragmentation [increases] mean commuting time Decentralization and fragmentation [decreases] SIP NA NA
17
Table 2.1 Empirical studies on place-people correspondence with a view of sustainability
# Author/Year Sample/ country/ design Place performance/ Unit People performance Accord between place and people’s performance
Congruity Incongruity No association
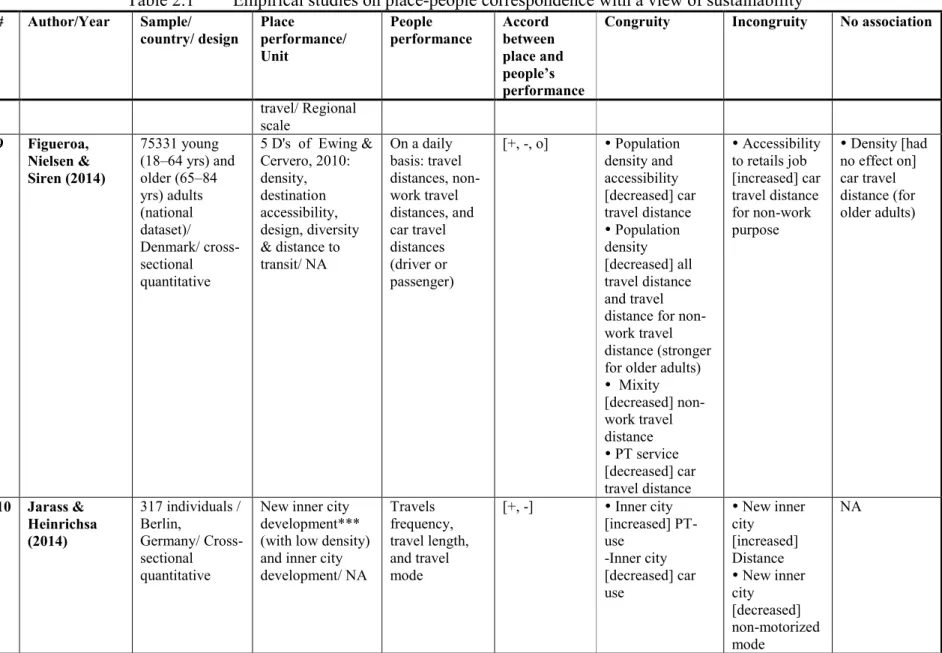
travel/ Regional scale 9 Figueroa, Nielsen & Siren (2014) 75331 young (18–64 yrs) and older (65–84 yrs) adults (national dataset)/ Denmark/ cross-sectional quantitative 5 D's of Ewing & Cervero, 2010: density, destination accessibility, design, diversity & distance to transit/ NA On a daily basis: travel distances, non-work travel distances, and car travel distances (driver or passenger) [+, -, o] Population density and accessibility [decreased] car travel distance Population density [decreased] all travel distance and travel distance for non-work travel distance (stronger for older adults) Mixity [decreased] non-work travel distance PT service [decreased] car travel distance Accessibility to retails job [increased] car travel distance for non-work purpose Density [had no effect on] car travel distance (for older adults) 10 Jarass & Heinrichsa (2014) 317 individuals / Berlin, Germany/ Cross-sectional quantitative
New inner city development*** (with low density) and inner city development/ NA Travels frequency, travel length, and travel mode [+, -] Inner city [increased] PT-use -Inner city [decreased] car use New inner city [increased] Distance New inner city [decreased] non-motorized mode NA
18
Table 2.1 Empirical studies on place-people correspondence with a view of sustainability
# Author/Year Sample/ country/ design Place performance/ Unit People performance Accord between place and people’s performance
Congruity Incongruity No association
11 Kamruzzaman et al. (2013) 3957: 510 TOD residents and 3447 non-TOD residents/ Brisbane, Australia/ Longitudinal quantitative
TOD versus non-TOD : net
residential density, land use diversity, intersection density, cul-de sac density, and PT accessibility/ 600 m buffer
Travel mode
and Travel time [+, o] PT accessibility [increased] propensity of walking in TOD Cul-de-sac [decreased] PT-use and AT-PT-use in non-TOD Density [increased ] AT and switch to walking in TOD and non-TOD Intersection density[increased] walking in non-TOD Intersection density [decreased] switching to AT-use in TOD Diversity [had no effect on] mode choice in TOD and non-TOD PT accessibility to [had no effect on] propensity of walking, only in non-TOD Cul-de-sac density [had no effect on] PT-use and AT- use, in TOD 12 McCunn & Gifford (2014) 84 individuals/ Canada/ Cross-sectional quantitative Green Neighborhood Scale (GNS) **** Sense of place and neighborhood commitment [+, o] Greenness [increased] neighborhood commitment NA Greenness [had no effect on] sense of place 13 Nahlik & Chester (2014) American Housing Survey/ Los Angeles, US/ Prospective quantitative BAU (business-as-usual) versus TOD/ .8 km buffer around Gold Light Rail Transit (LRT) & Orange Bus Rapid Transit (BRT) Travel mode, Travel length, Energy use, Greenhouse Gas Emissions, Respiratory Impact potential, and Smog formation potential [+] Mobility options [increased] shift from car to PT-use and AT-PT-use Closeness to commerce and center [decreased] car travel distance TOD[decreased] fuel cost and car emissions
19
Table 2.1 Empirical studies on place-people correspondence with a view of sustainability
# Author/Year Sample/ country/ design Place performance/ Unit People performance Accord between place and people’s performance
Congruity Incongruity No association
14 Susilo et al. (2012) 659 residents of sustainable neighborhoods/ UK/ Cross-sectional densities, connectivity, bike path, surveillance, PT services and permeability/ NA Travel mode, frequency, and length, and activity locations [+, -, o] Connections [Increased] cycling Density [decreased] cycling Mixity [had no influence on] walking 15 Valkila & Saari (2013) 30 individuals/ Finland/ Cross-sectional qualitative and quantitative
Inner city, inner suburb, and outer suburb/ NA Carbon footprints, travel length along with travel mode, and vehicle occupancy [+, o] Urbanization, PT accessibility [decreased] car travel distance Centrality [decreased] travel-related carbon footprint PT accessibility [decreased] carbon footprint NA Urbanization [had no influence on] PT-use 16 Yu, Zhang, Fujiwara (2012) 530 households/ Beijing, China/ Retrospective quantitative Urbanization degree and access to train / 1.2 km radius buffer Energy consumption measured by : monetary expenditure [+, -] Recreational facilities and bus lines [decreased] car-related energy consumption CBD Residing [Increased] car expenses NA 17 Zhu et al.
(2014) 449 households/ Austin, Texas, US/
Retrospective quantitative
Walk Score/ NA Travel time, travel mode, social interactions, and cohesion [+] Walk Score [Increased] At-use, social interaction, and cohesion Walk Score [decreased] travel time by car NA NA
* LSOA refers to the lowest administration area used in UK 2001 Census (Aditjandra, Cao, & Mulley, 2012)
20
***New inner city development refers to new residential neighborhoods within the existing built structure, which has lower density compare to the inner city structures (Jarass & Heinrichs, 2014).
****18 variables derived from the United States Green Building Council, CMHC, & Kellert, Heerwagen, & Mador, 2008, within a radius of half-mil Legend: (+) positive relationship, (-) negative relationship, (o) no relationship
2.4 Results
2.4.1 Operationalizing the sustainability performance of people-place
interaction
Among our corpus of 17 articles, we identified a diversity of indicators of different nature used to evaluate the sustainability performance of people-place interaction (Table 2.1). To evaluate the sustainability of places, the indicators used describe the residential location in terms of its built environment or socio-economic characteristics (e.g. Boussauw & Witlox, 2011; Delmelle et al., 2013; Farber & Li, 2013; Figueroa, Nielsen, & Siren, 2014). With regard to evaluating the sustainability of the built environment, most indicators provide quantifiable measures. Boussauw & Witlox (2011) and Fan et al.(2011) considered the contribution of accessibility, population density, and residential density. In other studies, it is a typology of urban developments that is considered, e.g. transit-oriented development (TOD) versus non-TOD (Kamruzzaman et al., 2013) or inner-city, inner suburb and outer suburb (Valkila & Saari, 2013). Concerning the definition of the territorial unit of measurement, the most common approach is to define a buffer around each respondent's home. Fan et al. (2011), Kamruzzaman et al.(2013) and Yu et al. (2012) respectively uses radiuses of 0.4 km, 0.6 km, and 1.2 km; Boussauw & Witlox, (2011), radiuses of 1 km, 4 km, and 8 km. A variation is to define the buffer zone around a rail or bus rapid transit (Nahlik & Chester, 2014). Another avenue is to use a homogeneous dwelling density, e.g. precincts defined as 30 or more dwellings/hectare (Buys & Miller, 2011) or existing administrative boundaries, e.g. census Lower Super Output Area (LSOA) (Aditjandra et al., 2012). The incorporation of subjective indicators to evaluate the sustainability performance of place is also necessary. Indeed, even a homogeneous socio-economic group living in the same location may differ in terms of individual behaviors (De Vos, Derudder, Van Acker, & Witlox, 2012).
To evaluate the sustainability of people’s behaviors, indicators of different natures were used. All but four studies used objective spatiotemporal indicators related to daily mobility are commonly considered. They measure traveled space and time, trip frequency, or specify travel purpose or transport modes. Researchers use these variables in combination [e.g. travel mode
22
and travel purpose (Barr & Prillwitz, 2012; Buys & Miller, 2011), travel mode and travel distance (Figueroa et al., 2014), or travel length and travel mode (Valkila & Saari, 2013)]. Some also manipulate variables through mathematical formulations to carve out their area of interest. For instance, Fan et al. (2011) combine a set of variables to define the indicators required travel, and excess travel. Required travel is “a function of the relative distances among daily activity locations”, while excess travel is a function of “the relative distances between the actual residential location and the daily activity locations” (p.1242). A lower level of required travel means to have smaller geographical areas and less dispersed activity locations; a lower level of excess travel means to have a better coordination between home and activity locations and vice versa, which may encourage or promote sustainability. Buys & Miller (2011) incorporate four variables to qualify daily mobility, bringing forward the concept of convenience. It is defined as the intersection of utilitarian and psycho-social elements and is identified as a determinant factor of transportation choice. It is the outcome of four objective measures: time-efficiency, seamless journey3, distance to destination and purpose of the journey.
The social imperatives of sustainability were considered in six studies. The subjective indicators measured alternately the satisfaction with the social composition of the neighborhood or the perception of its social cohesion, the sense place or commitment with the neighborhood, the social interaction with the neighbors, and the satisfaction with current domicile and residential preferences. Some studies refer to two useful concepts. The first one is the residential dissonance4 which refers to the mismatch between actual and preferred residential neighborhood
(De Vos et al., 2012; Kamruzzaman, Baker, Washington, & Turrell, 2013). The second is residential self-selection which refers to the “an individual’s inclination to choose a particular neighbourhood according to their travel abilities, needs, and preferences" (Aditjandra et al., 2012; Yu et al., 2012; Kamruzzaman et al., 2013).
Four studies evaluated the sustainability of people’s behaviors from an environmental standpoint from three indicators: energy use, carbon footprint and vehicle occupancy(Figueroa et al., 2014; Jarass & Heinrichs, 2014; Valkila & Saari, 2013; Yu et al., 2012). Finally, the
3 According to Buys & Miller (2011), “ Seamless journey is critically related to the concept of unbroken travel and
avoidance of using more than a single mode ” (p.296).
23
economic aspect of behaviors were only considered in one study (Yu et al., 2012). Table 2 2 summarizes the variables used to measure people’s behaviors identified in the literature. Table 2.2 Category of variables used in the 17 reviewed studies to measure people’s
behaviors
Category of indicators Indicators Paper reference Number
(see Table 2 1)
Number of studies SPATIOTEMPORAL
Transport mode Car driving Travel mode
[1, 2, 4, 5, 7, 9, 11, 13, 14, 15, 17]
11
Traveled distance Daily mileage per person Travel distances
Observed travel Required travel Excess travel
[3, 7, 9, 13, 14, 15] 6
Trip frequency Travels frequency [9,10,14] 3
Travel purpose Travel purpose [2, 4, 9] 3
Travel time Travel time [7, 11, 17] 3
SOCIAL Social satisfaction w/ neighborhood
Social Interaction w/ neighbors Sense of place
Commitment to neighborhood Perception of neighborhood cohesion Satisfaction with current domicile Residential preferences
[6, 8, 12, 17; 4; 7] 6
ENVIRONMENTAL Energy use
Carbon footprints Vehicle occupancy
[9, 13, 15, 16] 4
ECONOMIC Monetary expenditure on electricity, gas
& gasoline [16] 1
2.4.2 Which imperative of sustainability is evaluated in the studies?
It is well-known and accepted that sustainability encompasses at least three imperatives of environmental, social and economic natures. Environmental sustainability deals with the impact of the development process on biodiversity of habitats and the utilization of natural resources (Deakin, Curwell, & Lombardi, 2001). Social sustainability refers to the strong of sociocultural life, social involvement, access to services, safety and security and overall human well-being both mentally and physically (Bacon, Douglas, Woodcraft, & Brown, 2012; Deakin et al., 2001; Woodcraft, 2012). Regarding economic sustainability, we endorse the definition of Markandya & Pearce (1988) who define it as “the use of resources today should not reduce real incomes in the future” (p. 5) and agree with Moldan, Janoušková, & Hák (2012) that in view of
24
recent economic and financial crises, economic issues should be addressed “on their own merits, with no apparent connection to the environmental aspects” (p. 4).
A first group of variables are unidimensional in that they measure only one dimension of sustainability. For instance, energy use, carbon footprints, or vehicle occupancy relate to environmental sustainability. Social satisfaction, sense of place or neighborhood commitment rather pertains to social sustainability. A second group of variables could be labeled multidimensional in that they relate to more than one dimension of sustainability. For instance, with regard to transport mode, the use of public transit may contribute to environmental sustainability, but have a negative impact on social sustainability by increasing travel time which may reduce time for social interactions with family or neighbors. Similarly, walking may contribute at once to environmental, social, and economic sustainability by diminishing traffic, pollution, improving health and social relations, and diminishing car-associated monetary expenditures. Finally, a last group of variables allows for to a better understanding of people’s behaviors without being necessarily associated to a particular dimension of sustainability (e.g. travel purpose).
2.4.3 How congruent are place and people’s sustainability performance?
The reviewed scientific evidence provides mixed findings regarding the correspondence between people and place performances in terms of sustainability (see Table 2.1 in section 2.3.2). The relationships identified between places and behaviors are described as matching or congruent (sustainable behaviors in sustainable places or unsustainable behaviors in unsustainable places) in 17 studies, or lacking congruity (unsustainable behaviors in a sustainable place and sustainable behaviors in an unsustainable place) in eight studies, or else, as showing no significant relationship in seven studies. These relationships are illustrated in Figure 2.1.
25
Figure 2.1 Four types of relationship between people and place performance with regard to their residential location
2.4.4 Why are the sustainability performance of place and behaviors
related in such ways?
An overview of the papers revealed several factors influencing the degree of congruence between the sustainability level of people’s behaviors and of their residential location. Three main sets of factors contribute to shedding light on the relationship between the two: life situation, lifestyle, and convenience. Alternately, they may influence the direction and force of the relationship between place and related behaviors as well as the level of sustainability.
26 2.4.4.1 Life situation
Life situation refers to socio-economic and demographic characteristics (Aditjandra et al., 2012). Twelve studies investigated the influence of life situation on place-people correspondence. These variables may change the gravity or direction of the relation between people and place with regard to sustainability. Nine categories of variables were contemplated: age, gender, household-related factors (size, structure, number of children, age of children), income, job-related factors (number of workers, status of job, type of job, retirement), education, mobility resources (car ownership, bike ownership, driver’s license), health, home-ownership.
Age was found to influence the mode of transport. The middle-age group tend to favor car, older
adults public transit and younger people walking (e.g. Barr & Prillwitz, 2012; Boussauw & Witlox, 2011). Out of the four papers on social aspects, only Delmelle et al. (2013) found no significant evidence that age was linked to social satisfaction. Gender also accounted for some kind of influence. Men used car most frequently than women, who tended to rely more on public transportation (Barr & Prillwitz, 2012; Kamruzzaman et al., 2013). Women also tend to walk more than men (Kamruzzaman et al., 2013). This being said, even when walking was their primary transport mode, it was affected by the perceived safety (Buys & Miller, 2011). According to Fan et al. (2011), the presence of children in households increased daily mobility. Longer travel distances were related to families with children. Indeed, school quality and location were strong influences on residential choice, and reduce households’ opportunities to concentrate their daily trips on smaller geographical areas. The number of children had no significant effect on excess travel (Fan et al., 2011) although larger households and families with children were found to rely more on car (Aditjandra et al., 2012; Susilo, Williams, Lindsay, & Dair, 2012), which may be used as a to conciliate parental, familial, professional obligations. This being said, larger households were also found to use public transport because of limited access to cars for all members. It is not clear whether income influences travel mode choice through increasing car ownership and whether it has a direct effect on mobility (Aditjandra et al., 2012; Fan et al., 2011; Figueroa et al., 2014). As for the impact of education and employment, highly educated professional workers tend to depend less on car and walk more compared to other socio-economic groups (Kamruzzaman et al., 2013; Yu et al., 2012). Bike
27
encourages driving (Aditjandra et al., 2012; Barr & Prillwitz, 2012; Delmelle et al., 2013; Kamruzzaman et al., 2013). This latter is also the only significant factor pertaining to life situation that influences social satisfaction (Delmelle et al., 2013). Interestingly, the same factor has a negative impact on environmental sustainability.
2.4.4.2 Lifestyle
Variables related to lifestyle refer to preferences and attitudes (Aditjandra et al., 2012 ). A total of eight papers out of 17 investigated the influence of lifestyle factors on the congruity between the level of sustainability of people’s behaviors and their places of residence. Barr & Prillwitz (2012) identified four behavioral profiles with regard to transport: «Addicted Car Users», who used the car most frequently and lived in low-density places did not show pro-environmental attitudes. « Aspiring Green Travellers», who still relied on the car, but used other transport modes, especially active transport, and had strong environmental attitudes. «Reluctant Public Transport Users» used public transport as their primary transport mode, but had relatively negative environmental attitudes. Finally, «Committed Green Travellers», whose attitudes matched their behaviors. These individuals relied on walking and had strong pro-environmental attitudes. With no surprise people favoring public and active transport drove less, and those who preferred easy access to shopping facilities drove more (Aditjandra et al., 2012).
Residential consonance or dissonance refers to the match or mismatch between actual and preferred residential neighborhood. It was studied by De Vos et al. (2012) and Kamruzzaman et al. (2013). Both studies found that the residential consonance or dissonance had a significant influence on travel mode choice, especially on public and active transport. On the other hand, built environment had a stronger impact on car use compared to the other modes of transport. Namely, urban consonants and rural dissonant were more likely to use AT and PT and urban dissonant and rural consonants were more likely to use car, with a lower degree of association compared to the previous group because car use is more influenced by built environment. Consideration for School quality considerations were positively associated with required travel and negatively related to excess travel (Fan et al., 2011). People who considered schools quality in their residential choice had fewer opportunities to concentrate their other daily activities (Fan et al., 2011). According to (Fan et al., 2011), smaller excess travel may