HAL Id: hal-02161929
https://hal.archives-ouvertes.fr/hal-02161929
Submitted on 21 Jun 2019
HAL is a multi-disciplinary open access
archive for the deposit and dissemination of
sci-entific research documents, whether they are
pub-lished or not. The documents may come from
teaching and research institutions in France or
abroad, or from public or private research centers.
L’archive ouverte pluridisciplinaire HAL, est
destinée au dépôt et à la diffusion de documents
scientifiques de niveau recherche, publiés ou non,
émanant des établissements d’enseignement et de
recherche français ou étrangers, des laboratoires
publics ou privés.
Design and fabrication of a high-density 2D fiber array
for holographic swithching applications
Cédric Letort, Bruno Vinouze, Bruno Fracasso
To cite this version:
Cédric Letort, Bruno Vinouze, Bruno Fracasso. Design and fabrication of a high-density 2D fiber
array for holographic swithching applications. Optical Engineering, SPIE, 2008, 47 (4), pp.045401.
�10.1117/1.2911718�. �hal-02161929�
Design and fabrication of a high-density 2D fiber
array for holographic switching applications
Cedric Letort Bruno Vinouze Bruno Fracasso ENST Bretagne Optics Department UMR 6082 Foton
CS 83818-29238, Brest Cedex 3, France E-mail: cedric.letort@enst-bretagne.fr
Abstract. Holographic two-dimensional beam steering using a
pixel-lated spatial light modulator共SLM兲 is a flexible and accurate technique to implement advanced space-switching, building-block functions for optical network nodes. We present the design of a specific fiber array for large-capacity holographic switches. We use two-dimensional and irregular array topology to optimize the space-bandwidth product of the SLM and to avoid crosstalk due to the coupling of higher diffraction orders. The fiber-array module is integrated by inserting the fibres through a pair of etched silicon plates aligned and fixed using a steel mount. The device is tested through near-field and fiber-to-fiber free space coupling tests. An average fiber-to-fiber insertion loss of 1 dB is achieved for a prototype containing 64 fibers.© 2008 Society of Photo-Optical Instrumentation Engineers. 关DOI: 10.1117/1.2911718兴
Subject terms: optical fiber array; wavelength-selective switch; spatial light modulator; liquid crystal spatial; light modulator; binary-phase hologram.
Paper 070648R received Aug. 1, 2007; revised manuscript received Nov. 21, 2007; accepted for publication Jan. 2, 2008; published online Apr. 30, 2008.
1 Introduction
In the last few years, dense wavelength-division multi-plexed 共DWDM兲-based optical telecommunications net-works have been massively deployed to face the dramatic traffic rise generated by Internet services. The introduction of transparent cross-connecting nodes in the optical net-work is increasingly put forward to obtain more flexibility and reconfigurability at the optical layer.1A key issue then is the availability of flexible all-optical switching modules, in which different operations are implemented, such as space routing, wavelength extraction, or power equaliza-tion.
In this context, the wavelength-selective switch共WSS兲 appears as a key technology that performs both selective routing and dynamic power control of the optical channels.2 Although planar ligthwave architectures3yield WSS imple-mentations with high density integration, free space-based solutions are currently the most promising in terms of in-sertion loss共⬇5 dB兲, channel isolation 共40 dB兲, and polar-ization sensitivity共PDL ⱕ1 dB兲. Technologically speaking, the dynamic spatial-routing function of the optical channels is performed through beam deflection using either micro-electromechanical systems 共MEMS兲 mirror arrays4 or a two-dimensional liquid crystal spatial light modulator 共LC-SLM兲.5
Within that frame and before the advent of WSS, holo-graphic beam steering using LC-SLMs had been demon-strated as an interesting technique to increase the accuracy, repeatability, and stability of micro-beam steerers within optical space switches.6,7Optical space switching was also backed up with dynamic wavelength-filtering capabilities. This was demonstrated for a one-dimensional 1⫻14 holo-graphic switch exhibiting 8.5-dB loss with multicast
capabilities.7The major limitation was a rather poor chan-nel isolation level共−21 dB max兲, due to a one-dimensional beam steering and fiber array geometry. Moving to a two-dimensional geometry was then considered a decisive op-tion to increase the switch capacity while decreasing the cross-talk levels. The first step has already been performed with the specific adaptation of a two-dimensional LC-SLM for telecommunications uses on a pre-industrial levels.8The device was a silicon backplane 1280⫻1024 pixel 共SXGA兲 ferroelectric spatial light modulator operating in the 1.55-m wavelength range. The second step consists of designing and fabricating a 2D fiber-array structure provid-ing high-capacity and low-crosstalk values in the present holographic beam-steering configuration. This will be pre-sented throughout this paper, which is organized as follows: The diffraction model for holographic beam steering is pre-sented in Section 2 to describe the diffraction orders distri-bution impinging onto the output plane共replay field兲. This determines the constraints for the fiber-array design algo-rithm. Section 3 presents the design and fabrication of a specific 2D fiber-array prototype meeting the capacity and crosstalk requirements. The component is then tested and the experimental results are presented in Section 4.
2 Fiber-Array Custom Design 2.1 Holographic Switching Setup
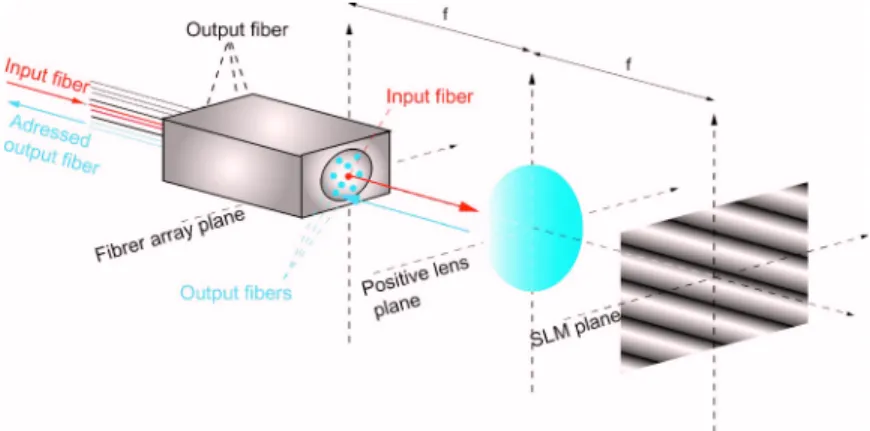
The principle of a 1⫻N holographic optical space switch6,7 is depicted in Fig.1. The input fiber mode is imaged onto the targeted output fiber core using a folded telecentric op-tical setup共4f architecture兲. The positive lens is an achro-mat doublet coated with a 1.5-m antireflection layer, whose focal length and numerical aperture are determined to minimize aberration and vignetting of the expanded fiber-mode field. The intermediate beam deflection is per-formed by a reflective LC-SLM displaying phase gratings
共or holograms兲, which, since the input and output fibers are located in the same fiber array holder, permits us to limit the switch length while improving the opto-mechanical alignment procedure. The angular deviation resulting from the beam passing through the hologram is transformed into a spatial offset at the output 共replay兲 plane. Overall, this system can be considered a fiber spatial correlator. Com-pared to MEMS reflective techniques, diffractive beam-steering provides motionless and high-capacity space switching with wavelength-band selection capabilities.7 Both techniques have their own advantages: Micro-mirror arrays have low loss and are intrinsically independent of the polarization and wavelength of the input light. On the other hand, LC holographic modules operate with no mov-ing parts and can be used not only to steer optical beams but also to address several output fibers simultaneously, providing natural channel-bridging capabilities, as well as to shift the spectral response of the selected optical output.7 These two points represent a decisive advantage over MEMS technology in terms of system flexibility.
Using liquid crystal technology, various phase modula-tions can be achieved depending on the LC material choice. An almost continuous-phase profile can be obtained with a
nematic LC, but the phase modulation depth is polarization-dependent. In contrast, a Smectic C liquid crystal—often referred to as ferroelectric liquid crystal 共FLC兲—makes the device purely polarization-insensitive, with a switching time of a few hundreds of microseconds,6–8 but to the detriment of diffraction effi-ciency. The recent introduction of 2D-LCOS共Liquid Crys-tal on Silicon兲 SLM devices operating in the 1.55-m tele-communication window for both WSSs5 and holographic switches8 makes the design of large-capacity 共i.e., output port count⬎100兲 devices possible.
In that framework, a key step is the design of an opti-mized 2D single-mode fiber array that takes advantage of the high-output port count addressing capabilities of holo-graphic deflectors.
2.2 Holographic Beam-Steering Model
A detailed analysis of the optical reconstruction generated by pixellated and phase-quantized LC-SLMSs can be found in the literature.9We shall briefly present the reconstruction model for binary and pixellated hologram patterns with the purpose of determining the relevant steering parameters,
Fig. 2 Three-dimensional higher diffraction order distribution generated by a binary-phase 2D grating. Fig. 1 Reflective holographic space-switch architecture.
namely the intensity and location of the higher diffraction orders. Using this information, we will be able to derive the beam-coupling ratio at any position of the output fiber plane and hence design a 2D fiber-array topology that mini-mizes the holographic switch crosstalk. Geometrical con-straints like aberration and vignetting at the Fourier lens will have a limited influence if the optical setup is properly designed.7These parameters will hence not be considered in the model. The ideal routing holographic pattern is the blazed grating hologram that produces a unique replay of the input fiber mode at a given output fiber location. More precisely, if 共aj, bj兲 are the coordinates of the jth output
fiber 共i.e., the core center location兲, the two-dimensional information to be displayed at the SLM plane is the peri-odic phase-only distribution given by
H共x,y兲 = exp
再
−2if 共ajx + bjy兲
冎
, 共1兲where and f denote, respectively, the wavelength and the focal length. The spatial periods in the x and y dimensions are given by Txj=f /aj and Ty
i
=f /bj. The encoding of
distribution 共1兲 onto a pixellated binary-phase function is required to physically display the steering information onto an FLC-SLM. This operation can be represented by a pro-cedure involving three steps. The phase of the steering
function H is first quantized by comparing the real part R共H兲 of the complex function to a threshold level. The resulting binary phase grating Hqtakes thephase level if R共H兲⬍and the+ value otherwise. Thevalue con-trols the compression ratio␣of the binary grating Hq. The optimized case is= 0 as it yields a balanced grating with
␣= 0.5, and hence no energy in the zeroth diffraction order. Then, the pixellation and dead-space共interpixel兲 effects are introduced. If we consider a pixel pitch value of p and a pixel size of p0共p0⬍p is the size of the modulating pixel zone兲, the holographic steering distribution Hs共x,y兲 will
re-sult from a multiplication of Hqwith a 2 Dirac distribution
Wp共x,y兲 共p is the pixel grid/pitch兲, followed by the
convo-lution of the result with a square distribution 兿p0 of size p0⫻p0, representing the pixel shape. The SLM fill factor is
given by the ratio F =共p0/ p兲2. This finally gives us Hs共x,y兲 = 兵Hq共x,y兲Wp共x,y兲其
*
兿
p0
共x,y兲, 共2兲 where 兿p0共x,y兲=1 if 兩x兩 ⱕp0 and 兩y兩 ⱕp0, and 兿p0共x,y兲
= 0 elsewhere,
*
standing for the convolution operation. The SLM limited size will be discussed later. Note from relation共2兲that the grating periods Txand Tyare nowquan-tized by the pixel pitch p in the form Tx= pNx and Ty
= pNy, with Nx and Ny the number of pixels per period in
each dimension. The relative complex amplitudes Clmnand
positions Plmnof all the replay orders can be determined by
calculating the Fourier transform H˜s共,兲 of Hs共x,y兲 from 共2兲, yielding,10for l⫽0, Clmn=sinc共␣l兲sinc
再
冑
F冋
m + 1 Nx册
冎
sinc再
冑
F冋
n + 1 Ny册
冎
and Plmn=冉
冋
m + 1 Nx册
, 冋
n + 1 Ny册
冊
, 共3兲where sinc共x兲=sin共x兲/共x兲,= 2␣F, and=f /p. As illustrated in Fig. 2, relation 共3兲 represents a three-dimensional diffraction-order 共l兲 distribution, where the replication is caused by the phase-level binarization, while the spatial quantization operation共pixellation兲 produces the 2-D replication along with the m and n directions. Due to the spatial convolution generated by the 4f optical setup, the input fiber mode will be spatially convolved with the
H˜s共,兲 distribution, yielding a constellation of weighted and shifted replications as given by relation 共3兲. The 共l = 1 , m = 0 , n = 0兲 term is the main “peak” addressing the out-put fiber at position共a,b兲. We can then derive from共3兲the diffraction efficiency, as a function of the grating periods 共Nx, Ny兲: 共Nx,Ny兲 = 兩C100兩2= 4F2 2 sinc 2
冉
冑
F Nx冊
sinc2冉
冑
F Ny冊
, 共4兲 where we have considered a balanced grating共␣= 0.5兲 for simplicity. The upper limit in is obtained when Nx, NyFig. 3 Diffraction efficiency evolution versus pixel per period
num-ber Nxas a function of Ny. Negative values correspond to symmetric gratings with respect to the y-axis.
Fig. 4 Exclusion disk method to remove potential crosstalk
posi-tions from the fiber location search space.
→⬁ and F→1, yieldingmax= 4/2= 0.41. Figure3shows
that diffraction efficiency 共or steering efficiency兲 is rela-tively constant for grating period values Nxⱖ4 and
de-crease significantly for smaller pixel per period number. Expression 共4兲 being symmetric with respect to Ny, we
shall restrict the grating period search space to Nxⱖ4 and Nyⱖ4, which will ensure that共Nx, Ny兲ⱖ0.3.
The steering model could be further refined by consid-ering deviations in the FLC cell parameters with respect to their optimal value, e.g., cell thickness, birefringence, and tilt angle. However, such variations will not affect the crosstalk evaluation and hence the basic steering model will be kept for the remainder of the discussion. Conversely, the limited size of the SLM will modify the output plane irra-diance distribution, and the correction will be included in the fiber-array design algorithm presented in the next
sec-tion. The final step of the modeling will consist of calcu-lating the coupling ratios between the input replicated modes and the output fibers. This point will be addressed in the next section.
2.3 Crosstalk Model
The input fiber mode replica as given by共3兲will potentially generate crosstalk at the output plane. The description of the crosstalk events strongly depends on the output fiber placement process, which will be detailed in the next sec-tion. For the moment, we suppose that Nf fibers have been
placed, each corresponding to a position 共aj, bj兲 with 1
ⱕ jⱕNf, with an addressing grating described by an
共Nx j
, Ny
j兲 pair. The question then is to know if a new grating
with共Nxj+1, Nyj+1兲 pixels per period is acceptable taking into
Fig. 5 Fiber core placement algorithm principle.
Fig. 6 Fiber array layout with 141 SM fibers placed within a 1.2⫻1.2-mm square.
account the fiber positions already set. Using its main 共1,0,0兲th order, this grating will address a fiber position located at the output coordinates aj+1=/ pNx
j+1
and bj+1
=/Ny j+1
. Hence, two types of crosstalk conditions can be considered. First, the crosstalk between the higher orders corresponding to previously placed fibers and the virtually present tested fiber共referred to as past or P-crosstalk兲, and, second, the crosstalk between higher orders of the present 共Nx
j+1
, Ny
j+1兲 grating and the set of previously placed N f
fi-bers共referred to as future or F-crosstalk兲.
Crosstalk evaluation is based on the calculation of the optical intensity coupling of the incident Gaussian beams in the closest output fibers. We shall suppose that the optical setup is correctly aligned, with no focusing offset and tilt angle between the incident and output modes. The two waists 共incoming beam and output fiber兲 will also be sup-posed to be equal, as the fibers are located in the same array. Under these assumptions, crosstalk evaluation will depend only on the distance⌬r between a given incident input mode replica position Plmn
k 关corresponding to a
previ-ously calculated k grating, as given by共3兲兴 and the present tested output fiber position 共aj+1, bj+1兲. The intensity
cou-pling ratio between the incident mode and the fiber will be given by Icoupl共⌬r兲 = 兩Cnlm k 兩2exp
冉
−⌬r 2 0 2冊
, 共5兲where0is the waist radius of both the incident Gaussian
beam and the output fiber. The resulting power isolation value共normalized with respect to the diffraction efficiency兲 will be given by the relation
X共dB兲 = 10 log10
冉
Icoupl 兩C100 k 兩冊
⬇ − 4.3冉
⌬r 0冊
2 + 20 log10冉
兩Cnlm k 兩 兩c100 k 兩冊
. 共6兲In order to process the crosstalk issue in an efficient manner in the fiber-positioning algorithm, one approach is to define
forbidden crosstalk areas surrounding higher-orders
posi-tions so that future fibers cannot be placed if the port iso-lation is worse than a given reference value X0.
As an example, we consider the higher diffraction order shown in Fig.4and located at position Plmnk . Using Eq.共6兲, a radius⌬r共X0兲 is calculated so that an isolation value
bet-ter than X0is obtained from共6兲if the output fiber is placed
outside a disk of center Plmn k
and radius ⌬r共X0兲. An
addi-tional safety radius margin corresponding to a fiber diam-eter d is added to compensate for possible fiber placement errors occurring during the fabrication process. This finally means that no optical fiber core center will be allowed in a disk of center Plmn
k
and radius R =⌬r共X0兲+d.
Fig. 7 共a兲 Top view of the bare silicon fiber holder with etched holes.
共b兲 Side view after the fiber threading step.
Fig. 8 共a兲 Fiber-array packaging view. 共b兲 Exit side of the fiber array
after the polishing stage共64 fibers have been threaded兲. Letort, Vinouze, and Fracasso: Design and fabrication of a high-density 2D fiber array…
2.4 Fibre Array Design Algorithm Principle
Considering the beam-steering model described so far, the next step will consist of designing a fiber-array topology meeting the two major constraints pursued for the holo-graphic switch i.e.,共1兲 high-capacity and 共2兲 low crosstalk levels. We propose an iterative procedure depicted in Fig.
5, for which the basic idea consists of sweeping the grating period space. For each 共Nx, Ny兲 value, the placement of a
fiber at the addressed position 共i.e., 关1, 0, 0兴th, deflected output peak location兲 will be validated or not, depending on the following three conditions:
1. Diffraction efficiency constraint: The first step of the fiber placement process is to select an 共Nx, Ny兲 pair
greater than a specified value共Nx, y⬎4兲
correspond-ing to high steercorrespond-ing efficiency in the first diffracted order共see Fig.3兲.
2. Minimal distance between fibers: The fiber placement density is limited by the minimum spacing␦between two adjacent fibers. Considering a standard SMF fi-bers with a 125-m cladding diameter, we will choose ␦= 130m. Using thinned cladding optical fibers 共down to 40m兲 is technically feasible but will not be considered here.
3. Crosstalk condition: The position and intensity of all the diffraction orders in the output plane are calcu-lated using 共3兲. The power isolation of each k input mode replica in the present 共Nx, Ny兲 output fiber is
calculated and compared to a reference threshold 共X0= 40 dB is the standard value兲. Equation共6兲of the
crosstalk forbidden zone is derived and transformed into an equation in Nxand Nyto determine the grating
period that will be rejected.
At last, if all criteria are respected, the new position corre-sponding to the共Nx, Ny兲 pair is accepted. If not, the position
is rejected.
2.4.1 Capacity estimation
The fiber-addressing capacity intuitively depends on both the fiber core diameter d and the size of the addressed space in the output plane per dimension, given by⍀=f /p 共p is the pixel pitch兲. The inversely proportional relationship be-tween the number of pixels per period Nx and the output
position a reached by the first order 共a=/Nx兲 generates
densely populated areas at the center of the addressing zone 共for large Nx values兲 and sparsely populated areas away
from the center共smaller Nxvalues兲. Thus, an estimate N of
the holographic switch capacity per dimension can be given11by
N = 2
冉
冑
⍀d − 1
冊
. 共7兲For the standard parameter values as used in Ref. 7 共p
= 13m, f = 40.5 mm, d = 125m, and =1.55m兲, one obtains a 2D capacity estimate of N2= 110 fibers. It is
ex-pected, however, that this value will be exceeded by the results obtained with the truly 2D geometrical search per-formed by the iterative algorithm described above.
Fig. 9 Result of polished output fiber beam shape with Gaussian profile measured with near-field
experimental setup.
Fig. 10 Output beam angular test setup.
2.5 Results
The algorithm shown in Fig. 5 is implemented using a computer-controlled procedure. The algorithm parameter values are intrinsically linked to such experimental condi-tions as SLM physical properties, optical setup dimensions, and fiber array technology. Thus, the fiber placement pro-cess will generate a non-unique solution, depicted in Fig.6. The base pattern共A-zone兲 contains 32 fibers configured on an irregular lattice. It is replicated by a vertical axial sym-metry to form the D-zone. Point symmetries with respect to the central fiber 共denoted by “E”兲 provide the C- and B-zone, respectively. Nine other fibers are placed along the
x- and y-axes of the output plane. This finally gives a total
capacity of 141 fibers located in a 1.2-mm⫻1.2-mm square, this topology meets the previously defined crosstalk requirements. This configuration permits us to exploit the symmetrical position of diffraction orders generated by bi-nary phase gratings. This property can be useful to imple-ment a 1 + 1 bridging function in the switching device,7 providing natural optical protection of the WDM network layer.
The layout shown in Fig.6 will be used as a reference pattern to fabricate 2D matrices, from low capacities共⬍10 ports兲 to several tens of output fibers.
3 Fiber-Array Fabrication 3.1 2D Fiber Holder Etching
The first step in the fiber-array manufacturing process is the choice of a 2D fiber holding technology. In this context, a well-known technology consists of superimposing 1D V-grooves,12which enables the fabrication of fiber arrays in various materials with a high positioning accuracy. As an alternative solution, a fiber-array fabrication process in which the fibers are embedded in adjacent ceramic ferrules arranged in a honeycomb topology has been proposed.13 The device was equipped with individual micro-optics at the end face of the fibers in order to enlarge the mode diameter and thus release the alignment constraints related to optical free space interconnections. A third technology option is based on micro-holes etching through a silicon plate. This mechanical holding system is used to minimize the fiber location and pointing errors, provided that the hole depth is long enough to guide and maintain the fiber in the reference position. A reasonable value for the drilled holder thickness is four times the fiber cladding diameter, i.e., about 500m for standard SMF fibers. This method also
provides high flexibility and accuracy in the fiber place-ment scheme. Due to the fiber density required共as shown in Fig.6兲, this is the preferred option here. The basis for our
fiber-array integration process is a silicon plate holder 共530-m thickness兲, whose thermal expansion coefficient is known to be very low, containing precisely etched holes placed as in Fig. 6. This micro-drilled plate is fabricated using a complex deep reactive ion etching共DRIE兲 process, providing holes with conical shapes on one side for an easier fiber insertion. The measured entrance and exit hole diameter specifications are 130⫾2.0m and 126⫾1.0m, respectively. Although controlling the etched holes profiles with such an accuracy is a complex task, several batches of components were successfully etched and cleaned关Fig.7共a兲兴. The fibers are then precisely inserted in the desired etched holes using a threading pro-cess controlled with a binocular microscope. The fibers are then fixed to the silicon plate with an Epotecny NOA 61 UV glue dedicated to the integration of opto-mechanical systems. This operation is achieved in a vacuum chamber in order to fill the gap between the fiber claddings and the hole walls. Each fiber is then reinforced with a polymer sheath whose diameter ds depends on the final fiber-array
capacity共typically, ds= 900m for capacityⱕ32 fibers and ds= 600m for capacityⱖ32 fibers兲.
Four types of fiber arrays with different capacities of 16, 32, 64, or 128 fibers are manufactured using the fiber holder shown in Fig.7共a兲.
3.2 Fiber-Matrix Packaging
In a second step, a steel mount is specifically machined to the silicon plate geometry, which is precisely fixed to the output face of the steel mount using Epotecny UVS-91 UV glue. This operation will determine the final ouput fiber-plane direction. As illustrated in Fig.8共a兲the optical fibers are then collected with a heat-retractable sheath that is in-terlocked with the steel mount using liquid NOA 61 UV glue, so that the optical fiber,array remains mechanically reinforced during the next critical polishing step.
The polishing phase is performed with a custom proce-dure to maintain flatness and optical quality across the ar-ray. The fiber-to-fiber coupling ratio will directly depend upon the quality of the polishing step. The difficulty here is to impose the right fiber end-face orientations 共i.e., right
Fig. 11 Fiber-to-fiber coupling loss measurement setup.
Fig. 12 Fiber-to-fiber coupling loss results for a 32-output fiber
array.
angle with respect to the fiber axes兲 by polishing all the fibers simultaneously and in the same conditions. To this aim, a custom-designed stainless steel polishing clamp is used to fix the fiber-array mount during the whole polishing operation. The fiber array is polished using a horizontal rotating platen with an abrasive surface whose granularity is gradually reduced from 50m to 0.3m. The material residue draining process is optimized in order to avoid weakening of the output fiber surface. This point is periodi-cally controlled during the process by observing the output surface through a binocular microscope. Figure8共b兲shows a typical image of an acceptable end-face quality for the fiber array after the polishing stage 共64 fibers have been threaded兲.
4 Experimental Test Results
The purpose of the fiber-array characterization procedure is twofold. First, we will evaluate the optical quality of the fiber-array end face in order to validate the device fabrica-tion process; second, the fiber matrix is tested in an optical fiber interconnection setup to evaluate the fiber-to-fiber insertion loss.
4.1 Output Fiber-Plane Test
4.1.1 Near-field tests
The near-field experimental setup is used to measure the output fiber-beam shape. An infrared camera*is placed on the fiber-array optical axis, and optical beam profile mea-surement software is used to display the optical beam pro-file in both the vertical and horizontal axes. Figure9shows the measured intensity profile in two figure orthogonal di-rections, featuring the ideal case of a single-mode Gaussian beam emerging from a fiber end face with good optical quality.
4.1.2 Output beam angular tests
The same experimental setup principle is used to test the output fiber-surface orientation. The infrared camera is placed here at two different positions of the optical axis in order to compare the positions of the Gaussian beam center between a reference fiber and the tested fiber共cf. Fig.10兲.
The angular deviation␦ of the beam emerging from the tested fiber is determined by the equation
tan共␦兲 =共d2− d1兲
l , 共8兲
where d1and d2are the two distances between the incident
Gaussian beam centers from the two fibers measured at two positions separated by a distance l. The angular deviation can then be used to estimate the coupling efficiency varia-tion between the input and ouput fibers 共the latter is sup-posed to be perfectly aligned on-axis兲:
Icoupled共␦兲 = exp
冋
−冉
0
冊
2
·␦2
册
. 共9兲 The angular tests performed on a statistical set of 20 fibers have shown a negligible angular deviation, as they produce an average coupling efficiency variation lower than 0.1 dB.4.2 Fiber-to-Fiber Coupling Loss Measurement
An important step to assess the performance of the fiber matrix is to test the fiber-to-fiber coupling loss. This is achieved by replacing the SLM of Fig. 1 with a mirror optimized for near-infrared operation. The lens used is an achromat doublet共Melles-Griot兲 composed of two different glasses共BaLKN3 and SF15†兲. The fiber array is placed on 6-axis micro-positioning system in the reflective 4f setup shown in Fig.11.
The optical micro-bench is first aligned using a visible He-Ne laser light that is injected in the input fiber and coupled to an output fiber by moving the fiber array. The fiber-to-fiber coupling loss is then measured using infrared light at 1.55-m wavelength. The operation is repeated for a large number of input/output fiber pairs. Test results are proposed in Figs. 12 and 13 for 32 and 64 output fiber arrays, respectively, with a collection of more than 100 measurements between randomly chosen fiber pairs. The mean measured fiber-to-fiber losses are, respectively, 1.1 dB and 0.9 dB, with 0.3-dB standard deviation in both cases. These values are encouraging as the fiber end faces are not antireflection-coated.
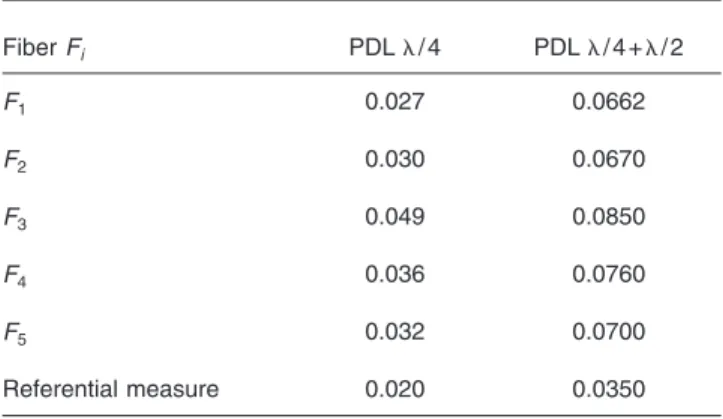
The final test consists of measuring the polarization-dependent coupling loss variation. It is performed on a set of randomly chosen fibers共the fiber array used is the com-ponent containing 64 fibers兲 by inserting a polarization con-troller between the emitted fiber and the addressed fiber. The fiber-to-fiber coupling efficiency variations between the maximum and minimum values for different polariza-tion states are given in Table 1 and reveal a negligible polarization-dependent loss for the tested fiber array.
*
Type IR-Vidicon camera; Model C2400-03; sensitive surface 12.9共H兲–
9.5共V兲; horizontal lines: 575 共CCIR兲. †Model #01LAL011.
Fig. 13 Fiber-to-fiber coupling loss results for a 64-output fiber
array.
5 Conclusions
We have reported the design of a 2D irregular fiber array dedicated to fiber-to-fiber holographic switching using a binary-phase steering device. We have proposed a specific high-density output fiber placement algorithm based on coupling efficiency maximization and crosstalk minimiza-tion.
Fiber-array prototype fabrication steps have been de-scribed, and two devices have been tested. The best com-ponent exhibits a 64-output fiber capacity with less than 1 dB fiber-to-fiber insertion loss and negligible polarization-dependent loss.
The next step is to integrate the fabricated fiber array in a dynamic holographical fiber-to-fiber switching setup. This operation as well as the performance of the resulting device are presented in a submitted publication.14
Acknowledgments
The authors would like to thank the Optogone/Memscap and PHS MEMS companies for funding and performing the wafer-etching process, and Michel Gadonna 共ENST Bretagne兲 for valuable discussions concerning the near-field characterization setup.
References
1. J. Strand and A. Chiu, “Realizing the advantages of optical reconfig-urability and restoration with integrated optical cross-connects,”J. Lightwave Technol.21共11兲, 2871–2882 共2003兲.
2. P. A. Bonenfant and M. L. Jones, “OFC 2003 workshop on wave-length selective switching based optical networks,” J. Lightwave
Technol. 22, 305–309共2004兲.
3. T. Goh, M. Ishii, T. Mizuno, S. Kamei, I. Ogawa, H. Hirota, Y. Tamura, M. Kobayashi, M. Yanagisawa, S. Sohma, and A. Kaneko, “Four-degree hub switch module using multi-chip planar lightwave circuit integration technology for transparent roadm ring interconnec-tion,” in Optical Fiber Communication Conference Technical Digest, pp. OTuF3.1–OTuF3.3共2006兲.
4. D. M. Marom, D. T. Neilson, D. S. Greywall, C.-S. Pai, N. R. Basa-vanhally, V. A. Aksyuk, D. O. López, F. Pardo, M. E. Simon, Y. Low, P. Kolodner, and C. A. Bolle, “Wavelength-selective 1⫻k switches using free-space optics and mems micromirrors: Theory, design, and implementation,”J. Lightwave Technol.23共4兲, 1620–1630 共2005兲.
5. G. Baxter, S. Frisken, D. Abakoumov, H. Zhou, I. Clarke, A. Bartos, and S. Poole, “Highly programmable wavelength selective switch based on liquid crystal on silicon switching elements,” in Optical
Fiber Communication Conference Technical Digest, pp. OTuF2.1–
OTuF2.3共2006兲.
6. W. Crossland, I. G. Manolis, M. M. Redmond, K. L. Tan, T. D. Wilkinson, M. J. Holmes, T. R.Parker, H. H. Chu, J. Croucher, V. A. Handerek, S. T. Warr, B. Robertson, I. G. Bonas, R. Franklin, C. Stace, H. J. White, R. A. Woolley, and G. Henshall, “Holographic optical switching: The ‘roses’ demonstrator,”J. Lightwave Technol.
18共1兲, 1845–1854 共2000兲.
7. B. Fracasso, J. L. de Bougrenet de la Tocnaye, M. Razzak, and C. Uche, “Design and performance of a versatile holographic liquid-crystal wavelength-selective optical switch,” J. Lightwave Technol.
21共10兲, 2405–2411 共2003兲.
8. K. Heggarty, B. Fracasso, C. Letort, J.-L. de Bougrenet de la Toc-naye, M. Birch, and D. Krüerke, “Silicon backplane ferroelectric liq-uid crystal spatial light modulator for uses within an optical telecom-munications environment,” Ferroelectrics 312, 39–55共2004兲. 9. K. Tan, S. T. Warr, I. G. Manolis, T. D. Wilkinson, M. M. Redmond,
W. A. Crossland, R. J. Mears, and B. Robertson, “Dynamic hologra-phy for optical interconnections. II Routing holograms with predict-able location and intensity of each diffraction order,” J. Opt. Soc. Am.
A 18共1兲, 205–214 共2001兲.
10. C. Letort, “Modélisation, implantation el caractérisation de fonctions de routage tri-dimensionnel de canaux optiques pour les réseaux WDM,” in PhD dissertation, Université de Rennes 1, pp. 149–154 共2007兲.
11. C. Letort, M. Razzak, B. Fracasso, and K. Heggarty, “Dynamic spec-tral response of a liquid crystal based optical channel selector,” in PS
2003—Photonics in Switching Conference, pp. 259–261共2003兲.
12. Corning, http://www.corning.com/docs/specialtymaterials/pisheets/ pi107.pdf.
13. P. Chanclou, M. Thual, J. Lostec, P. Auvray, J. Caulet, G. Joulie, A. Poudoulec, and B. Clavel, “Highly efficient collective coupling be-tween laser diode arrays,”Proc. SPIE3289, 97–102共1998兲.
14. C. Letort, B. Fracasso, and K. Heggarty, “Design and test of a 1 ⫻64 and crosstalk-free 2D-holographic liquid-crystal optical switch,” J. Lightwave Technol. submitted for publication.
Cedric Letort was a PhD student from GET/Ecole Nationale
Supérieure des Télécommunications de Bretagne共Brest, France兲. He received an engineering degree from Magistère Matériaux de Rennes I共France兲 and a PhD degree in Signal Treatment & Tele-communications from Université de Rennes I and Ecole Nationale Supérieure des Télécommunications de Bretagne in 2007. He is currently involved in engineering projects on optical instrumentation for satellite application at CNES共Toulouse, France兲.
Bruno Vinouze has been an associate professor at TELECOM
Bretagne in the Optical Department since 2001. He graduated from INSA in Physics in 1996. In a France Telecom Research Center he has over 20 years of experience in the liquid crystal domain in LC displays 共2S and 3S TFTLCD兲 and specific telecom LC devices 共switches, VOA, MUX, tunable filters兲. Between 1999 and 2001 he has been involved in R&D for different telecom start-up. He lectures in the telecom physic layers, especially on optical components. He is the co-author of more than 46 publications and has 26 patents.
Bruno Fracasso is an associate professor at GET/Ecole Nationale
Superieure des Telecommunications de Bretagne共Brest, France兲. He received an engineering degree from Ecole Nationale Supérieure des Telecommunications de Bretagne in 1989 and a PhD degree in Electrical Engineering from Université de Haute Al-save, Mulhouse 共France兲 in 1993. He is currently involved in re-search projects on optical switching for and routing within fiber net-works, combining device modelling, simulation and technological integration.
Table 1 Polarization-dependent loss measurement共64-fiber array兲.
Fiber Fi PDL/4 PDL/4+/2 F1 0.027 0.0662 F2 0.030 0.0670 F3 0.049 0.0850 F4 0.036 0.0760 F5 0.032 0.0700 Referential measure 0.020 0.0350