HAL Id: hal-02916032
https://hal.archives-ouvertes.fr/hal-02916032
Submitted on 17 Aug 2020
HAL is a multi-disciplinary open access
archive for the deposit and dissemination of
sci-entific research documents, whether they are
pub-lished or not. The documents may come from
teaching and research institutions in France or
abroad, or from public or private research centers.
L’archive ouverte pluridisciplinaire HAL, est
destinée au dépôt et à la diffusion de documents
scientifiques de niveau recherche, publiés ou non,
émanant des établissements d’enseignement et de
recherche français ou étrangers, des laboratoires
publics ou privés.
E2Clab: Exploring the Computing Continuum through
Repeatable, Replicable and Reproducible Edge-to-Cloud
Experiments
Daniel Rosendo, Pedro Silva, Matthieu Simonin, Alexandru Costan, Gabriel
Antoniu
To cite this version:
Daniel Rosendo, Pedro Silva, Matthieu Simonin, Alexandru Costan, Gabriel Antoniu. E2Clab:
Ex-ploring the Computing Continuum through Repeatable, Replicable and Reproducible Edge-to-Cloud
Experiments. Cluster 2020 - IEEE International Conference on Cluster Computing, Sep 2020, Kobe,
Japan. pp.1-11, �10.1109/CLUSTER49012.2020.00028�. �hal-02916032�
E2Clab: Exploring the Computing Continuum
through Repeatable, Replicable and Reproducible
Edge-to-Cloud Experiments
Daniel Rosendo
∗, Pedro Silva
†, Matthieu Simonin
∗, Alexandru Costan
∗, Gabriel Antoniu
∗ ∗University of Rennes, Inria, CNRS, IRISA - Rennes, France{daniel.rosendo, matthieu.simonin, alexandru.costan, gabriel.antoniu}@inria.fr
†Hasso-Plattner Institut, University of Potsdam - Berlin, Germany, [email protected]
Abstract—Distributed digital infrastructures for computation and analytics are now evolving towards an interconnected ecosys-tem allowing complex applications to be executed from IoT Edge devices to the HPC Cloud (aka the Computing Continuum, the Digital Continuum, or the Transcontinuum). Understanding end-to-end performance in such a complex continuum is challenging. This breaks down to reconciling many, typically contradicting application requirements and constraints with low-level infras-tructure design choices. One important challenge is to accurately reproduce relevant behaviors of a given application workflow and representative settings of the physical infrastructure underlying this complex continuum. In this paper we introduce a rigorous methodology for such a process and validate it through E2Clab. It is the first platform to support the complete analysis cycle of an application on the Computing Continuum: (i) the configuration of the experimental environment, libraries and frameworks; (ii) the mapping between the application parts and machines on the Edge, Fog and Cloud; (iii) the deployment of the application on the infrastructure; (iv) the automated execution; and (v) the gathering of experiment metrics. We illustrate its usage with a real-life application deployed on the Grid’5000 testbed, showing that our framework allows one to understand and improve performance, by correlating it to the parameter settings, the resource usage and the specifics of the underlying infrastructure. Index Terms—Reproducibility, Methodology, Computing Con-tinuum, Edge Intelligence.
I. INTRODUCTION
The explosion of data generated from the Internet of Things (IoT) and the need for real-time analytics has resulted in a shift of the data processing paradigms towards decentralized and multi-tier computing infrastructures and services [1]. New challenging application scenarios are emerging from a variety of domains such as personalized healthcare, asset lifetime monitoring in industry (e.g., for bridges, wind turbines, energy transportation systems), precision agriculture and smart cities, where processing can no longer rely only on traditional approaches that send all data to centralized datacenters for processing. Instead, they need to leverage myriads of resources close to the data generation sites (i.e., in the Edge or the Fog) in order to promptly extract insights [2], while keeping a reasonable resource usage and preserving privacy constraints. This contributes to the emergence of what is called the Computing Continuum [3] (or the Digital Continuum or the
Transcontinuum). It seamlessly combines resources and ser-vices at the center (e.g., in Cloud datacenters), at the Edge, and in-transit, along the data path. Typically data is first generated and preprocessed (e.g., filtering, basic inference) on Edge devices, while Fog nodes further process partially aggregated data. Then, if required, data is transferred to HPC-enabled Clouds for Big Data analytics, Artificial Intelligence (AI) model training, and global simulations.
However, despite an always increasing number of dedi-cated systems for data processing on each component of the continuum (e.g., Apache Edgent [4] at the Edge, Apache Spark [5] in the Cloud datacenter, etc.), this vision of ubiq-uitous computing remains largely unrealized. This is due to the complexity of deploying large-scale, real-life applications on such heterogeneous infrastructures, which breaks down to configuring a myriad of system-specific parameters and reconciling many requirements or constraints, e.g., in terms of interoperability, mobility, communication latency, energy and network efficiency, data privacy. A first step towards reducing this complexity and enabling the Computing Continuum vision is to enable a holistic understanding of performance in such environments. That is, finding a rigurous approach to answer-ing questions like: how to identify infrastructure bottlenecks? which system parameters and infrastructure configurations impact on performance and how?
Approaches based on workflow modelling [6] and sim-ulation [7], [8] raise some important challenges in terms of specification, modelling, and validation in the context of the Computing Continuum. For example, it is increasingly difficult to model the heterogeneity and volatility of Edge devices or to assess the impact of the inherent complexity of hybrid Edge-Cloud deployments on performance. At this stage, experimental evaluation remains the main approach to gain accurate insights of performance metrics and to build precise approximations of the expected behavior of large-scale applications on the Computing Continuum, as a first step prior to modelling.
A key challenge in this context is to be able to reproduce in a representative way the application behavior in a controlled environment, for extensive experiments in a large-enough spectrum of potential configurations of the underlying hybrid
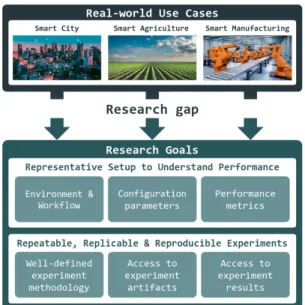
Fig. 1: Enabling representative 3R’s experiments of real-world use cases in the Computing Continuum.
Edge-Fog-Cloud infrastructure. In particular, this means rigor-ously mapping the scenario characteristics to the experimental environment, identifying and controlling the relevant config-uration parameters of applications and system components, defining the relevant performance metrics. The above process is non-trivial due to the multiple combination possibilities of heterogeneous hardware and software resources, system components for data processing, data analytics or AI model training. Furthermore, in order to allow other researchers to leverage the experimental results and advance knowledge in different domains, the testbed needs to enable three R’s of research quality: Repeatability, Replicability, and Repro-ducibility (3R’s). This translates to establishing a well-defined experimentation methodology and providing transparent ac-cess to the experiment artifactsand experiment results.
The Computing Continuum vision calls for a rigorous and systematic methodology to map the real-world application components and dependencies to infrastructure resources, as illustrated in Figure 1, a complex process that can be error prone. Key research goals are: 1) to identify relevant charac-teristics of the application workloads and of the underlying infrastructure as a means to enable accurate experimentation and benchmarking in relevant infrastructure settings in order to understand their performance; and 2) to ensure research quality aspects such as the 3R’s.
In this paper we aim to address these goals through the following main contributions:
• A rigorous methodology for designing experiments with real-world workloads on the Computing Con-tinuum spanning from the Edge through the Fog to the Cloud; this methodology supports Open Science [9] and provides guidelines to move from real-world use cases to the design of relevant testbed setups for experiments enabling researchers to understand performance and to ensure the 3R’s properties (Section III);
• A novel framework named E2Clab that implements this
methodology and allows researchers to deploy their use cases on real-world large-scale testbeds, e.g., Grid’5000 [10] (Section IV). To the best of our knowledge, E2Clab is the first platform to support the complete analysis cycle of an application on the Computing Continuum: (i) the configuration of the experiment environment, libraries and frameworks; (ii) the mapping between application parts and machines on the Edge, Fog and Cloud; (iii) the deployment of the application; (iv) automated execution; and (v) gathering of experiment metrics;
• An illustration with a real-world Smart Surveillance System use case leveraging E2Clab to understand how the Cloud-centric and the hybrid Edge-Cloud processing approaches impact performance metrics such as latency and throughput (Section V).
II. BACKGROUND ANDMOTIVATION
This section introduces the Computing Continuum paradigm and explains our vision to experimentation on such an infras-tructure through the example of a real-life application. A. Edge-to-Cloud Computing Continuum
The Computing Continuum refers to a digital infrastructure jointly used by complex application workflows typically com-bining real-time data generation, processing and computation. It may include computing resources at central locations such as Cloud datacenters or supercomputers; IoT devices at the Edge; and intermediate infrastructure such as Fog systems.
Cloud infrastructures provide virtually ”unlimited” com-puting and storage resources used essentially for backup and data analytics for global insight extraction in a centralized way (in its datacentes). Data is first ingested at high rates through dedicated systems (such as Kafka [11], Pulsar [12], ZeroMQ [13], etc.) and then analyzed by Big Data processing frameworks (such as Flink [14], Spark [5], Storm [15], among others). They perform stream and batch analytics on vast historical data (in the order of Petabytes), AI model training, and complex simulations [1]. The goal is to help understand ”Why”the phenomena sensed at the Edge are happening.
Edge infrastructures refer to computing and storage re-sources located where the data originated. They consist of potentially many (e.g., millions of) smart devices sensing ”What” is happening in the environment and generating potentially huge data streams at potentially high rates [16]. Dedicated systems like Apache Edgent [4] and Apache Nifi [17] push intelligence from the Cloud to those devices and extract value from data in real-time (e.g., improving response times from seconds to milliseconds [18] compared to Cloud-based approaches), while preserving privacy and security (crit-ical data is analyzed locally and not sent remotely).
Fog infrastructures refer to a potentially large number of geographically-distributed resources located on the data path between the Edge and the Cloud. Examples include thousands of nodes such as gateways, antennas, routers and servers [19]. They can be used for in-transit processing on data aggregated from multiple neighboring Edge devices as a way to further
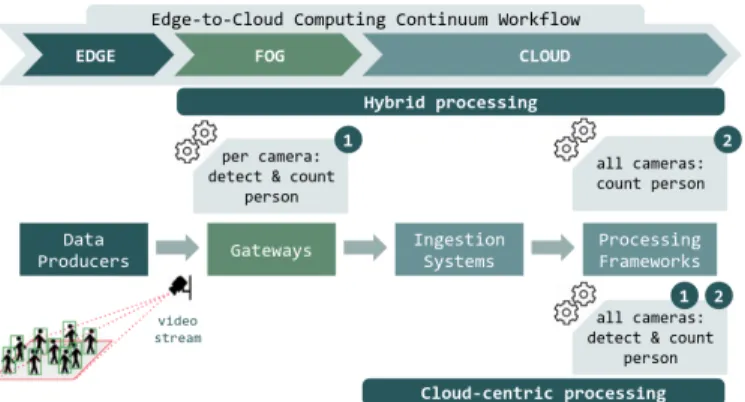
Fig. 2: The Smart Surveillance System workflow on the Edge-to-Cloud Computing Continuum.
reduce data volumes that need to be transferred and processed on Clouds. Lightweight frameworks typically based on mes-sage brokers (like Eclipse Mosquitto [20]) that implement the MQTT protocol [21] enable hierarchical processing and smart aggregation, minimizing latency and bandwidth usage. B. Meaningful Experiments on the Computing Continuum
Let us illustrate with a real-life use-case the settings, param-eters and metrics that need to be considered when setting up an experimental Computing Continuum testbed. The application is a Smart Surveillance System [22] which relies on resources from the Edge-to-Cloud Continuum to periodically identify the most crowded areas in a public space, as depicted in Figure 2. The video data processing consists of two phases: 1) detecting and counting, for each frame of a camera, the maximum number of persons; then 2) aggregating the maximum number of persons from all geographically distributed cameras to identify the most crowded area.
The question one aims to answer is: where on this con-tinuum should the video processing take place? The choices are between a Cloud-centric approach where both phases are executed on the Cloud (bottom of Figure 2), and a Hybrid approach where processing is split between the Fog and the Cloud (top of Figure 2). To address this question, one needs to explore a solution space in several dimensions: environment settings, configuration parameters and performance metrics.
The Smart Surveillance System consists of data producers such as cameras placed on the Edge; gateways in the Fog that receive per area video recordings from Edge devices, provide services like basic data processing and analytics, and forward the data to the Cloud; lastly, ingestion systems in the Cloud collect the video streams from all producers and push them to processing frameworks. These interconnected components define the experimental environment and workflow.
These components consist in a variety of hardware and software with different constraints and configuration param-eters that determine their actuation and scenario behaviour. For instance, the frequency of video frames on the producers, the streaming window on gateways or the reserved memory on processing frameworks impact on the workload and the end-to-end performance. Furthermore, the interconnection
ca-TABLE I: ACM Digital Library Terminology [25]
Repeatability
Same team, same experimental setup: the measurement can be obtained with stated precision by the same team using the same measurement procedure, the same measuring system, under the same operating conditions, in the same location on multiple trials. For computational experiments, this means that a researcher can reliably repeat their own computation.
Replicability
Different team, same experimental setup: the measurement can be obtained with stated precision by a different team using the same measurement procedure, the same measuring system, under the same operating conditions, in the same or a different location on multiple trials. For computational experiments, this means that an independent group can obtain the same result using the author’s own artifacts.
Repr
oducibility
Different team, different experimental setup: the measurement can be obtained with stated precision by a different team, a different measuring system, in a different location on multiple trials. For computational experiments, this means that an inde-pendent group can obtain the same result using artifacts which they develop completely independently.
pabilities vary between the Edge, Fog and Cloud due to the characteristics of those networks.
Performance metrics of interest in this context are: Fog to Cloud latency: the time required to send the data from gateways to ingestion systems; Fog to Cloud throughput: the amount of data per second that arrives in the ingestion systems; and end-to-end throughput: the rate of processed data sent by the processing framework. Besides, bandwidth, energy, CPU and memory usage are useful to assess the footprint of different design choices.
The definition domains of these environment settings and configuration parameters are extremely vast and their combina-tion of possibilities virtually unlimited. Hence, the process of relevantly mapping the real-world use case to an experimental setup is challenging: bad choices may result in limited or even wrong interpretation of the performance results.
C. Achieving 3R’s of Research Quality
As communities from an increasing number of scientific domains are leveraging the Computing Continuum, a desired feature of any experimental research is that its scientific claims are verifiable by others in order to build upon them. This can be achieved through repeatability, replicability, and reproducibility (3R’s) [23], [24]. There are many non-uniform definitions of the 3R’s in literature. In this paper, we follow the terminology proposed by the ACM Digital Library [25] (Artifact Review and Badging), as presented in Table I.
In our use-case, achieving repeatability means that one is able to reliably repeat the experiments and obtain precise measurements (e.g., Fog to Cloud latency, memory consump-tion) by using the same methodology and artifacts (i.e., same testbed, same physical machines, same ingestion system, same processing framework, same network configuration). Execut-ing multiple experiments allows to: explore different scenario settings (i.e., varying the number of Fog brokers or data
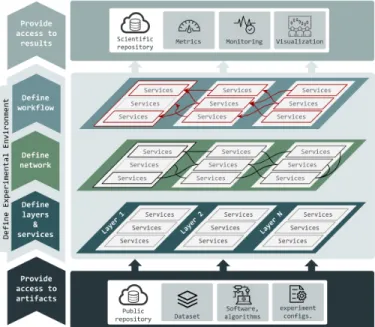
Fig. 3: Our experimental methodology.
producers, different ingestion systems and processing frame-works) and explore the impact of various parameters (i.e., the network configuration, the amount of memory reserved for processing frameworks) on the performance metrics.
Replicability refers to third party researchers having access to the original methodology and artifacts (i.e., configuration of physical machines, ingestion, processing, network) and obtaining precise results, close to the primary ones.
Lastly, reproducibility means that external researchers hav-ing access to the original methodology (i.e., configuration of physical machines, network and systems, scenario descrip-tions) and using their own artifacts (e.g., producers, ingestion systems, processing frameworks, datasets) can obtain precise measurements (of the latency and throughput, for instance).
Most of the challenges of achieving research 3R’s may be divided in three main categories: the need for a well-defined experimentation methodology; access to experiment artifacts; and access to experiment results.
III. METHODOLOGYOVERVIEW
Our methodology presented in this section is based on the take-aways of a previous study on Edge and Cloud computing trade-offs [22]. The specific experimental approach used for that study is generalized and defined here in a standalone methodology, which can be used by any application and deployed anywhere on the Computing Continuum. The methodology leverages three main processes which consist of a series of actions to achieve the high-level goals of this paper. Found at the left side of Figure 3 are these processes pipelined in a stream fashion.
A. Providing Access to Experiment Artifacts
This process, illustrated at the bottom of Figure 3, consists in providing access to all the research artifacts used to enable the experiments. They include: the original dataset used as
input to the experiments; the software, algorithms, libraries, etc., developed by experimenters or obtained from third par-ties; and the whole experiment configuration details such as the hardware specifications, execution parameters, the network configuration and the experiment workflow. In order to enable the 3R’s of experiments, all these research artifacts must be in a public and safe repository.
B. Defining the Experimental Environment
This process has as main goal to define the whole ex-perimental environment: the layers, the services, the network interconnect, and the experimental workflow, illustrated as sub-processes at the core of Figure 3.
The methodology is centered around the concepts of Ser-vices and Layers:
• Services represent any system that provides a specific
functionality or action in the scenario workflow. In the Smart Surveillance example, services may refer to pro-ducers, gateways or processing frameworks (e.g., a Flink cluster). A service can be made up of several components (e.g., Flink Task Managers, Job Managers etc.).
• Layers define the hierarchy between services and group them with different granularities. They can also be used to reflect the geographical distribution of the compute resources. In the context of the Computing Continuum, layersrefer to Edge, Fog, and Cloud, for instance. This layer and service abstraction targets experiments scala-bility and variation, since it allows to easily resize the number of layers and to analyze different scenario deployments such as single-layered (e.g., Cloud-only) or multi-layered (e.g., Edge + Cloud). Next, we describe the roles of each sub-process.
1) Define Layers and Services: specifies the layers and the servicesdeployed on each layer that compose the experi-mental scenario. Each service must be configured with its specific parameters and low-level configurations accord-ing to the experimenters requirements. Each service can be monitored (processor, storage, memory, network, I/O, etc.) during the execution of the experiments.
2) Define the Network: specifies the network communication rules between layers and between services. For each network communication the experimenter should be able to define specific network conditions and constrains. 3) Define the Workflow: specifies all the execution logic
and rules of the software, algorithms and applications running on services (i.e., data producers, ingestion sys-tems, processing engines, etc.). Such execution logic and rules refer to interconnections (e.g., mapping applications and services), life cycle, execution parameters, execution order, etc. Furthermore, this sub-process provides all dependencies required to properly initiate the execution logic of the services (e.g., libraries, datasets, etc). The workflow also includes supporting components (not in-cluded in the experiment analysis) to collect performance metrics, such as throughput, latency, among others. Note that breaking down the definition of the experimental environment in three well-defined sub-processes enables
flexi-bility and variaflexi-bility, since the definitions of each sub-process may be modified without impacting on the remaining ones. C. Providing Access to Experiment Results
This process, illustrated at the top of Figure 3, collects all the output generated during the experiments execution (i.e., log files, monitoring data, performance metrics, etc.). These outputs may be aggregated and analyzed according to the experimenters interests to derive insights and understand performance. Lastly, to enable the 3R’s, all the output data, the research results and the conclusions must be available in a public and safe repository.
IV. E2CLAB: THEMETHODOLOGYIMPLEMENTATION
To illustrate our methodology for experimentation on the Computing Continuum, we propose E2Clab, a framework which implements it. It may be used by researches to de-ploy real-life applications on large-scale testbeds and perform meaningful experiments in a systematic manner. Find out more about E2Clab on its documentation web page [26].
A. High-Level Perspectives and Architecture
E2Clab was developed with usability in mind: we pro-pose a structure for configuration files (presented in Table II and discussed in the next subsections). Those files allow experimenters to write their requirements in a descriptive manner. They are easy to comprehend, to use and to adapt to any scenario, reducing the effort of configuring the whole experimental environment.
Essentially, using only three configuration files the experi-menter describes the workflow (e.g., a Flink job), the layers and services that compose the scenario (e.g., a Flink cluster service in cloud layer), and the network specification (e.g., delays, losses, and rates within the Flink cluster). The frame-work abstracts from the users the complexity of the mappings between layers and services with the actual machines in the environment.
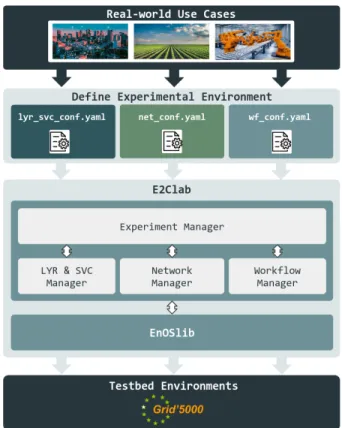
The E2Clab architecture is depicted at the core of Figure 4 and is composed of a set of Managers, described in the remainder of this section. Their role is to convert the abstract specifications of layers and services defined in the configu-ration file into concrete environment resources (e.g., physical machines of a computing cluster) with the respective services deployed. They also enforce the configuration dependencies of the underlying services, defined by experimenters in the workflowconfiguration file.
E2Clab sits on top of EnOSlib [27], a library which brings reusable building blocks for configuring the infrastructure, provisioning software on remote hosts as well as organizing the experimental workflow. Interaction with the testbeds is deferred to EnOSlib’s provider and various actions on remote hosts also rely on mechanisms offered by the library (e.g monitoring stack). For illustration purposes, we deployed the Smart Surveillance use-case with E2Clab on Grid’5000 [10], a large-scale distributed testbed for experiment-driven research in France. E2Clab current version supports Grid’5000, how-ever, thanks to EnOSlib, E2Clab can be extended to support
Fig. 4: The E2Clab framework.
different environments such as Chameleon [28], Vagrant [29], among others.
B. Experiment Manager
The Experiment Manager coordinates the execution of the whole experiment and the information exchange between all Managers. It receives as input all the configuration files provided by the users (layers and services, network, and work-flow) and assigns them to the respective Managers to setup the experimental environment and execute the experiments. At the end of each experiment, the Experiment Manager provides the results to the users.
Table II presents the structure for the configuration files and a brief description of each of their attributes. These configura-tion files follow the YAML format [30]. In order to manage the experiment execution logic (i.e., interconnections, life cycle, execution parameters, execution order, etc.) on remote nodes, the workflow configuration file follows Ansible’s playbook language [31]. Each configuration file has an important role to enable the 3R’s as they abstract the underlying infrastructure in a rigorous way, allowing other researchers to easily reproduce, replicate or repeat the experiments.
E2Clab relies on EnOSlib tasks to divide the experiment deployment into smaller steps, according to the sequence presented in Table II. Through a command line like ”e2clab [layers-services, network, or workflow]” one may separately deploy the scenario. The workflow deployment step can also be divided as ”e2clab workflow scenario dir [prepare, launch, or finalize]”. Furthermore, one may also easily automate the
TABLE II: E2Clab Configuration Files Attributes Description Lay ers & Ser vices environment name site cluster
Refers to the environment to run the experi-ments on, such as Grid’5000, for example. layers
- name
Define the hierarchy between services and group them in different granularities. services - name quantity repeat roles env
Define service-specific configurations, such as the environment variables, the monitoring, the number of nodes required to deploy the service, and the service repeatability.
Netw ork networks - default loss default delay default rate - src dst delay rate loss
Define a default network configuration (manda-tory) and additionally custom network configu-rations (optional) between the layers defined in the infrastructure file. For each network, users may vary parameters such as delay, rate, and loss.
W
orkflo
w
- hosts
Refers to remote nodes to deploy the experiment artifacts (libraries, applications, among others) and to enforce the experiment workflow. depends on
conf selector grouping prefix
Groups applications and services to intercon-nect them and to obtain application’s and servi-ce’s metadata (such as IP address, port number, address to remote services, among others).
prepare launch finalize
Refers to three phases of the workflow manage-ment. Each one consists of tasks to be applied on remote nodes such as 1) prepare: copy files to remote nodes (libraries, dataset, softwares, etc.); 2) launch:execute commands on them (such as starting multiple applications with specific para-meters and resource constraints); 3) finalize: back-up data generated during execution of experiments.
whole deployment and repeat the experiment N times by just issuing the following command ”e2clab deploy scenario dir artifacts dir –repeat 2 –lifecycle 240”.
C. Layers and Services Manager
This Manager interprets the layers and services configu-ration file and starts the deployment phase by reserving the physical resources on the environment, installing, configuring, and launching all the services defined by the user. It uses EnOSlib Dstat service to monitor nodes resource usage.
Considering the Smart Surveillance use case, Listing 1 pro-vides an excerpt of a configuration file where the user defined the environment as Grid’5000. Besides, the user emulated atop Grid’5000 a Cloud layer with two services.
The first service consists in an Apache Flink [14] cluster composed of one Job Manager and two Task Managers, resulting in three physical machines reserved on Grid’5000 (quantity : 3). Additionally, the user set the cluster in the monitoring role (i.e., to monitor the computing resources of all Flink’s Job and Task Managers during the execution of experiments) and defined some service-specific configurations such as the Flink Job Manager heap size, the parallelism, and the number of tasks slots for the Flink Task Managers. If one needs to deploy two (or more) distinct Flink clusters with the same configuration on the Cloud side, it can be done by simply adding the attribute (repeat : 2) within the Flink service. This allows users to easily and transparently scale the scenarios
environment
name: grid5000, site: rennes, cluster: paravance
layers
- name: Cloud
services
- name: Flink, quantity: 3, roles: [monitoring]
env:
FLINK_PROPERTIES:
"jobmanager.heap.size: 8000m \n parallelism.default: 16 \n
taskmanager.numberOfTaskSlots: 32" - name: Kafka, quantity: 3, roles: [monitoring]
env:
KAFKA_ZOOKEEPER_CONNECTION_TIMEOUT_MS: "30000"
KAFKA_BATCH_SIZE: "200000"
Listing 1: Layers and Services configuration example.
networks:
- def_delay:"2ms", def_rate:"10gbit", def_loss:0.1 - src: cloud, dst: fog
delay: "50ms", rate: "1gbit", loss: 2 - src: fog, dst: edge
delay: "50ms", rate: "150mbit", loss: 5
Listing 2: Network configuration example.
by adding layers and to easily vary them by replicating the services.
The second service consists in an Apache Kafka [11] cluster composed of one Kafka leader with a ZooKeeper [32] and two Kafka followers (quantity : 3). The Kafka cluster is monitored and configured with a connection timeout for the ZooKeeper server and a batch size.
In the current implementation, the Flink and Kafka services are Docker containers, with images obtained by default from the Docker Hub [33]. Hence, users can set their custom images by using the image attribute and specifying the image identi-fier in the Docker Hub (e.g., image : ”home/f link − 1.8.0” for Flink). This may be done for other services as well (e.g., image : ”home/myproducer” for producers).
Leveraging containerization and virtualization enables re-producibility in E2Clab: everything required to run the service efficiently and bug-free (i.e., configuration files, libraries, dependencies, datasets etc.) can be packed, made publicly available and reused.
D. Network Manager
This Manager defines the communication rules between the physical machines, as specified by users. It receives the layers and services and the network configuration files from the Experiment Manager and collects information resulted from the deployment. It uses EnOSlib Netem service to configure the whole network and once this is done, it generates a file report for users to check and validate the network parameters. The Smart Surveillance use-case defines three distinct net-works, as shown in Listing 2. The first one is the default network configuration that is applied to all physical machines. The second one refers to the network connection between the Cloud and Fog layers; it is defined with a delay of 50ms, a rate of 1Gbit, and a packet loss of 2%. The last one refers to the connection between the Edge and Fog layers, configured with a delay, rate, and loss of 50ms, 150Mbit, and 5%, respectively.
- hosts: edge.producer.* depends_on: conf_selector: "fog.gateway.*" grouping: "round_robin" prefix: "gateway" prepare: - copy: src: "applications/dataset/" dest: "/dataset/" launch: - shell:
"cctv-producer -target /dataset/data-{{item}} tcp://{{gateway.url}} /metrics-{{item}}"
loop: "{{ range(1, 41)|list }}"
finalize: - fetch:
src: "/metrics-{{item}}/throughput"
dest: "{{working_dir}}/results/producers/"
loop: "{{ range(1, 41)|list }}"
Listing 3: Producer configuration example.
As one may note, we use the concept of layers to easily enforce the communication capabilities between machines. Those network configurations can be varied in a fine-grained or coarse-grained way, according to the layers definition. Such abstraction of the network configuration complexity from end users enables the E2Clab replicability and reproducibility. E. Workflow Manager
This Manager interprets the workflow configuration file and deploys and runs the components of each service (e.g., data producers, gateways, processing engine job, etc.), enforcing their dependencies (if any). It uses the EnOSlib Tasks API that leverages Ansible for many routine tasks handling.
Considering the Smart Surveillance use-case and the ex-ample in Listing 3, we present how E2Clab avoids burden-ing the users of doburden-ing the exact mappburden-ing between layers (Edge and Fog) and services (producers and gateways), at the workflow level. Through the depends on attribute, users can easily achieve this mapping (e.g. provide to producers the gateway URL, gateway.url), as well as to transparently scale it by using logical names like edge.producer.∗ and f og.gateway.∗. The same attribute allows users to trans-parently interconnect producers and gateways (e.g. in round-robin) by using grouping : ”round robin”. In this example, we configure and interconnect the producers (i.e., 160 cameras, as 40 Java processes per machine) to send data to their respective gateways, with minor effort and complexity.
Once the mapping is defined, users can then manage the deployment of their applications in three well defined steps: prepare, launch, and finalize. According to Listing 3, in the prepare step, we are copying the image dataset used by producers from the local to the remote machines; then, in launch we are starting the 160 producers; and lastly, in finalizewe are collecting the throughput file generated by each producer during the execution of the experiments.
We highlight that, the Workflow Manager collects all data generated during the execution of the experiments, such as physical machine monitoring, files generated by user applica-tions such as log files, files containing performance metrics data, etc. In order to be able to collect these data, users must
define the data to be collected at the end of the experiments in the workflow configuration file. Researchers must provide all the data collected by the Manager in a public and safe repository, for replicability and reproducibility purposes.
V. EVALUATION
In this section we show how E2Clab can be used to analyze the performance of the Smart Surveillance application in order to find a representative setup in a Computing Continuum environment. The goals of these experiments are:
• to understand the impact on performance of Cloud-centric and Hybrid (Fog+Cloud) processing;
• to analyze the resource consumption of gateways, data ingestion (Kafka) clusters and processing (Flink) clusters. The experiments are carried out on the Grid’5000 testbed (clusters econome [34], gros [35], and grisou [36]). The Nancy grisou cluster, using 35 physical machines equipped with Intel Xeon E5-2630 v3 processors (Haswell, 2.40GHz, 2 CPUs/node, 8 cores/CPU), 128GB of memory, 600 GB HDD, and four 10Gbps Ethernet interfaces.
A. Experimental Setup
1) Scenario configuration: In the Smart Surveillance ap-plication, cameras deployed on the Edge send video frames to gateways in the Fog, which, depending on the application configuration, may pre-process the data before sending them to the Cloud (cf. Section II-B).
There are two application configurations under investiga-tion: Cloud-centric and Hybrid. In the Cloud-centric config-uration, Fog gateways are passive, i.e., they only forward data from cameras to the Cloud, where the by-region and all-cameraprocessing take place. The by-region processing is the detection (using OpenCV [37]) and the counting of people, and the selection of the video frame with the most people in a time window of 5 seconds. The all-camera processing is the calculation of the video-frame with the most people from all cameras in a time window of 20 seconds. In the Hybrid configuration, Fog gateways are active, i.e., they perform the by-region processing and send pre-processed data to the Cloud, onto which the all-camera processing is performed.
Data processing is enabled by Apache Edgent on Fog active gateways. On the Cloud, data are ingested by Kafka and ZooKeeper clusters and processed by a Flink cluster.
2) Workloads: For both processing approaches, we defined three categories of workloads (summarized in Table III), rep-resentative for applications with a varying number of sensors or data producers: Small, Medium and Large. Each workload differs from the others in the number of cameras (40, 160, and 640), gateways (1, 4, and 16), and number of physical machines required to deploy them (5, 11, and 35), respectively. The experimental scenarios use videos from the University of California San Diego dataset [38]. For all workloads, each camera is configured to send in average 100 images per second, resulting in a streaming rate of around 2.5MB/s.
TABLE III: Workloads Characterization
Scenario Cameras Gateways Grid’5000 Nodes Small 40 1 5
Medium 160 4 11 Large 640 16 35
TABLE IV: Services Configuration and Parameters
Service Parameter Value Flink Cluster
- Job Manager (JM) - Task Manager (TM)
JM heap size
TM number of task slots job window size job parallelism 8GB 32 20s 32 Kafka Cluster - ZooKeeper Server - Kafka Leader topic partitions topic replication factor batch size linger 32 1 200KB 50ms Edgent Gateways - Passive Gateway (PG) - Active Gateway (AG)
MQTT QoS (at most once) AG window size
AG period of data emission 0 5s 100ms Cameras
period of data emission MQTT QoS (at most once) JVM minimum heap size JVM maximum heap size
10ms 0 256MB 1GB
TABLE V: Network Configurations
Edge-to-Fog (E-F) Fog-to-Cloud (F-C) Network Rate Delay (ms) Loss (%) Rate Delay (ms) Loss (%) A 22Mb 100 5 1Gb 5 2 B 1Gb 5 2 1Gb 5 2 C 1Gb 5 2 22Mb 100 5 D 10Gb 2 0.1 10Gb 2 0.1
3) Configuration parameters: Table IV presents in detail the parameters used to configure all the services, such as cameras, Edgent gateways, Kafka and Flink clusters. In a nutshell, cameras send 100 images per second to gateways; active gateways (with a window size of 5 seconds) send processed data with an average frequency of 20 units per second; the Kafka input topic (with 32 partitions) receives those data, the Flink Task Manager consumes it (using a window of 20 seconds) and processes it on 32 task slots; lastly, Flink sends the aggregate count to the Kafka’s output topic.
The network configurations between the Edge and the Fog (E-F) and between the Fog and the Cloud (F-C) layers, re-spectively, are presented in Table V. We defined four network profiles, each one with a different rate, delay, and loss. They correspond to common real-life scenarios. For instance, most IoT applications fall in profile A, with an average sensor connectivity through 3G at the Edge and a good network connectivity towards the Cloud. In some remote areas, the sensor connectivity can be good, however the network towards the cloud relies on 3G antennas (profile C).
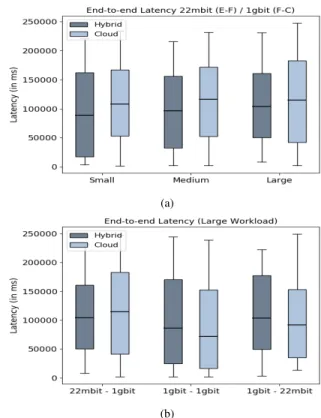
4) Performance metrics: The metrics of interest in the Surveillance application are the end-to-end latency and the processing throughput of active and passive gateways. The end-to-end latency refers to the time required for messages to travel from cameras, through gateways, to be ingested by Kafka and processed by Flink and finally sent back to the Kafka output topic. The second metric refers to the amount of messages per second each gateway is able to process. Besides
(a)
(b)
Fig. 5: End-to-end latency for: (a) different workloads, and (b) different E-F / F-C interconnects.
those performance metrics, we also analyzed the processor and memory consumptionof gateways, Kafka and Flink clusters. B. Impact of the Network on the End-to-End Latency
In order to analyze the impact of the network on the end-to-end latency we defined two sets of experiments. In the first one, we fixed the network with the configuration A (22Mb E-F and 1Gb E-F-C) and varied the workloads (Small, Medium, Large). In the second one, we fixed the workload (Large) and varied between the network configurations (A, B, and C).
We highlight that, despite that we are analyzing the infras-tructure in terms of network performance, E2Clab can emulate CPU, I/O or memory-intensive applications and therefore ana-lyze the infrastructure considering other performance metrics. Furthermore, since the current version of E2Clab supports Docker containers, one may easily emulate embedded systems with less powerful resources by setting runtime configurations to constrained containers’ resources such as CPU, GPU, and memory [39]. Container orchestration tools (such as Kuber-netes [40]) could also be used in E2Clab to orchestrate the resource usage of multiple containers on physical machines.
Figure 5(a) shows a general increase of the end-to-end latency when the workloads are scaled up. A straightforward observation is that, when comparing the latency between the Cloud-centric and Hybrid processing, the former incurs higher latency since all data is sent to the Cloud, which takes time especially for large datasets (as shown in Section V-D). More importantly, we notice that the Fog processing is not able keep the pace with the increased workloads.
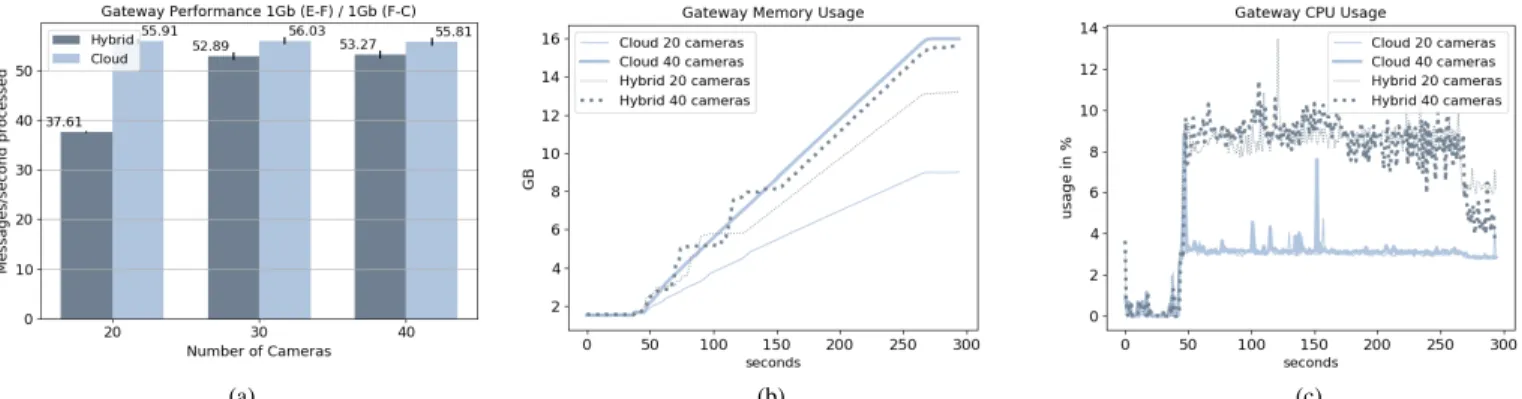
(a) (b) (c)
Fig. 6: Gateway processing throughput and resource consumption for varying workload pressure (i.e., cameras per gateway). To assess whether this is due to the bandwidth, in
Fig-ure 5(b) we study its impact on the end-to-end latency by varying the A, B, and C network profiles. In the first case, the Hybrid configuration has lower latency, while, in the last two cases, the behaviour is similar, with a slightly lower latency in the Cloud-centric configuration. Its noteworthy that the lower latency results were obtained with a 1Gb link on both sides. Clearly, the Fog bottlenck is not due to the bandwidth, so we further investigate it in the next section.
C. Investigating Bottlenecks at the Fog Gateway Level We zoom our analysis on the Fog infrastructure in order to identify possible bottlenecks on passive and active gateways. The experiment aims to understand how gateways, in both Cloud-centric and Hybrid configurations, react to changes in the workload, by scaling from 20, 30 to 40 cameras per gateway. For this experiment, we consider the network configuration B (1Gb link between the Edge and Fog).
Figure 6(a) shows the messages per second processed by the gateways: more messages are sent by the passive gateways than by the active ones, even when we increase the workload. This happens because the active Edgent gateways aggregate messages in a 5s window and perform image processing. Secondly, we observe that scaling from 20 to 40 cameras per gateway does not result in an increase of messages processed per second by passive gateways and only in a slight increase for active gateways. This is likely due to the poor parallelism support in Edgent, also highlighted by other studies [22].
This observation is confirmed by the continuous memory increase shown in Figure 6(b). The passive gateways with 20 cameras consumed the lowest memory, about 9GB, followed by the active ones, which consumed 45% more (around 13GB). When we used 40 cameras, both passive and active gate-ways consumed around 16GB. Regarding CPU usage, active gateways consumed twice as much compared to the passive ones, independently of the workload, varying most of the time between 8 to 10%. The image processing performed on active gateways explains this higher consumption and variation. D. Impact of Hybrid Processing on Resource Consumption
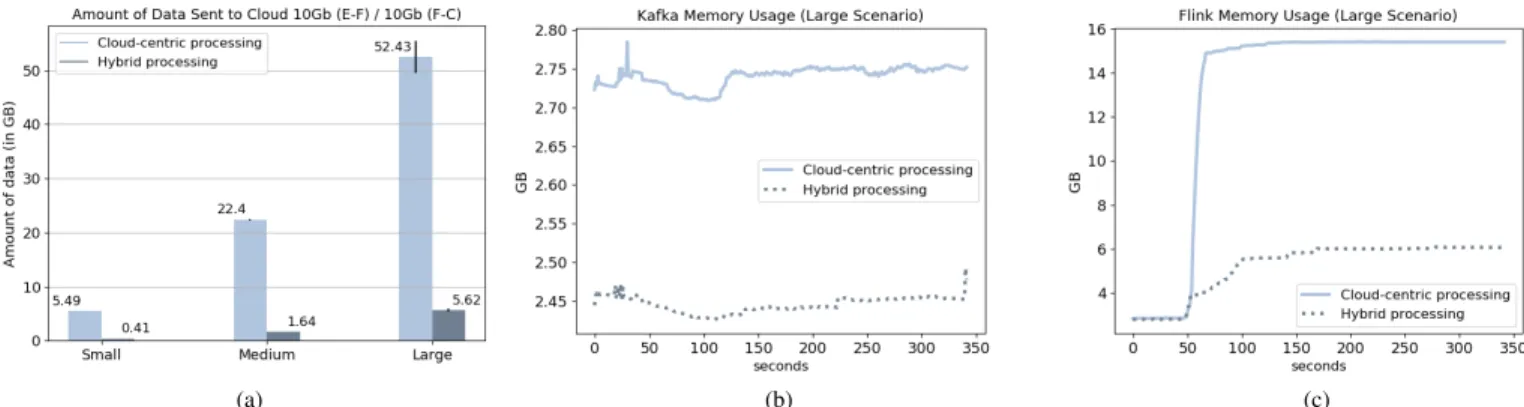
Finally, we compared the Cloud-centric and Hybrid pro-cessing approaches with respect to the amount of data sent to
the Cloud and the consumed resources. Figure 7(a) shows the amount of data sent to the Cloud by each gateway (passive and active respectively) when we scale up the workloads with network D. Since this data is sent to the Cloud to be processed, we also analyzed the memory consumption in the Kafka and Flink clusters, in Figures 7(b) and (c).
Not surprisingly, the Hybrid processing approach sends less data to the Cloud compared to the Cloud-centric configuration (Figure 7(a)). This occurs since active gateways aggregate and process video data on the Fog, resulting in less data being sent to the Cloud. What is noteworthy is the difference between them when we scale the scenarios from Small, to Medium and Large, representing 5.08GB, 20.76GB and 46.81GB, respec-tively. Especially for large workloads, processing these data volumes in the Fog can translate into faster results and reduced resource costs.
Supporting this observation, Figures 7(b) and (c) show that Kafka and Flink consume less memory in the Hybrid approach. In particular, Kafka uses 2.44GB for Hybrid pro-cessing against 2.74GB in the Cloud-centric case, while Flink uses 6GB for Hybrid processing against 15.5GB for the Cloud-based. This higher difference for Flink is explained by the fact that all the processing is done on the Cloud.
E2Clab enabled two important take-aways about Cloud and Hybrid processing in this scenario:
1) bandwidth has an important influence on the time to results, however its impact can be offset by controlling the workload sizeand by improving the Edge/Fog gateways support for parallelism; 2) while in many cases the Edge/Fog processing cannot
bring significant performance benefits, it can reduce the incurred costs (i.e., the transmissions costs and the Cloud resources costs).
VI. DISCUSSION
Besides revealing the hidden traoffs of application de-ployments through 3R’s experiments, E2Clab exhibits a series of features that make it a promising base for future benchmarks on the E2C Continuum. We briefly discuss them here.
(a) (b) (c)
Fig. 7: Resource consumption in Hybrid and Cloud scenarios: (a) data transferred, (b) Kafka memory and (c) Flink memory. A. Experiment Variation and Transparent Scaling
The layers and services abstraction in E2Clab allows ex-perimenters to easily vary and scale their scenarios. The con-figuration files (presented in Table II) use a simple semantic that enhances the variation of the experiment parameters (e.g., application-specific parameters, network constraints, etc.) in order to analyze it in different perspectives. Furthermore, users can transparently scale their experiments by adding multiple layersand defining a variety of services to be placed on them. Their mapping is achieved with minor changes in the layers and services configuration file and no impact in the network and workflow files.
B. Usability and Open Science
E2Clab targets usability by abstracting all the low-level details of the definition and configuration of the experimental environment. It avoids the burden of mapping layers and services to users, since it provides a high-level abstraction that allows performing this mapping through logical names and pattern matching. Besides, the configuration files were designed to be easy to use and understand.
Finally, our methodology and its implementation are aligned with the Open Science goal to make scientific research acces-sible. The E2Clab framework provides guidelines to system-atically define the whole experimental environment through well structured configuration files and it provides at the end of each experiment an archive of the generated data. All the experiment artifacts and results of this paper may be found in our repository [41].
VII. RELATEDWORK
With the growth in popularity of the IoT, Edge-based processing has been a very active field of research in the last few years. Most of the works on instrumenting applications on the Edge and the Fog come from the benchmarking area.
The Transaction Processing Performance Council (TPC) [42] proposed the TPCx-IoT [43], a benchmark for IoT gateway systems, which defines a set of scripts and tools for processing large workloads based on real IoT industry applications. TPCx-IoT does not offer, however, any means
for configuring the infrastructure or replacing the tested frame-works. It also focuses on the Edge and Fog layers, not taking the Cloud into consideration. On the other hand, works such as CloudCmp [44] and NCSbench [45] focus on the part of the application deployed on the Cloud and fail on providing configuration control of application parameters on Fog or Edge. Benchmark platforms that consider the entire Computing Continuum such as Swan [46], DeFog [47] or EdgeBench [48] enable Edge to Cloud applications, how-ever their main objective is to collect metrics on hardware and workloads of pre-defined applications, and lack support for defining and configuring the infrastructure (e.g., network connections, virtual machines, deployment). That support is essential for performing 3R’s experiments.
VIII. CONCLUSIONS ANDFUTUREWORK
E2Clab is, to the best of our knowledge, the first platform to support the complete analysis cycle of an application on the Computing Continuum. It provides two simple abstractions for modeling such applications and infrastructures: layers and services. While these abstractions are limited, we have found that they are powerful enough to express several applications deployed on different environments, ranging from the Edge to the Cloud. Furthermore, we believe that the core idea behind E2Clab, of a methodology to enable the design of relevant testebeds for 3R’s experiments, may prove useful for understanding the performance of large-scale applications.
In future work, we plan to focus on three areas: (1) develop other, finer grained abstractions to model the components of the services and allow researchers to trade between different costs with increased accuracy; (2) enable built-in support for other large-scale experimental testbeds, besides Grid’5000, such as Vagrant and Chameleon (note that, currently, users can adapt E2Clab to their testbed of convenience by means of EnOSlib); and (3) develop a benchmark for processing frameworks within the Computing Continuum atop E2Clab.
ACKNOWLEDGMENTS
This work was funded by Inria through the HPC-BigData Inria Challenge (IPL) and by French ANR OverFlow project (ANR-15- CE25-0003).
REFERENCES
[1] Z. Mahmood, Fog Computing: Concepts, Frameworks and Technologies. Springer, 2018.
[2] M. Asch, T. Moore, R. Badia, M. Beck, P. Beckman, T. Bidot, F. Bodin, F. Cappello, A. Choudhary, B. de Supinski et al., “Big data and extreme-scale computing: Pathways to convergence - toward a shaping strategy for a future software and data ecosystem for scientific inquiry,” The International Journal of High Performance Computing Applications, vol. 32, no. 4, pp. 435–479, 2018.
[3] ETP4HPC Strategic Research Agenda. [Online]. Available: https://www.etp4hpc.eu/sra.html
[4] Apache Edgent. [Online]. Available: http://edgent.incubator.apache.org/ [5] M. Zaharia, M. Chowdhury, M. J. Franklin, S. Shenker, and I. Stoica, “Spark: Cluster Computing with Working Sets,” in Proceedings of the 2Nd USENIX Conference on Hot Topics in Cloud Computing, ser. HotCloud’10. Berkeley, CA, USA: USENIX Association, 2010, pp. 10–10.
[6] S. Sadiq, M. Orlowska, W. Sadiq, and C. Foulger, “Data Flow and Vali-dation in Workflow Modelling,” in Proceedings of the 15th Australasian database conference-Volume 27, 2004, pp. 207–214.
[7] D. P. Abreu, K. Velasquez, M. Curado, and E. Monteiro, “A Comparative Analysis of Simulators for the Cloud to Fog Continuum,” Simulation Modelling Practice and Theory, p. 102029, 2019.
[8] S. Svorobej, P. Takako Endo, M. Bendechache, C. Filelis-Papadopoulos, K. M. Giannoutakis, G. A. Gravvanis, D. Tzovaras, J. Byrne, and T. Lynn, “Simulating Fog and Edge Computing Scenarios: An Overview and Research Challenges,” Future Internet, vol. 11, no. 3, p. 55, 2019. [9] Open Science. [Online]. Available:
https://ec.europa.eu/research/openscience
[10] R. Bolze, F. Cappello, E. Caron, M. Dayde, F. Desprez, E. Jeannot, Y. J´egou, S. Lanteri, J. Leduc, N. Melab, G. Mornet, R. Namyst, P. Primet, B. Qu´etier, O. Richard, E.-G. Talbi, and I. Touche, “Grid’5000: A Large Scale And Highly Reconfigurable Experimental Grid Testbed,” International Journal of High Performance Computing Applications, vol. 20, no. 4, pp. 481–494, 2006. [Online]. Available: https://hal.inria.fr/hal-00684943
[11] Apache Kafka. [Online]. Available: https://kafka.apache.org/ [12] Apache Pulsar. [Online]. Available: https://pulsar.apache.org/ [13] ZeroMQ. [Online]. Available: https://zeromq.org/
[14] P. Carbone, S. Ewen, S. Haridi, A. Katsifodimos, V. Markl, and K. Tzoumas, “Apache Flink: Stream and Batch Processing in a Single Engine,” Bulletin of the IEEE Computer Society Technical Committee on Data Engineering, vol. 38, no. 4, pp. 1–11, 12 2015.
[15] Apache Storm. [Online]. Available: http://storm.apache.org/
[16] Fog Computing and the Internet of Things: Extend the Cloud to Where the Things Are. [Online]. Available: https://www.cisco.com/c/dam/en us/solutions/trends/iot/docs/computing-overview.pdf
[17] Apache Nifi. [Online]. Available: https://nifi.apache.org/
[18] GSMA - IoT Edge Computing Requirements. [Online]. Available: https://www.gsma.com/iot/resources/iot-edge-computing-requirements/ [19] M. Iorga, L. Feldman, R. Barton, M. J. Martin, N. S. Goren, and
C. Mahmoudi, “Fog Computing Conceptual Model,” Tech. Rep., 2018. [20] Eclipse Mosquitto. [Online]. Available: https://mosquitto.org/ [21] MQTT. [Online]. Available: http://mqtt.org/
[22] P. Silva, A. Costan, and G. Antoniu, “Investigating Edge vs. Cloud Computing Trade-offs for Stream Processing,” in IEEE International Conference on Big Data in 2019, 2019, pp. 469–474.
[23] L. A. Barba and G. K. Thiruvathukal, “Reproducible Research for Computing in Science Engineering,” Computing in Science Engineering, vol. 19, no. 6, pp. 85–87, 2017.
[24] V. Stodden and S. Miguez, “Best Practices for Computational Science: Software Infrastructure and Environments for Reproducible and Exten-sible Research,” Available at SSRN 2322276, 2013.
[25] N. Ferro and D. Kelly, “SIGIR Initiative to Implement ACM Artifact Review and Badging,” in ACM SIGIR Forum, vol. 52, no. 1. ACM New York, NY, USA, 2018, pp. 4–10.
[26] Welcome to E2Clab’s documentation! [Online]. Available: https://kerdata.gitlabpages.inria.fr/Kerdata-Codes/e2clab/
[27] R.-A. Cherrueau, M. Simonin, and A. Van Kempen, “EnosStack: A LAMP-like Stack for the Experimenter,” in IEEE INFOCOM 2018-IEEE Conference on Computer Communications Workshops (INFOCOM WKSHPS). IEEE, 2018, pp. 336–341.
[28] K. Keahey, P. Riteau, D. Stanzione, T. Cockerill, J. Mambretti, P. Rad, and P. Ruth, “Chameleon: A Scalable Production Testbed for Computer Science Research,” in Contemporary High Performance Computing. CRC Press, 2019, pp. 123–148.
[29] Vagrant. [Online]. Available: https://www.vagrantup.com [30] YAML. [Online]. Available: https://yaml.org/
[31] Ansible Documentation. [Online]. Available: https://docs.ansible.com/ansible/latest/index.html
[32] Apache Zookeeper. [Online]. Available: https://zookeeper.apache.org/ [33] Docker Hub. [Online]. Available: https://hub.docker.com/
[34] Nantes Hardware: econome cluster details. [Online]. Available: https://www.grid5000.fr/w/Nantes:Hardware#econome
[35] Nancy Hardware: gros cluster details. [Online]. Available: https://www.grid5000.fr/w/Nancy:Hardware#gros
[36] Nancy Hardware: grisou cluster details. [Online]. Available: https://www.grid5000.fr/w/Nancy:Hardware#grisou
[37] OpenCV. [Online]. Available: https://opencv.org/
[38] A. B. Chan and N. Vasconcelos, “Modeling, Clustering, and Segmenting Video with Mixtures of Dynamic Textures,” IEEE transactions on pattern analysis and machine intelligence, vol. 30, no. 5, pp. 909–926, 2008.
[39] Runtime options with Memory, CPUs, and GPUs. [Online]. Available: https://docs.docker.com/config/containers/resource constraints/ [40] What is Kubernetes? [Online]. Available:
https://kubernetes.io/docs/concepts/overview/what-is-kubernetes/ [41] E2Clab: experiment artifacts and results. [Online]. Available:
https://gitlab.inria.fr/Kerdata/Kerdata-Codes/e2clab-examples
[42] Transaction Processing Performance Council. [Online]. Available: http://www.tpc.org
[43] TPCx-IoT, a Benchmark for IoT Gateway Systems. [Online]. Avail-able: http://www.tpc.org/tpc documents current versions/pdf/tpcx-iot v1.0.5.pdf
[44] A. Li, X. Yang, S. Kandula, and M. Zhang, “CloudCmp: Comparing Public Cloud Providers,” in Proceedings of the 10th ACM SIGCOMM Conference on Internet Measurement, ser. IMC ’10. Association for Computing Machinery, 2010, p. 1–14.
[45] S. Zoppi, O. Ayan, F. Molinari, Z. Music, S. Gallenm¨uller, G. Carle, and W. Kellerer, “NCSbench: Reproducible Benchmarking Platform for Networked Control Systems,” in 2020 IEEE 17th Annual Consumer Communications Networking Conference (CCNC), 2020, pp. 1–9. [46] R. Bharath Das, A. van Halteren, and H. Bal, “SWAN-Fly : A Flexible
Cloud-enabled Framework for Context-aware Applications in Smart-phones,” in Sensors to Cloud Architectures Workshop (SCAW-2016). IEEE CS, 3 2016.
[47] J. McChesney, N. Wang, A. Tanwer, E. de Lara, and B. Varghese, “DeFog: Fog Computing Benchmarks,” CoRR, vol. abs/1907.10890, 2019. [Online]. Available: http://arxiv.org/abs/1907.10890
[48] A. Das, S. Patterson, and M. P. Wittie, “EdgeBench: Benchmarking Edge Computing Platforms,” CoRR, vol. abs/1811.05948, 2018. [Online]. Available: http://arxiv.org/abs/1811.05948