doi:10.1152/ajpheart.00796.2007
294:2736-2742, 2008. First published Apr 18, 2008; Am J Physiol Heart Circ Physiol
Vincent D'Orio
Philippe Kolh, Patrizio Lancellotti, Vincent Tchana-Sato, Thomas Desaive and
Philippe Morimont, Bernard Lambermont, Alexandre Ghuysen, Paul Gerard,
You might find this additional information useful...
27 articles, 17 of which you can access free at:
This article cites
http://ajpheart.physiology.org/cgi/content/full/294/6/H2736#BIBL
including high-resolution figures, can be found at:
Updated information and services
http://ajpheart.physiology.org/cgi/content/full/294/6/H2736
can be found at:
AJP - Heart and Circulatory Physiology
about
Additional material and information
http://www.the-aps.org/publications/ajpheart
This information is current as of September 4, 2009 .
http://www.the-aps.org/. ISSN: 0363-6135, ESSN: 1522-1539. Visit our website at
Physiological Society, 9650 Rockville Pike, Bethesda MD 20814-3991. Copyright © 2005 by the American Physiological Society. intact animal to the cellular, subcellular, and molecular levels. It is published 12 times a year (monthly) by the American
lymphatics, including experimental and theoretical studies of cardiovascular function at all levels of organization ranging from the publishes original investigations on the physiology of the heart, blood vessels, and AJP - Heart and Circulatory Physiology
on September 4, 2009
ajpheart.physiology.org
Effective arterial elastance as an index of pulmonary vascular load
Philippe Morimont,1Bernard Lambermont,1Alexandre Ghuysen,1Paul Gerard,2Philippe Kolh,1
Patrizio Lancellotti,3Vincent Tchana-Sato,1Thomas Desaive,1and Vincent D’Orio1
1Hemodynamics Research Laboratory (HemoLiege), University Hospital of Liege,2Statistics Institute, University of Liege,
and3Cardiology Department, University Hospital of Liege, Liege, Belgium Submitted 10 July 2007; accepted in final form 16 April 2008
Morimont P, Lambermont B, Ghuysen A, Gerard P, Kolh P, Lancellotti P, Tchana-Sato V, Desaive T, D’Orio V. Effective
ar-terial elastance as an index of pulmonary vascular load. Am J Physiol Heart Circ Physiol 294: H2736–H2742, 2008. First published April 18, 2008; doi:10.1152/ajpheart.00796.2007.—The aim of this study was to test whether the simple ratio of right ventricular (RV) end-systolic pressure (Pes) to stroke volume (SV), known as the effective arterial elastance (Ea), provides a valid assessment of pulmonary
arterial load in case of pulmonary embolism- or endotoxin-induced pulmonary hypertension. Ventricular pressure-volume (PV) data (ob-tained with conductance catheters) and invasive pulmonary arterial pressure and flow waveforms were simultaneously recorded in two groups of six pure Pietran pigs, submitted either to pulmonary embo-lism (group A) or endotoxic shock (group B). Measurements were obtained at baseline and each 30 min after injection of autologous blood clots (0.3 g/kg) in the superior vena cava in group A and after endotoxin infusion in group B. Two methods of calculation of pul-monary arterial load were compared. On one hand, Eaprovided by
using three-element windkessel model (WK) of the pulmonary arterial system [Ea(WK)] was referred to as standard computation. On the
other hand, similar to the systemic circulation, Eawas assessed as the
ratio of RV Pes to SV [Ea(PV)⫽ Pes/SV]. In both groups, although
the correlation between Ea(PV) and Ea(WK) was excellent over a
broad range of altered conditions, Ea(PV) systematically
overesti-mated Ea(WK). This offset disappeared when left atrial pressure (Pla)
was incorporated into Ea[Eaⴱ (PV) ⫽ (Pes ⫺ Pla)/SV]. Thus Eaⴱ
(PV), defined as the ratio of RV Pes minus Pla to SV, provides a convenient, useful, and simple method to assess the pulmonary arterial load and its impact on the RV function.
hemodynamics; pulmonary hypertension; right ventricle; ventriculo-arterial coupling
IN CURRENT CLINICALpractice, pulmonary arterial load [or right
ventricular (RV) afterload] is usually expressed as the mean pulmonary vascular resistance, computed as the ratio of the pressure drop through the pulmonary circulation [difference between mean pulmonary arterial pressure (PAPmean) and left atrial pressure (Pla)] to the mean pulmonary blood flow [car-diac output (CO)]. Such an evaluation ignores the pulsatile nature of both pressure and flow. Although oscillatory compo-nents of the pulmonary arterial load are low, and mean resis-tance may be a valuable index of the pulmonary vascular load, the pulsatile nature of the load may be prominent in numerous pathological situations. Wave reflections play an important role and should be taken into account in pulmonary hypertension resulting from several pathological conditions, like pulmonary embolism and septic shock (1, 2, 5, 14). In this way, the pulmonary arterial impedance spectrum, which is defined in
the frequency domain, provides a more precise and complete description of the pulmonary vascular load (12, 17). However, because of its complexity, this approach is difficult to use in clinical practice and to link with data obtained in the time domain. Sunagawa et al. introduced the concept of the effective arterial elastance (Ea), defined as a steady-state arterial param-eter that incorporates the principal elements of the windkessel model of the pulmonary vascular bed (24, 25). According to this concept, Ea is computed by combining the pulmonary vascular compliance, the characteristic impedance, and the resistance of the main pulmonary vessels, as well as the pulmonary peripheral resistance. An alternative method con-sists in assessing Ea by the steady-state ratio of end-systolic pressure to stroke volume (Pes/SV). This ratio can be simply obtained from steady-state ventricular pressure-volume (PV) measurements, while the pulmonary impedance spectrum or the windkessel parameters require simultaneous pulmonary arterial flow and pressure waveform acquisition. Moreover, the ratio of end-systolic ventricular elastance to Ea, obtained from PV relations, characterizes the ventriculo-arterial interaction. In the systemic circulation, both normal and hypertensive human subjects show good agreement between Ea computed using left ventricular PV loop and Ea calculated from wind-kessel model parameter value recorded in the aorta (10). In the pulmonary circulation, it remains unknown whether or not
Ea(PV) can be used as a substitute of Ea(WK) [WK denotes Ea derivation from windkessel model]. Therefore, the purpose of the present study was to assess the validity of Ea(PV) derived from steady-state RV PV data in experimental animals insulted with endotoxin or submitted to clot embolism.
METHODS
All experimental procedures and protocols used in this investiga-tion were reviewed and approved by the ethical committee of the Medical Faculty of the University of Liege and conformed to the Guide for the Care and Use of Laboratory Animals published by the US National Institutes of Health (NIH publication no. 85-23, revised 1996). Experiments were performed on two groups of six healthy pure Pietran pigs of either sex, weighing from 16 to 28 kg. The animals were premedicated with intramuscular administration of ketamine (20 mg/kg) and diazepam (1 mg/kg). Anesthesia was then induced and maintained by a continuous infusion of sufentanil (0.5g䡠kg⫺1䡠h⫺1) and pentobarbital (5 mg䡠kg⫺1䡠h⫺1). Spontaneous movements were prevented by pancuronium bromide (0.2 mg䡠kg⫺1䡠h⫺1). After endo-tracheal intubation via a cervical tracheostomy, the pigs were con-nected to a volume-cycled ventilator (Evita 2, Drager, Lubeck, Ger-many) set to deliver a tidal volume of 10 ml/kg at a respiratory rate of 20 breaths/min with an inspired O2 fraction of 0.4. End-tidal CO2 First published April 18, 2008; doi:10.1152/ajpheart.00796.2007.
on September 4, 2009
ajpheart.physiology.org
measurements (Capnomac, Datex, Helsinki, Finland) were used to monitor the adequacy of ventilation. Respiratory settings were ad-justed to maintain end-tidal CO2 between 30 and 35 Torr. The
pulmonary trunk was exposed via a median sternotomy. A microma-nometer-tipped catheter (Sentron pressure measuring catheter, Cordis, Miami, FL) was inserted into the main pulmonary artery through a stab wound in the RV outflow tract. A 14-mm-diameter perivascular flow-probe (Transonic Systems, Ithaca, NY) was placed around the main pulmonary artery 2 cm downstream from the pulmonary valve. The micromanometer-tipped catheter was manipulated so that the pressure sensor was finally positioned at the level of the flow probe. Pla was measured with a micromanometer-tipped catheter inserted into the cavity through the left atrial appendage. Systemic arterial blood pressure was monitored via a micromanometer-tipped catheter in-serted into the abdominal aorta through the left femoral artery. A 7-F, 12-electrode (8-mm interelectrode distance) conductance microma-nometer-tipped catheter (CD Leycom, Zoetermeer, the Netherlands) was inserted through the RV infundibulum into the RV and positioned so that all electrodes were in the RV cavity. A 6-F Fogarty balloon catheter (Baxter Healthcare, Oakland, CA) was advanced into the inferior vena cava through a right femoral venotomy. Inflation of this balloon produced a gradual preload reduction.
Experimental protocol. After surgical preparation, the animals were allowed to stabilize for 30 min. Baseline hemodynamic record-ing was performed, includrecord-ing PAPmean, pulmonary blood flow (Q˙ ),
Pla, mean arterial blood pressure, and heart rate (HR). In the first group (group A), autologous blood clots (0.3 g/kg) were injected in the superior vena cava immediately after baseline measurements. In the second group (group B), the animals had an intravenous infusion of 0.5 mg/kg of a freshly prepared endotoxin solution (lipopolysac-charide from E. coli serotype 0127:B8, Sigma, St. Louis, MO) over 30 min at time 0.
Data collection. All analog signals were continuously digitalized with an appropriate system (Codas, DataQ, Akron, OH). The pulmo-nary pressure and flow waves were sampled at 200 Hz and stored.
Cardiac cycles were defined by R-wave detection provided by a permanent recording of a one-lead electrocardiogram. Ten consecu-tive cycles were recorded during apnea and were numerically aver-aged to obtain representative diagrams of pressure and flow waves, corresponding to specific experimental conditions. Simultaneously, 10 consecutive RV PV loops were recorded. The same measurements were then repeated during transient occlusion of the inferior vena cava using the Fogarty balloon.
Data analysis. We used a lumped parameter model, i.e., the three-element windkessel model (WK3), to analyze the flow condi-tions in the pulmonary circulation throughout the experimental pro-tocol (Fig. 1). The 10 steady-state beats were analyzed under each condition (baseline, each 30 min after pulmonary embolism in group A or endotoxin infusion in group B), and the results were averaged. Maximal and minimal pulmonary arterial pressure defined systolic and diastolic pressures, respectively. Systolic ejection interval (ts) was
measured from the foot of the pulmonary arterial pressure wave to its incisura, and the diastolic interval was td⫽ T ⫺ ts, where T is the
cardiac length. Pairs of pressure and flow data for each beat were analyzed, and the three elements of the model were simultaneously calculated by using an original analytic procedure, as described previously (12).
RV PV loops were obtained using the conductance catheter method (3). Pes was the pressure at maximal ventricular elastance (Emax) for
a steady-state loop. Maximal RV elastance was determined as {P(t)/[V(t) ⫺ Vo]}max, where P(t) and V(t) are instantaneous RV
pressure and volume, respectively; and Vois the volume intercept
of the end-systolic PV relation obtained using the preload reduc-tion method (3).
Ea definitions. An expression of the effective Ea with the three
parameters of the WK3 is given by (12, 21, 24):
Ea共WK兲 ⫽ RT/关ts⫹ 共1 ⫺ e⫺td/兲兴 (1)
where RT is the total pulmonary vascular resistance, i.e., the sum of the characteristic resistance (R1) and the pulmonary arteriolar
resis-Fig. 1. Representation of the three-element wind-kessel model (WK) with an example of computer record used to obtain averaged pulmonary pressure (top) and flow (bottom) waveforms from 10 con-secutive systoles in a typical group A pig. R1,
characteristic vascular resistance; C, vascular com-pliance; R2, peripheral vascular resistance.
H2737 PULMONARY EFFECTIVE ARTERIAL ELASTANCE
AJP-Heart Circ Physiol•VOL 294 • JUNE 2008 •www.ajpheart.org
on September 4, 2009
ajpheart.physiology.org
tance (R2); and is the diastolic pressure decay time constant or the
product of R2 and the total capacitance (C), which represents the
compliant properties of the pulmonary arterial tree. The electrical representation of the WK3 is displayed in Fig. 1. The three elements of the model are calculated using an analytic procedure (12, 14). Details of this analysis are provided in theAPPENDIX.
Eq. 1 can be simplified as follows. If the is long compared with the td ( ⬎⬎ td), then the denominator reduces to ts ⫹ td ⫽ T, the
cardiac cycle length. Thus
Ea共WK兲 ⬇ RT/T (2)
However,
RT⫽ 共PAPmean⫺ Pla兲/CO (3)
Therefore,
Ea共WK兲 ⬇ 共PAPmean⫺ Pla兲/共CO䡠T兲
⫽ 共PAPmean⫺ Pla兲/共SV䡠HR䡠T兲 ⫽ 共PAPmean⫺ Pla兲/SV
(4) If PAPmeanis further approximated by RV Pes, then
Ea共WK兲 ⬇ 共PAPmean⫺ Pla兲/SV ⬇ 共Pes ⫺ Pla兲/SV ⫽ Ea* 共PV兲 (5)
If the downstream pressure can be neglected as in the systemic circulation, then
Ea共WK兲 ⬇ Pes/SV ⫽ Ea共PV兲 (6)
Statistical analysis. For each group, we performed a linear regres-sion between Ea(WK) and Ea(PV), and we completed the analysis
with a Bland-Altman test (Statistica version 7, StatSoft). Changes in hemodynamics and WK3 parameters were evaluated by a repeated-measures analysis of variance (Statistica version 7, StatSoft). Data are expressed as means⫾ SE.
RESULTS
Windkessel parameters and PV loop effects of arterial load variations. The effects of induced pulmonary hypertension in
both groups on HR, CO, mean arterial pressure, PAPmean, Pla, and right atrial pressure are shown in Table 1. In group A, pulmonary embolism was responsible for several alterations in the shape of pressure and flow waves, including early pressure inflection, late systolic peak pressure, and sharper pulmonary arterial flow waveform (Fig. 1). The corresponding PV loops became oblong due to a rise in ejection pressure (Fig. 2, left). In group B, administration of endotoxin induced a bulging of PV loops (Fig. 2, right). These modifications were related to both reduced arterial compliance and enhanced wave reflec-tions. Clot embolism and infusion of endotoxin lead to signif-icant changes in the windkessel parameters, as shown in Fig. 3. In group A (Fig. 3, left), R1 did not change significantly; however, there was a rapid rise in R2 and a fall in C after pulmonary embolism. In group B (Fig. 3, right), both R1and R2significantly increased following endotoxin insult, whereas C progressively decreased after endotoxin insult.
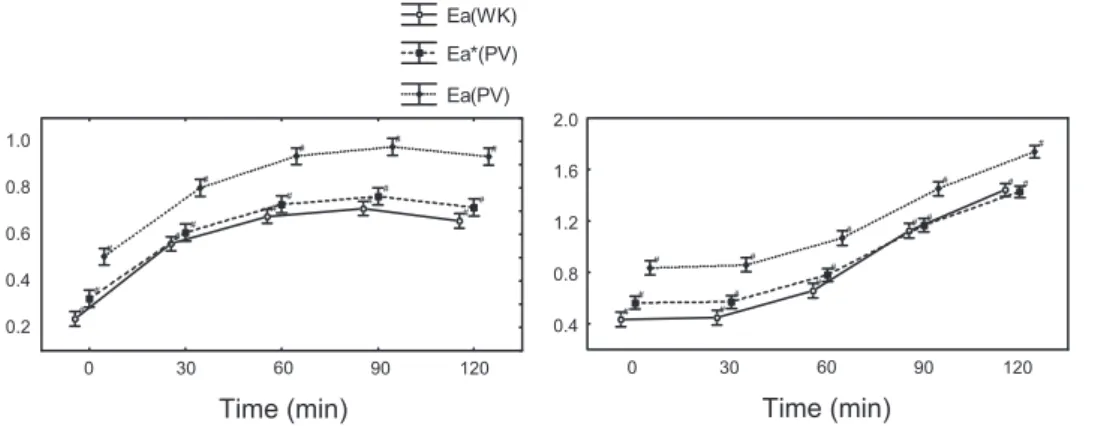
Ea(PV) compared with Ea(WK). The time course of both
Ea(PV) and Ea(WK) in each group is shown in Fig. 4. In group
A, Ea(PV) and Ea(WK) increased rapidly after the first vena cava injection of embols. In group B, both parameters progres-sively increased after endotoxin infusion. In each group, the pulmonary Eacalculated with the complex method [Ea(WK)] and the simple method [Ea(PV)] displayed a parallel evolution. Despite the varying vascular properties due to either pulmo-nary embolism or endotoxin infusion, the ratio of ventricular Pes to SV [Pes/SV ⫽ Ea(PV)] was remarkably similar to
Ea(WK) derived from the windkessel parameters using Eq. 1. However, Ea(PV) was somewhat higher than Ea(WK). The offset between Ea(PV) and Ea(WK) was significantly reduced by using Eaⴱ (PV) instead of Ea(PV) (Fig. 4). Indeed, incor-porating Pla into Ea(PV), the mean difference between both methods decreased from 0.24⫾ 0.07 to 0.11 ⫾ 0.08 mmHg/ml (means⫾ SD) in group A and from 0.29 ⫾ 0.11 to 0.08 ⫾ 0.1 mmHg/ml (means⫾ SD) in group B (Fig. 5).
The linear relations were nearly identical in both groups and given by Eaⴱ (PV) ⫽ 0.92 Ea(WK)⫹ 0.1 [r2⫽ 0.96, n ⫽ 56, SE of estimate (SEE) ⫽ 0.1, P ⬍ 0.0001] in group A, and
Eaⴱ (PV) ⫽ 0.88 Ea(WK)⫹ 0.19 (r2⫽ 0.97, n ⫽ 56, SEE ⫽ 0.21, P⬍ 0.0001) in group B (Fig. 5). The limits of agreement indicated that the differences between both methods did not exceed 0.08 mmHg/ml in group A and 0.11 mmHg/ml in group
B for 95% of the cases (Fig. 5).
Ea(PV) and RT/T. As for the relation between Ea(PV) and
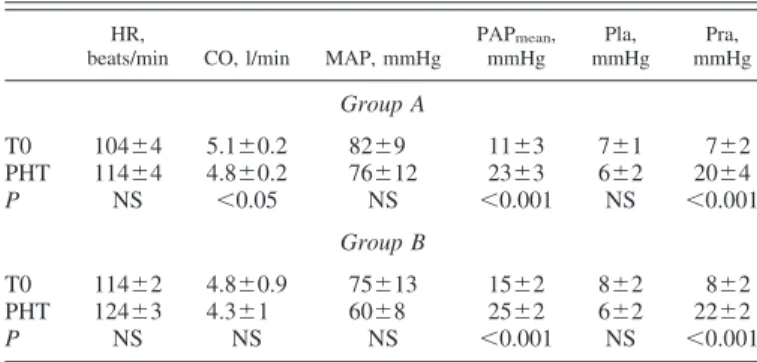
Ea(WK), there was a strong linear correlation between Ea(PV) Table 1. Effects of induced pulmonary hypertension on heart
rate, cardiac output, systemic and pulmonary arterial pressures, and left and right atrial pressures
HR,
beats/min CO, l/min MAP, mmHg
PAPmean, mmHg Pla, mmHg Pra, mmHg Group A T0 104⫾4 5.1⫾0.2 82⫾9 11⫾3 7⫾1 7⫾2 PHT 114⫾4 4.8⫾0.2 76⫾12 23⫾3 6⫾2 20⫾4 P NS ⬍0.05 NS ⬍0.001 NS ⬍0.001 Group B T0 114⫾2 4.8⫾0.9 75⫾13 15⫾2 8⫾2 8⫾2 PHT 124⫾3 4.3⫾1 60⫾8 25⫾2 6⫾2 22⫾2 P NS NS NS ⬍0.001 NS ⬍0.001
Values are means⫾ SE. T0, baseline conditions; PHT, pulmonary hyper-tension; HR, heart rate; CO, cardiac output; MAP, mean arterial pressure; PAPmean, mean pulmonary arterial pressure; Pla, left atrial pressure; Pra, right
atrial pressure; NS, not significant.
Fig. 2. Example of right ventricular (RV) pres-sure-volume (PV) loops in a group A pig (left) before (thick lines) and after (thin lines) pulmo-nary embolism, and in a group B pig (right) before (thick lines) and after (thin lines) endo-toxin infusion. Lines representing Ea⫽ (Pes ⫺
on September 4, 2009
ajpheart.physiology.org
and RT/T: Ea(PV)⫽ 1.1䡠RT/T ⫹ 0.27 (r2⫽ 0.96, P ⬍ 0.0001,
n⫽ 58, SEE ⫽ 0.032) in group A, and Ea(PV)⫽ 0.98䡠RT/T ⫹ 0.36 (r2⫽ 0.97, P ⬍ 0.0001, n ⫽ 56, SEE ⫽ 0.059) in group
B. The bias was still reduced using Ea ⴱ (PV) instead of
Ea(PV): Ea ⴱ (PV) ⫽ 1.04䡠RT/T ⫹ 0.11 (r2 ⫽ 0.93, P ⬍ 0.0001, n⫽ 58, SEE ⫽ 0.038) in group A, and Eaⴱ (PV) ⫽ 0.95䡠RT/T ⫹ 0.23 (r2⫽ 0.96, P ⬍ 0.0001, n ⫽ 56, SEE ⫽ 0.051) in group B. The low SEE obtained in each group corresponded to a good agreement between both parameters (Fig. 6).
DISCUSSION
In the present study, we tested whether or not pulmonary vascular load could be assessed by the effective Eadetermined by the simple ratio of Pes to SV [Ea(PV)]. Our results demon-strated that there was an excellent correlation between Ea(WK) calculated from the windkessel model and Ea calculated as
Pes/SV over a wide range of loading conditions resulting from either pulmonary embolism or endotoxin insult. However, the effective Ea determined by the simple ratio of Pes to SV consistently exceeded the elastance calculated from the wind-kessel parameters. The offset between Ea(PV) and Ea(WK) nearly vanished using Ea ⴱ (PV), which incorporates Pla, instead of Ea(PV). This observation implies that, contrary to what is observed in the systemic circulation, the effect of the downstream pressure on the pulmonary circulation is not neg-ligible. Sagawa et al. suggested incorporating the presence of an effective downstream pressure into Ea (21). Nevertheless, Pla is frequently ignored in the pulmonary circulation, and Ea is calculated as the ratio of Pes to SV similarly to the systemic circulation (4, 9, 18, 28).
The linear relations between Ea ⴱ (PV) and Ea(WK) were nearly identical in both groups. These results are concordant with those of Kelly et al. (10) in the systemic circulation, who Fig. 3. Time course of WK parameters (R1,
R2, C) in groups A (left) and B (right). *P⬍
0.05 compared with baseline.
Fig. 4. Time course of Ea(WK), Ea ⴱ (PV),
and Ea(PV) in groups A (left) and B (right).
#P⬍ 0.05 compared with baseline. H2739 PULMONARY EFFECTIVE ARTERIAL ELASTANCE
AJP-Heart Circ Physiol•VOL 294 • JUNE 2008 •www.ajpheart.org
on September 4, 2009
ajpheart.physiology.org
showed that Ea(PV) provides a useful method to assess arterial load and its interaction with the human ventricle. These authors suggested that Ea(PV) is a powerful tool to assess the effects of increased pulsatile load caused by aging or hypertension on PV loops. They also pointed out that mean arterial resistance often underestimates the real effects of the load on cardiac perfor-mance (10). Segers et al. (23) found that Ea(PV) underesti-mated Ea(WK) provided by the four-element windkessel model.
Our results demonstrated that Eaⴱ (PV) can be used in place of Ea(WK) in the pulmonary circulation. The correlation be-tween Eaⴱ (PV) and Ea(WK) was excellent in normal condi-tions, as well as after pulmonary embolism or endotoxin infusion, as shown by the Bland-Altman test in both groups. In
group A, Ea showed an asymptotic increase early after the pulmonary embolism, in concordance with an acute loss of compliance and a rapid rise of the total resistance offered by the pulmonary vascular tree. In group B, Ea progressively increased with an exponential trend associated with a progres-sive decrease in compliance and a slow rise in the total resistance of the pulmonary vasculature. Although experimen-tal conditions were toexperimen-tally different, the linear correlations between both methods in each group were nearly similar.
Our data showed that pulmonary embolism or endotoxin insult led to a complex pulmonary vascular response involving a dynamic, time-dependent interplay between R1, C, and R2.
Nevertheless, the correlation between both methods in each group remained excellent over the range of important varia-tions in the windkessel parameters.
The ratio of Emax on Ea (Emax/Ea) is superior to one in the normal heart, suggesting that the ventricle operates close to the optimal efficiency. Our laboratory previously showed that, in heart failure due to pulmonary embolism and sepsis, the decreased value of Emax/Eawas related to an impaired use of energy by the failing heart (6, 13, 15). In combination with
Emax, Ea(PV) appears to be a simple way to characterize ventriculo-arterial interaction (18, 26, 27). For the systemic circulation, Segers et al. (23) suggested that Eacan be approx-imated by RT/T only for high C values. For the pulmonary circulation, our results evidenced significant correlation be-tween both methods, as well as bebe-tween Eaⴱ (PV) and RT/T, despite dramatic changes in pulmonary vascular compliance. Our laboratory previously showed a concordant evolution be-tween Emax/Ea and stroke work in pulmonary embolism or septic shock (6, 13, 15). This could be explained by higher basal pulmonary vascular compliance compared with the val-ues obtained on the systemic circuit.
The determination of Eaas the simple ratio of Pes minus Pla to SV to assess pulmonary vascular load is rapidly and easily feasible in clinical settings. In contrast, Ea(WK) requires inva-sive measurement of pulmonary flow and pressure waves, which limits its potential use (8, 19).
Fig. 5. Top: correlation between Eaⴱ (PV) and Ea(WK): Ea ⴱ (PV) ⫽ 0.92 Ea(WK) ⫹ 0.1
[r2⫽ 0.96, n ⫽ 56, SE of estimate (SEE) ⫽
0.1, P⬍ 0.0001] in group A (left), and Eaⴱ
(PV)⫽ 0.88 Ea(WK)⫹ 0.19 (r2⫽ 0.97, n ⫽
56, SEE ⫽ 0.21, P ⬍ 0.0001) in group B (right). Bottom: Bland-Altman test compares
Eaⴱ (PV) and Ea(WK) in groups A (left) and B (right). The solid line is the mean
ence; the dashed lines represent mean differ-ence⫾2 SD.
Fig. 6. Correlation between Eaⴱ (PV) and
total pulmonary vascular resistance (RT)/ cardiac length (T) is given by the following linear relations: Eaⴱ (PV) ⫽ 1.04䡠RT/T ⫹ 0.11 (r2⫽ 0.93, P ⬍ 0.0001, n ⫽ 58, SEE ⫽ ⴱ (PV) ⫽ on September 4, 2009 ajpheart.physiology.org Downloaded from
RV tolerance and adaptation to chronic or acute increase in pulmonary vascular load may be a cornerstone in the prognosis of patients suffering from pulmonary hypertension. Therefore, evaluation of RV-pulmonary arterial coupling by using the ratio of contractility, assessed by the slope of the end-systolic PV relationship, to Easeems essential to evaluate correctly the facilitation of energy transfer from the RV into the pulmonary circuit (11). However, determination of Emaxrequires preload variation that is difficult to apply in clinical practice. It is the reason why single-beat methods have been developed, but unfortunately not yet validated for the RV. Therefore, further studies should be encouraged (16, 22). As pathophysiological RV conditions are often associated with valve insufficiencies, SV was derived from pulmonary arterial flow divided by HR. Some study limitations should be acknowledged. Ea(WK) and Ea ⴱ (PV) were related through two assumptions (Eqs.
2– 6). Diastolic time constant ( ⫽ R2䡠C) is long relative to the
diastolic time period (td), and Pes is approximately equal to PAPmean. Compared with the systemic vasculature, lower pul-monary vasculature resistance is counterbalanced by higher pulmonary vascular compliance in such a way that the first assumption can be considered as valid in basal conditions. In pulmonary hypertension, rise in R2prevails on loss in C, so the first assumption holds. Because of lower pulmonary arterial pressure levels, discrepancy between Pes and PAPmeanis more important than in the systemic vascular tree. However, in pulmo-nary hypertension, due to higher pulmopulmo-nary arterial pressure levels and enhanced wave reflections occurring during systole, PAPmeantends to be nearer to Pes.
In summary, several recent studies highlighted the impor-tance of abnormal pulsatile load effect in the mechanism of right heart failure (1, 2, 7, 20). Several methods to assess pulmonary vascular load have been proposed, but require a complete acquisition of pulmonary arterial pressure and flow waveforms. As a result, such methods are difficult to apply in current clinical practice. In the present study, we suggest that pulmonary arterial load can be simply assessed from the ratio of RV Pes minus Pla to RV SV in the setting of pulmonary hypertension. The downstream pressure plays an important role in the pulmonary circulation and should be incorporated into the pulmonary effective Ea.
APPENDIX: CALCULATION OF WK3 PARAMETERS
The relationship between pressure and flow in the electrical repre-sentation of WK3 is described by the following equation:
P共t兲 ⫹ R2C
dP共t兲
dt ⫽ 共R1⫹ R2兲Q˙共t兲 ⫹ R1R2C dQ˙共t兲
dt (A1)
where Q˙ is pulmonary flow; P is pulmonary arterial pressure; and t0is
the beginning of the cardiac cycle, defined as the R wave on the ECG. R1, R2, and C are the three elements of the WK3 (Fig. 1). Eq. A1 is
integrated and becomes:
兰
t0 t Q共兲d ⫽ k1兰
t0 t P共兲d ⫹ k2共P共t兲 ⫺ P共t0兲兲 ⫹ k3共Q˙共t兲 ⫺ Q共t0兲兲 (A2) where k1⫽ 1 R1⫹ R2 , k2⫽ CR2 R1⫹ R2 , and k3⫽ ⫺ CR2 R1⫹ R2 (A3) The multiple-regression technique estimates the constants kitomin-imize the residual sum of squares (RSS), i.e., the sum of squared differences between the observed values of both parts of this equation RSS⫽
兺
t冋
兰
t0 t Q˙共兲d共兲⫺k1兰
t0 t P共兲d ⫺k2关P共t兲⫺P共t0兲兴⫺k3关Q˙共t兲⫺Q˙共t0兲兴册
2 (A4)R1, R2, and C values are then derived by solving Eq. A3. GRANTS
This work was supported by a grant from the Leon Fredericq Foundation of the University of Liege (Belgium).
REFERENCES
1. Castelain V, Herve P, Lecarpentier Y, Duroux P, Simonneau G, Chemla D. Pulmonary artery pulse pressure and wave reflection in chronic pulmonary thromboembolism and primary pulmonary hyperten-sion. J Am Coll Cardiol 37: 1085–1092, 2001.
2. Chemla D, Castelain V, Simonneau G, Lecarpentier Y, Herve P. Pulse wave reflection in pulmonary hypertension. J Am Coll Cardiol 39: 743– 744, 2002.
3. Dickstein ML, Yano O, Spotnitz HM, Burkhoff D. Assessment of right ventricular contractile state with the conductance catheter technique in the pig. Cardiovasc Res 29: 820 – 826, 1995.
4. Fourie PR, Coetzee AR, Bolliger CT. Pulmonary artery compliance: its role in right ventricular-arterial coupling. Cardiovasc Res 26: 839 – 844, 1992.
5. Furuno Y, Nagamoto Y, Fujita M, Kaku T, Sakurai S, Kuroiwa A. Reflection as a cause of mid-systolic deceleration of pulmonary flow wave in dogs with acute pulmonary hypertension: comparison of pulmonary artery constriction with pulmonary embolisation. Cardiovasc Res 25: 118 –124, 1991.
6. Ghuysen A, Lambermont B, Dogne JM, Kolh P, Tchana-Sato V, Morimont P, Magis D, Hanson J, Segers P, D’Orio V. Effect of BM-573 {N-terbutyl-N⬘-[2-(4⬘-methylphenylamino)-5-nitro-benzenesulfonyl]urea}, a dual thromboxane synthase inhibitor and thromboxane receptor antagonist, in a porcine model of acute pulmonary embolism. J Pharmacol Exp Ther 310: 964 –972, 2004.
7. Grant BJ, Lieber BB. Clinical significance of pulmonary arterial input impedance. Eur Respir J 9: 2196 –2199, 1996.
8. Huez S, Brimioulle S, Naeije R, Vachiery JL. Feasibility of routine pulmonary arterial impedance measurements in pulmonary hypertension.
Chest 125: 2121–2128, 2004.
9. Kass A, Kelly RP. Ventriculo-arterial coupling: concepts, assumptions, and applications. Ann Biomed Eng 20: 41– 62, 1992.
10. Kelly RP, Ting CT, Yang TM, Liu CP, Maughan WL, Chang MS, Kass DA. Effective arterial elastance as index of arterial vascular load in humans. Circulation 86: 513–521, 1992.
11. Lambermont B, D’Orio V. The role of right ventricular-pulmonary arterial coupling to differentiate between effects of inotropic agents in experimental right heart failure. Crit Care Med 34: 2864 –2865, 2006. 12. Lambermont B, D’Orio V, Gerard P, Kolh P, Detry O, Marcelle R.
Time domain method to identify simultaneously parameters of the wind-kessel model applied to the pulmonary circulation. Arch Physiol Biochem 106: 245–252, 1998.
13. Lambermont B, Ghuysen A, Kolh P, Tchana-Sato V, Segers P, Gerard P, Morimont P, Magis D, Dogne JM, Masereel B, D’Orio V. Effects of endotoxic shock on right ventricular systolic function and mechanical efficiency. Cardiovasc Res 59: 412– 418, 2003.
14. Lambermont B, Kolh P, Detry O, Gerard P, Marcelle R, D’Orio V. Analysis of endotoxin effects on the intact pulmonary circulation.
Car-diovasc Res 41: 275–281, 1999.
15. Lambermont B, Kolh P, Dogne JM, Ghuysen A, Tchana-Sato V, Morimont P, Benoit P, Gerard P, Masereel B, Limet R, D’Orio V. Effects of U-46619 on pulmonary hemodynamics before and after admin-istration of BM-573, a novel thromboxane A2 inhibitor. Arch Physiol
Biochem 111: 217–223, 2003.
16. Lambermont B, Segers P, Ghuysen A, Tchana-Sato V, Morimont P, Dogne JM, Kolh P, Gerard P, D’Orio V. Comparison between single-H2741 PULMONARY EFFECTIVE ARTERIAL ELASTANCE
AJP-Heart Circ Physiol•VOL 294 • JUNE 2008 •www.ajpheart.org
on September 4, 2009
ajpheart.physiology.org
beat and multiple-beat methods for estimation of right ventricular con-tractility. Crit Care Med 32: 1886 –1890, 2004.
17. Lankhaar JW, Westerhof N, Faes TJ, Marques KM, Marcus JT, Postmus PE, Vonk-Noordegraaf A. Quantification of right ventricular afterload in patients with and without pulmonary hypertension. Am J
Physiol Heart Circ Physiol 291: H1731–H1737, 2006.
18. Missant C, Rex S, Segers P, Wouters PF. Levosimendan improves right ventriculovascular coupling in a porcine model of right ventricular dys-function. Crit Care Med 35: 707–715, 2007.
19. Muthurangu V, Atkinson D, Sermesant M, Miquel ME, Hegde S, Johnson R, Andriantsimiavona R, Taylor AM, Baker E, Tulloh R, Hill D, Razavi RS. Measurement of total pulmonary arterial compliance using invasive pressure monitoring and MR flow quantification during MR-guided cardiac catheterization. Am J Physiol Heart Circ Physiol 289: H1301–H1306, 2005.
20. Naeije R. Pulmonary vascular resistance. A meaningless variable?
Inten-sive Care Med 29: 526 –529, 2003.
21. Sagawa K, Maughan L, Hiroyugi S, Sunagawa K. Cardiac Contraction
and the Pressure-Volume Relationship. New York: Oxford University
Press, 1988, p. 238 –240.
22. Schenk S, Popovic ZB, Ochiai Y, Casas F, McCarthy PM, Starling RC, Kopcak MW Jr, Dessoffy R, Navia JL, Greenberg NL, Thomas JD, Fukamachi K. Preload-adjusted right ventricular maximal power:
concept and validation. Am J Physiol Heart Circ Physiol 287: H1632– H1640, 2004.
23. Segers P, Stergiopulos N, Westerhof N. Relation of effective arterial elastance to arterial system properties. Am J Physiol Heart Circ Physiol 282: H1041–H1046, 2002.
24. Sunagawa K, Maughan WL, Burkhoff D, Sagawa K. Left ventricular interaction with arterial load studied in isolated canine ventricle. Am J
Physiol Heart Circ Physiol 245: H773–H780, 1983.
25. Sunagawa K, Maughan WL, Sagawa K. Optimal arterial resistance for the maximal stroke work studied in isolated canine left ventricle. Circ Res 56: 586 –595, 1985.
26. Sunagawa K, Sugimachi M, Todaka K, Kobota T, Hayashida K, Itaya R, Chishaki A, Takeshita A. Optimal coupling of the left ventricle with the arterial system. Basic Res Cardiol 88, Suppl 2: 75–90, 1993. 27. Takaoka H, Takeuchi M, Odake M, Hayashi Y, Mori M, Hata K,
Yokoyama M. Comparison of the effects on arterial-ventricular coupling between phosphodiesterase inhibitor and dobutamine in the diseases hu-man heart. J Am Coll Cardiol 22: 598 – 606, 1993.
28. Wauthy P, Pagnamenta A, Vassalli F, Naeije R, Brimioulle S. Right ventricular adaptation to pulmonary hypertension: an interspecies comparison. Am J Physiol Heart Circ Physiol 286: H1441–H1447, 2004.
on September 4, 2009
ajpheart.physiology.org

![Fig. 5. Top: correlation between E a ⴱ (PV) and E a (WK): E a ⴱ (PV) ⫽ 0.92 E a (WK) ⫹ 0.1 [r 2 ⫽ 0.96, n ⫽ 56, SE of estimate (SEE) ⫽ 0.1, P ⬍ 0.0001] in group A (left), and E a ⴱ (PV) ⫽ 0.88 E a (WK) ⫹ 0.19 (r 2 ⫽ 0.97, n ⫽ 56, SEE ⫽ 0.21, P ⬍ 0.0001) in](https://thumb-eu.123doks.com/thumbv2/123doknet/6862297.192096/6.904.311.836.122.454/fig-correlation-ⴱ-pv-wk-estimate-group-left.webp)
