EUR 22160 EN - 2007
Geographical Information in support of the
Common Agricultural Policy
Proceedings
of the 12th MARS PAC Annual Conference, 2006
The Institute for the Protection and Security of the Citizen provides researchbased,
systems-oriented support to EU policies so as to protect the citizen against economic and technological
risk. The Institute maintains and develops its expertise and networks in information,
communication, space and engineering technologies in support of its mission. The strong
crossfertilisation between its nuclear and non-nuclear activities strengthens the expertise it can
bring to the benefit of customers in both domains.
European Commission
Joint Research Centre
Institute for the Protection and Security of the Citizen
Contact information
Address: Joint Research Centre, IPSC-AGRICULTURE, TP 266, I-21020 Ispra (VA), Italy
E-mail: simon.kay@jrc.it
Tel.: +39 0332 78 9702
Fax: +39 0332 78 5162
http://ipsc.jrc.ec.europa.eu
http://www.jrc.ec.europa.eu
Legal Notice
Neither the European Commission nor any person acting on behalf of the Commission is
responsible for the use which might be made of this publication.
A great deal of additional information on the European Union is available on the Internet.
It can be accessed through the Europa server
http://europa.eu/
MARS Ref : JRC IPSC/G03/P/SKA/asi D(2007)(8503)
PUBSY JRC 40462
EUR 22160 EN
Luxembourg: Office for Official Publications of the European Communities
© European Communities, 2007
Reproduction is authorised provided the source is acknowledged
Printed in Italy
Geographical Information in support of the
Common Agricultural Policy
Proceedings of the 12
thMARS PAC Annual Conference, 2006
Edited by: Simon Kay, Aleksandra Sima, Philippe Loudjani
Contents:
Conference Abstract ... 3
Acknowledgements ... 3
Peer review process and committee ... 5
Session 2: New services relying on agricultural graphical data... 7
A. Gobin, L. Brodsky, B. Tychon, E. Andersen, P. Campling, J. Van Orshoven:
PROTECTION AND MAINTENANCE OF PERMANENT PASTURES... 7
S. Oszczak, A. Ciecko:
PROPOSED PROCEDURE OF VALIDATION AND CERTIFICATION OF GNSS INSTRUMENTS AND
OBSERVERS... 13
S. Gacichevic, O. Mihailescu:
CONTROL WITH REMOTE SENSING CAMPAIGN ROMANIA 2007 ... 17
Session 3: Benchmarking of satellites and airborne instruments, trials and studies ... 21
V. Vassilev, S. Popova, A. Garnier, M. Mangolini, T. Westin, P. Åstrand, P. Milenov:
ORTHORECTIFIED FORMOSAT-2 DATA PERFORMANCE IN THE CWRS CAMPAIGN 2006 AND FUTURE
APPLICATIONS ... 21
E. Ingebos, C. Bouguin, I. Muquet:
IMPACT DE L’UTILISATION D’IMAGES DMC EN PIAO TESTS SUR 2 ZONES DE CONTROLES 2006 EN
FRANCE ... 25
D. Kristóf, D. Neidert:
MONITORING OF AGRICULTURAL PRACTICE BY JOINT ANALYSIS OF VHR IMAGES AND MODIS TIME
SERIES... 29
V. Vassilev, P. Milenov, R. Radkov, S. Popova, K. Stefanov:
CREATION OF DIGITAL ORTHOIMAGE MAP ON THE BASE OF VHR SATELLITE IMAGES FOR THE
BULGARIAN LPIS ... 35
Session 4: IACS: sharing data online ... 41
P. Milenov, S. Kay:
STATUS OF THE IMPLEMENTATION OF LPIS IN THE EU MEMBER STATES... 41
J. Garinet:
IACS NEW GENERATION ARCHITECTURES... 49
R. Araújo, L. Nascimento, R. Roquette, A. Campos:
iSIP – LPIS ON-LINE... 53
A. Petitjean, E. de Laroche:
L’UTILISATION DES DONNÉES GÉOGRAPHIQUES EN FRANCE POUR LE SIGC, 2007 ... 57
Conference Abstract
The 2006 Annual Conference, jointly organised between the MARS PAC action of the Joint Research Centre in
ISPRA and the new Agence Unique de Paiement, (AUP) of the French Ministry of Agriculture and Fisheries,
covered not only the Control with Remote sensing Activities but also technical aspects of Land Parcel
Identification Systems (LPIS or APIS) and ortho-imagery use in all the CAP management and control
procedures. The conference was the 12
thorganised by MARS PAC to review this important and still growing
area of technical activity, in support of the Common Agricultural Policy implementation.
The program was structured into 2 days of plenary sessions (Monday 27
thand Wednesday 29
thNovember) and
one day (Tuesday 28
thNovember) with parallel sessions, including a restricted session for national and regional
administrations. Around 340 persons from over 30 countries attended.
The presentations were made available on line within some days of the conference, and this publication
represents the best presentations judged worthy of inclusion in a conference proceedings aimed at recording
the state of the art of technology and practice of that time.
Acknowledgements
The editors of this publication, as well as all team members of the MARS PAC action, would like to express
sincere thanks to the Agence Unique de Paiement, of the French Ministry of Agriculture, for both material and
logistical support in the organisation and hosting of this successful and popular meeting. Many persons from the
French administration were involved, without whom the conference could not even have taken place, but we
would like to specifically thank Bruno Hot, Emmanuel de Laroche and Alain Petitjean for their deep involvement.
We would also like to thank the presenters for agreeing to submit their work as papers, as well as to the review
committee for contributing their valuable time at the meeting to identifying those most suitable for publication.
Peer review process and committee
Each of the past 11 years MARS PAC has produced a "proceedings" of presentations made at the annual
conference: in 2006 however, it was decided to go one step better and to produce a restricted set of papers,
selected by a peer review committee during the conference. Moreover, it seemed worthwhile to start making a
more ambitious historical record of the information presented, with a real proceedings that collects the more
interesting scientific and technical work undertaken by the stakeholder community represented at the
conference.
It was decided, therefore, to try and encourage better quality presentations by:
i)
reviewing the proposed abstracts carefully, to a shortlist of 28 presentation slots
ii)
selecting the best twelve with the possibility of including a conference-style paper in a special JRC
publication
To achieve credibility on this publication, a peer-review committee was assembled, mostly external to the JRC.
Prof Francis Sévila, Dean of ENSAT (Toulouse) was invited to lead the committee through the abstract and
presentation stage. This committee members organised themselves to attend the technical sessions of the
conference, and decided upon the short list of presentations for publication.
The proceedings here are a result of that shortlist, and the conference organisers and the editors are grateful to
the assistance provided in reviewing the presentations in the short time frame available.
The Peer Review committee members were:
• Prof Francis Sévila, École Nationale Supérieure Agronomique de Toulouse, FR
sevila@ensat.fr
• Marc Bernard, Spot Image, FR
marc.bernard@spotimage.fr
• Prof Stanislaw Białousz, Warsaw University of Technology, PL
s.bialousz@gik.pw.edu.pl
• Chrystel Fermond, Agence Unique de Paiement, FR
c.fermond@onigc.fr
• Olivier Léo, Joint Research Centre, EC
olivier.leo@jrc.it
Session 2: New services relying on agricultural graphical data
PROTECTION AND MAINTENANCE OF PERMANENT PASTURES
B. Gobin1, L. Brodsky², B. Tychon³, E. Andersen4, P. Campling1, J. Van Orshoven1 1
Spatial Applications Division Leuven (SADL), K.U.Leuven R&D, Celestijnenlaan 200 E
3001 Leuven, Belgium;
http://www.sadl.kuleuven.be
²GISAT s.r.o., Charkovska 7, 101 00 Praha 10, Czech Republic;
http://www.gisat.cz
³ Université de Liège, Campus d'Arlon, Avenue de Longwy, 185, B-6700 Arlon;
http://www.dsge.ulg.ac.be/arlon/
4
Danish Centre for Forest, Landscape and Planning, KVL; Rolighedsvej 23, 1958 Frederiksberg C, Denmark;
http://www.kvl.dk
KEY WORDS: permanent pastures, GAEC, monitoring, control, spatio-temporal analysis
ABSTRACT:
All farmers receiving direct payments are subject to compulsory cross-compliance which includes standards related to the maintenance and protection of permanent pastures. Questionnaire techniques and spatio-temporal analyses demonstrated that the ratio of permanent pasture area to agricultural land provides a simple tool for monitoring and controlling the protection of permanent pastures at the regional to Member State level. Huge variations in the ratio across Europe were related to the importance of permanent pastures, the interpretation of definitions, sources of information used, differences in calculation, and the presence of protective and/or sensitive zones. Precautionary or complementary measures are in place in most Member States in order to prevent decreases in the ratio. The implementation of GAEC standards related to permanent pastures overlaps with the standard management requirements, national legislation and current agri-environmental programmes. The study advocates the establishment of a comprehensive geo-information platform consisting of a topologically correct inventory of all permanent pasture parcels in a 1:1 geo-referenced relation between IACS and LPIS; ancillary spatially explicit data such as orthophotos, remote sensing images and other thematic databases; and, geo-databases with parcel information compiled for other monitoring purposes such as those within the framework of the Nitrates Directive or 2nd pillar support.
1. INTRODUCTION
The overall extent of permanent pastures in Europe has been estimated to be approximately 55 million hectares, with a decline of around 17% in EU-15 during 1975 - 2001 mainly due to afforestation, intensive farming methods, abandonment and urbanisation (Soldi et al., 2004). However, in many parts of the EU the trend has been stabilised in recent years and an increase in permanent pastures can even be observed in some regions.
Since the beginning of 2005, all farmers receiving direct payments have been subject to compulsory cross-compliance (Council Regulation No 1782/2003 and Commission Regulation No 796/2004), following the principle that farmers should comply with environmental protection requirements as a condition for benefiting from financial support. Beneficiaries of direct payments are obliged to keep land in good agricultural and environmental condition. The so-called GAEC standards are defined by Member States, and include standards related to the protection and maintenance of permanent pastures. In addition, Member States ensure that there is no significant decrease in their ratio of permanent pasture area to agricultural land, if necessary by prohibiting the conversion of permanent pastures to arable land.
Figure 1. Regional distribution of the ratio permanent pasture to utilised agricultural area in 2000 and ratio change from
1990-2000 for EU-15
Proceedings of the 12th MARS PAC Annual Conference, 2006
Geographical Information in support of the CAP
8
The study objectives were:
1. to analyse the strategies defined by Member States for monitoring and controlling the protection and maintenance of permanent pastures;
2. to assess the technical and administrative issues to gather information on the ratio between the area under permanent pastures and total agricultural land; and, 3. to provide recommendations on ways to improve the existing systems to monitor the evolution of permanent pastures and the implementation and control obligations for individual farmers.
Detailed examples are drawn from Denmark, the Czech Republic, Belgium (Flanders and Wallonia).
2. METHODS 2.1. Eliciting strategies
The strategies for monitoring and controlling the protection and maintenance of permanent pastures were elicited using a questionnaire sent to the different national or regional administrations across Europe. Eighteen Member States responded. National statistical data, IACS data and Farm Structure Survey (Eurostat) data were compared for the Member States that responded.
2.2. Spatio-temporal analysis
Spatio-temporal analysis using ArcGIS (ESRI™) was carried out on detailed farm land use data from IACS/LPIS databases and ancillary geographic data from the administrations of Denmark, the Czech Republic, Flanders (Belgium) and Wallonia (Belgium).
3. RESULTS 3.1. Overview of strategies
All Member States regard the maintenance and protection of permanent pastures as socially and environmentally beneficial. The reported benefits include diversified landscapes, nature conservation, soil conservation, maintenance of biodiversity, carbon sequestration, lower agro-chemical inputs, agricultural extensification and preservation of cultural heritage. Farm abandonment and farm intensification are the two main pressures identified that can threaten the maintenance and preservation of permanent pastures.
The implementation of GAEC standards related to permanent pastures overlaps with statutory management requirements (e.g. Fauna Flora & Habitats Directives, Nitrate Directive), national legislation and current agri-environmental programmes. In some Member States, a high percentage of farmers receiving direct payments also take part in the agri-environmental programme (e.g. Austria with 95% participation).
The ratio of permanent pasture area to total agricultural land provides a simple tool for monitoring and controlling the protection of permanent pastures at regional or Member State level. Numerical variations in the ratio of permanent pasture areas to agricultural land depend on a number of factors such as the importance of permanent pasture, interpretation of definitions, sources of information used (IACS-LPIS, national statistics, Eurostat statistics), time of reporting between the different data sources and differences in the calculation of the ratio. In most Member States the area of permanent pastures according to statistical data is larger than the declared area of
permanent pastures according to the IACS data (the legal reference for the ration calculation).
0 10 20 30 40 50 60 70 80 90 100 Ire lan d Slo ven ia Lu xem bou rg Au stri a the Net h erlan ds Wal lon ia ( B ) Po rtu g al Fra nce Ger man y Slo vak R epu blic Es ton ia Fla n der s (B ) L atv ia Sp ain Cze ch Re pub lic Po lan d Lit huan ia Ital y Den mar k Hu ng ary Fin lan d Cy p rus Mal ta MS or Region P P /UA A ( % ) 26.1 24.7 40.1 22.0 8.2 EU-avg DK CZ BE-FL BE-WA
Figure 2. 2005 Ratio of permanent pasture to total agricultural land in different Member States
Precautionary or complementary measures are in place in most Member States in order to prevent decreases in the ratio of permanent pastures to agricultural land. Different threshold values are linked to warnings, restrictions, obligations and sanctions. To date no Member State has had to enforce any measures or sanctions. In the Netherlands, an enormous increase in permanent pasture area of up to 68% has occurred, mainly due to new applications of dairy farmers applying, for the first time, for area aid.
At farm level, some Member States have implemented a farm reference ratio in order to monitor transfers of permanent pastures at the individual level (e.g. the Flanders region in Belgium). Regular controls are performed according to the procedures laid out in the Single Area Payment Schemes, but the percentages of farmers controlled vary between Member States. The percentage of on-the-spot checks is particularly high in Finland (50%) which can be explained by the low ratio of permanent pastures to agricultural land. None of the Member States reported the implementation of sanctions to date, but a strict follow-up by means of warnings was already implemented in some Member States.
At field level, Member States have to ensure that farmers provide a minimum level of maintenance and avoid deterioration of habitats. However, in none of the Member States, was it possible to distinguish between permanent pastures with or without high nature value. Some Member States organise special controls for parcels that are located within Natura 2000 sites. Records are not always kept of permanent pastures that are no longer declared due to transition to other land use such as nature conservation or abandonment.
3.2. Spatio-temporal analysis 3.2.1. Wallonia
The permanent pasture area in Wallonia, which regressed steadily from 1977 to 1995, has been stable since 1995 due to the effect of linking cattle subsidies to forage area; since then, utilised agricultural area has remained nearly constant. Almost all farmers receive direct payments and almost all utilised agricultural area is declared. Comparing different sources of information, it appears that at least 10% of permanent pasture land is not declared as it belongs to non-farmers, corresponds to very small parcels (< 0.5 ha) or is declared as temporary pasture. The permanent pasture ratio in Wallonia is 40.55%, which is higher than the EU average. However, in the different agricultural sub-regions the importance of permanent pasture can vary from 15% to 90%.
Région Limoneuse
Figure 3. Importance of permanent pastures in the Walloon agricultural regions
At the communal level, more differences become apparent. In Wallonia, the smallest unit of registration within IACS is the agricultural parcel, which allows for detailed spatio-temporal analysis. Nearly all the high to very high decreases, so-called “hot spot” classes, are located in communities with very low ratios where the conversion of a few hectares of permanent pastures to arable land has a high impact on the ratio. Natura 2000 zones contribute to more favourable and stable ratios.
Figure 4. Evolution of the ratio of permanent pastures to total agricultural area in the communes of the agricultural region
‘Région Limoneuse’ from 1997 to 2005
The permanent pasture ratio is calculated by the administration according to the formula provided in the EC regulation with the afforested land term set equal to zero. In order to avoid a decrease of more than 10% of this ratio, the following measures are applied:
• If the ratio decreases with less than 5% a geographical check is undertaken but no actions will be carried out at the farm level;
• If the ratio decreases between 5% and 7.5% a general warning will be communicated to farmers through specialist media; the farmer has to ask for an authorisation before converting permanent pasture to crops; the farmer can be allowed to plough up permanent pasture land if an equivalent area is sown in another place;
• If the ratio decreases with more than 7.5 % the farmer who has converted permanent pasture land has to re-sow an area of grassland in order to re-establish his farm permanent pasture reference area, without being obliged to re-convert exactly the same parcels that were ploughed up. In the IACS, permanent pasture parcels are grouped in a layer and identified by a code that is provided to the farmer with the
application folder every year. In case of exchanges of parcels, the code follows the parcel and obliges the new holder. The administration calculates the annual ratio on the basis of administrative declared data. If a ratio reduction greater than 7.5% is observed, a graphical procedure will be undertaken. It consists of overlaying the parcels layer with the reference permanent pasture layer. This provides the total parcel area that will have to be converted to permanent pasture.
3.2.2. Flanders
In the decade 1990-2000 and according to the National Institute for Statistics, the permanent pastures area in Flanders has reduced with more than 324 km² (about 15%) mainly due to substitution with forage crops, maize, temporary pasture and industrial crops. A part of the permanent pastures in Flanders is categorised as historical permanent pasture and has been protected from ploughing in specific zones since 1997.
The permanent pasture reference ratio is calculated according to the EC regulation, based on declarations made by farmers. The reference ratio, accounting for 24.77% of the total utilised agricultural area, is slightly less than the EU average. The permanent pasture area calculated by the IACS data is 14.7% lower than when calculated on the basis of national statistics. According to these statistics, the total permanent pasture area decreased with 7.0 % from 2003 to 2005, while for the same period IACS data show a decrease of only 0.29%. The main explanation for the differences is that the statistical data are census based and that IACS data only include farmers who apply for financial support. Farmers newly entering the IACS system obviously affect the ratio.
In Flanders each farmer who applies for financial EU-support, has to maintain the reference area of permanent pastures that has been attributed to them for the reference year of 2003. Each year the administration delivers documents and orthophotos to the farmer and provides the reference permanent pasture area that must be maintained on the farm. This farm reference area takes into account variations due to the transfer of land to or from another farmer in the previous year. Farmers are allowed to convert permanent pasture in arable land only if the parcel is not part of the Flemish Ecological Network or Natura 2000 sites, and if they guarantee the maintenance of their reference area by establishing new pastures on parcels that they have to manage as pasture at least for the following five years.
Flanders 0% 10% 20% 30% 40% 50% 60% 70% 80% 90% 100% a b c d e f g h i Drainage Class % of pa rc e ls 3 years pasture 2 years pasture 1 year pasture No pasture
Figure 5. Increasing percentage of permanent pasture parcels with decreasing drainage of the soil profile (a to g) and
Proceedings of the 12th MARS PAC Annual Conference, 2006
Geographical Information in support of the CAP
10
In Flanders, the smallest unit of registration within IACS is the agricultural parcel, which allows for detailed spatio-temporal analysis. Permanent pastures are often located on marginal land characterised by poorly drained soils or by the presence of permanently high water tables. Land on well-drained soil profiles is therefore more at risk of being converted to arable use.
The average density of permanent pastures is 29.5 ha/km² for the Flemish Ecological Network, 13 ha/km² for sites belonging to the Birds Directive and 10.4 ha/km² for sites belonging to the Habitats Directive. In total 22,768 hectares or 15.4 % of the permanent pastures are located in these zones. The implication for the ratio is that this percentage is guaranteed to remain permanent pasture, as a result of the above-mentioned restrictions on conversion in these areas.
Figure 6. Protective zones for permanent pastures in Flanders In Flanders each farmer is controlled on the maintenance of the reference ratio. In case of non-compliance, sanctions are possible, including the obligation of re-sowing the area needed to meet the farm’s reference ratio and potential loss of eligibility. Trends during 2003-2005 confirmed a substantial stability in the permanent pasture area.
3.2.3. Czech Republic
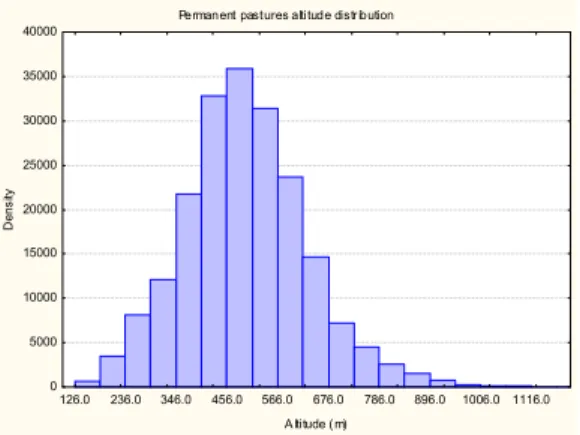
In the Czech Republic, permanent pastures are mainly located in extensive agricultural areas at high altitude. In regions of foothills and mountains they can represent up to 80% of the total agricultural area. However, in regions of intensive agriculture permanent pastures represent less than 3% of the agricultural area. Since 1992 a growing trend in pasture areas has been observed. In recent years the conversion of pasture into arable land has been prohibited for farmers joining the national agricultural subsidy system (first pillar). The unit of registration in IACS/LPIS is a “block” of land use meaning that spatio-temporal analysis and links with ancillary geographic layers are more difficult to establish.
Permanent pastures altitude distr ibution
126.0 236.0 346.0 456.0 566.0 676.0 786.0 896.0 1006.0 1116.0 A ltitude ( m) 0 5000 10000 15000 20000 25000 30000 35000 40000 D ens ity
Figure 7. Altitude distribution of parcels under permanent pastures in the Czech Republic
Permanent pastures - slope distribution
0.00 2.79 5.58 8.37 11.16 13.95 16.74 19.53 22.32 25.11 27.90 30.69 33.48 36.27 39.06 Slope (deg.) 0.0 10000.0 20000.0 30000.0 40000.0 50000.0 60000.0 70000.0 De n si ty
Figure 8. Slope distribution of parcels under permanent pastures in the Czech Republic
As a new Member State the EC regulation is applicable since 2005. In the initial LPIS definition, two types of grassland, i.e. meadows and pastures, were distinguished, but since 2005 in the SAPS declaration grasslands are being treated as permanent pasture according to the EC regulation. The permanent pasture reference ratio is 22.04%. However, this average ratio does not give the real picture of permanent pastures in the country, which varies regionally between 0.6 and 82%.
Figure 9. Regional variation in the ratio permanent pastures to agricultural land in the Czech Republic
Farmers who do not want to commit themselves to keep their grassland for five years or more under permanent pastures are not motivated to apply for subsidies for their grassland parcels. Conditions for farmers to apply for the conversion of declared permanent pasture into arable land are currently under discussion and there are no specific obligations to take into account different levels of decrease of the permanent pasture ratio. At the moment farmers are not allowed to convert permanent pastures, which can only be ploughed up once every five years for re-sowing grass in order to improve the pasture. According to current legislation ploughed permanent pastures must be converted back to grassland. The sanctions linked to the reference ratio have not been established yet.
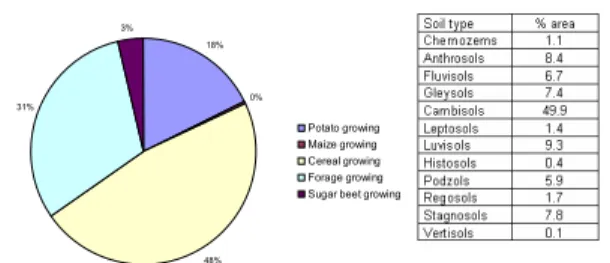
In the period 2003-2006 the conversion of pasture to arable land has been strongly reduced and this is a good indication of the commitment of the farmers to the CAP. Conversions between arable land and pasture are not related to any specific topography features such as altitude and slope, but rather to soil fertility and agricultural growing region. Permanent pasture parcels located on fertile soils such as chernozems, or in the potato and sugarbeet growing regions, are under threat of being converted to arable land.
18% 0% 48% 31% 3% Potato growing Maize growing Cereal growing Forage growing Sugar beet growing
Figure 10. Percentage of permanent pasture areas in different agricultural growing regions and on different soils in the Czech
Republic
3.2.4. Denmark
In Denmark permanent pastures are the most important habitat in intensively used agricultural landscapes and two thirds of them are protected against ploughing up under the Nature Protection Act. The area of permanent pasture, drastically reduced since the 2nd World War, has stabilised in the last
decade, but it is one of the smallest in Europe in relation to the total agricultural area.
The definition of permanent pastures has often changed and only since 2005 has been aligned with the definition applied in the EU regulation. The regulation is interpreted to include grassland that is re-sown more often than every five years provided that it is on the same area. From 2006, the definition also implies that permanent pastures should be either grazed or mown at least once every second year. In Denmark the unit of registration in IACS/LPIS is a “block” of land use; the link between the units of declaration and the definition of permanent pastures that ought to be kept for five years is therefore more difficult to establish.
The permanent pasture reference ratio is calculated according to EU regulation without taking into account the afforested land term. Afforestation on permanent pastures is negligible due to the protection of pastures and the design of afforestation schemes. If the ratio is reduced with 5% from the reference level, permanent pasture can be taken into rotation only after permission from the Ministry of Agriculture. If the ratio falls below 10% farmers that have ploughed up permanent pasture in the last 24 months have to re-establish them.
From 2003 to 2005 the permanent pasture ratio has increased by 2.8% and if we consider the lowest administrative levels, few municipalities showed a very limited decrease while in all five administrative regions the ratio increased.
Figure 11. Regional distribution of changes in permanent pasture area
At the field level the increase of the permanent pasture ratio is the combined effect of new permanent pasture and the ploughing up of existing ones: permanent pastures loss mainly happened in favour of temporary grassland (46%), arable crops (31% cereals, 7% other arable crops) and to a lesser extent abandonment (11%). A minor share of the changed area (3%) has gone into nature conservation projects.
New permanent pasture parcels established from 2003 to 2005 are generally larger than permanent pasture parcels that have been ploughed up in the same period. The overall increase of permanent pasture is mainly concentrated in the area protected under the Nature Protection Act and in Natura 2000 areas.
3.3. Recommendations
In order to improve the management of monitoring and control of permanent pastures, a comprehensive geo-information platform should be created. The IACS data should be linked to databases compiled for other monitoring purposes and to ancillary spatially explicit data such as orthophotos, remote sensing and other geographical layers in a geo-database. This requires the set-up of a spatially explicit and topologically correct inventory of all permanent pasture parcels in a 1:1 geo-referenced relation between IACS and LPIS and with explicit reference to the number of years the parcels are kept as pasture. In addition, historical IACS-LPIS data at the parcel level should be linked with databases compiled for other monitoring purposes such as those within the framework of the Nitrates Directive or pillar II support. An effective approach would be to identify different zones on the basis of IACS-LPIS information in combination with ancillary geographic information. A comprehensive geo-information platform in combination enables spatio-temporal risk analysis on the basis of which sensitive zones can be identified.
A spatially explicit inventory should be made of all types of grassland. More focus should be put on re-establishing the management of abandoned permanent pastures in order to maximise nature conservation benefits. Member States should use other options available to ensure the maintenance of permanent pasture in areas with specific interests/vulnerability, for example obligatory approval of conversion in Natura 2000 areas or in areas under agri-environmental schemes (2nd pillar support).
All the relevant authorities are recommended to initiate a precautionary action scheme where farmers have to apply for permission to convert permanent pasture when the ratio decreases with more than 5% and where measures are taken to re-establish permanent pasture from a decrease of ratio with more than 7.5%. Alternatively, ratios at farm level may be monitored. In addition, actions should be taken to detail sanctions in order to ensure transparency to the farmer. It must be clarified if and how 2nd pillar support schemes can be used
in relation to the precautionary actions linked to the obligation to maintain permanent pastures.
A typology could be made based on inter alia the ratio percentage of a Member State. Typologies would cluster Member States with similar characteristics in relation to the maintenance of permanent pastures. However, the creation of such a typology should be subject to further research as it will be necessary to include in-depth spatio-temporal data analysis and geographic supporting data. A typology would help directing recommendations in the different situations that Member States find themselves in with respect to the maintenance of permanent pastures.
Proceedings of the 12th MARS PAC Annual Conference, 2006
Geographical Information in support of the CAP
12
4. CONCLUSIONS
The ratio of permanent pasture area to agricultural land provides a simple tool for monitoring and controlling the protection of permanent pastures at the regional to Member State level. The national ratio of permanent pastures to agricultural land can be stable, but this number can mask regional differences. Regional variations may be influenced by various agro-ecological and socio-economic factors. The importance of creating sensitive zones is that they provide an indication of zones where permanent pastures are at risk of being converted to arable land, such as areas with high potential for growing profitable crops. The implication for the ratio of conservation zones such as Natura2000 sites is that the percentage of permanent pastures located in Nature Protection areas is protected from change.
The management of monitoring and control of permanent pastures requires the creation of a comprehensive geo-information platform that allows for spatio-temporal analysis to monitor changes, account for protective zones, keep record of abandoned pastures and establish sensitive zones. In cases where the smallest unit of registration within IACS is the parcel, the link between units of declaration, the definition of permanent pastures that ought to be kept for five years and ancillary geographic information is an unambiguous 1:1 georeferenced relationship. In cases of IACS registration according to physical blocks, îlots or cadastral references in LPIS, the geographic relationships are more difficult to
establish and subject to errors in spatio-temporal analyses which could be avoided with a spatially explicit inventory for permanent pasture.
5. REFERENCES AND SELECTED BIBLIOGRAPHY
Gobin, A., Brodsky, L., Andersen, E., Tychon, B., Campling, P., Longueville, F., Claes, S., Van Orshoven, J., Analysis of the new monitoring and control requirements of Permanent Pastures related to the Good Agricultural and Environmental Condition regulations. Final report of the study MARS PAC Action No. 2005/S 172-170363, 2007, pp 220.
Soldi, R., Torta, G. and Kirk, G., European Pasture Monography and Pasture Knowledge Base. European Communities, Luxembourg, 2004 .
6. ACKNOWLEDGEMENTS
The study was carried out on behalf of MARS PAC Action No. 2005/S 172-170363. The MARS PAC unit at the DG-JRC has supported the project with valuable comments. The authors would like to acknowledge the assistance of the administrations in Belgium, the Czech Republic and Denmark.
PROPOSED PROCEDURE OF VALIDATION AND CERTIFICATION OF GNSS
INSTRUMENTS AND OBSERVERS
S. Oszczak1, A. Ciecko1
1
Chair of Satellite Geodesy and Navigation, University of Warmia and Mazury in Olsztyn,
Heweliusza 5, 10-724 Olsztyn, Poland; http://kgsin.pl
KEY WORDS: IACS on-the-spot checks, precise farming, GNSS positioning, validation, certification
ABSTRACT
The paper presents some proposals for procedure of validation of GPS equipment to ensure the required level of accuracy and reliability for parcel area measurements during on-the-spot control for IACS and for precise farming. The proposed procedure and programme of training of observers for certification of proficiency to confirm the minimum required professional skill is also discussed.
1. INTRODUCTION
The area aid applications across the 27 EU member states cover almost 128 million hectares. According to EU regulations the area of agricultural fields must be checked against claims to ensure that farmers receive the right amount of subsidies. The checks can be made with the use of remote sensing technology as well as with a great help of GNSS (Global Navigation Satellite Systems) systems. Many member states have steadily been adopting handheld GNSS receivers as the quickest and most effective means of measurement for their land-based teams. The use of stand-alone GPS system for parcel measurement by farmers and national/regional Administration started in 2001. This evolution was possible by the removal of the Selective Availability in May 2000, in addition to the general geomatics technological progress. Positioning and measurement of an area is essential for obtaining proper and up-to-date information about declared parcels. In addition it can also give valuable and up-to-date information for LPIS database update, it is used for declaration of ineligible areas, agri-environmental features and other features connected with farming. The perimeter of the area is needed to calculate the tolerance of parcel’s area. The difference between declared and checked area should be less or equal than the tolerance. The wide variety of GNSS receivers and applications for field measurement are available on the market, starting from the simplest navigational handhelds (eg. Garmin; 300-600 €) where area measurement is possible, but limited in many aspects (limited number of records, no “pause” during measurement, etc.). A second group of units, most commonly in use nowadays, is based on SiRF Star III technology (GPS receiver) often combined with PDA and WindowsCE operating system. In this group of units we can find a large number of hardware developments (cable connections, data card connections, wireless Bluetooth or all-in-one devices) as well as a great number of software applications running under WindowsCE. The cost of the hardware is between 200-800 €, while the cost of the software depends mainly on complexity. The next group of the units comprises of more sophisticated receivers and GIS
software. The usage of this kind of equipment by the farmers is rather limited due the high cost of hardware/software starting from around 5000 €. Using this kind of equipment we can achieve accurate and reliable measurements in particular using local Differential GPS corrections applied to GNSS measurements. In this case an additional wireless transmission system (VHS radiomodem, FM/RDS, GSM/GPRS/UMTS) is needed to operate in real time.
According to Directive 2004/22/EC of the European Parliament and of the Council of 31 March 2004 on measuring instruments, devices and systems used for measurement for reasons of levying of taxes and duties, public interest, protection of the environment, protection of consumers have to satisfy the requirements given by the Directive. The measurement method is not dependent only upon GPS but also upon the equipment. The detailed requirements to be fulfilled by GNSS receiver to be used for on-the-spot checks are prepared by Joint Research Centre (JRC) of the European Commission. At the moment there is a strong need of a standardized way of checking that equipment works properly - validation protocol.
Based on our previous experience concerning, among the others, the tests and validation of GNSS methods and receivers for ARMA (paying agency) in Poland (2004), and validation of methods for measurement of land parcel areas (GPS Part) commissioned by JRC (2005), we have developed a proposal of such a validation protocol for different kinds of GNSS receivers willing to fulfil requirements of the European Commission and paying agencies. The validation procedures must include a wide range of testing conditions, including stringent tests of difficult measurement conditions. Different size and shape of the parcels should also be taken into consideration.
2. LAND PARCELS
The test field should consist of at least 6 parcels with various size, shape and obstructions of celestial sphere. The test parcels
Proceedings of the 12th MARS PAC Annual Conference, 2006
Geographical Information in support of the CAP
14
should include parcels with: good and bad borders (e.g. obstructed horizon by forest causes bad border). An example of reference parcels which could be used in validation procedure is given in Figure. 1.
Figure. 1 Suggested land parcels schema for the validation procedure
For the needs of validation testing, “artificial parcels” – marked with wooden stakes – are prepared and used instead of real parcels, since natural borders are sometimes confusing and can introduce an error to observations. The stakes on the corners should be one meter long and the stakes about 35cm long should be placed every 15-20 meters along the borders. Each parcel should have its own colour of stakes, which is especially important when the borders of two parcels are close to each other. It is important that no border can be the same for two parcels, since this would cause confusions and errors. The minimum distance between two parcel borders should be 10 meters; although in some situations intersection of borders is acceptable. After establishing all the stakes in the field the parcels should be precisely measured using geodetic techniques, e.g. Total Station. All measurements should be tied to the ETRF’89 system of coordinates.
3. FIELD TESTS
Before an actual test of GNSS equipment, one should check technical specification of the receiver. Especially important for the measurement and inspections purposes are: good quality graphic display, long enough battery capacity (min. 8 hours), memory enabling storage of at least 2-3 days of measurements, dust/water resistance, EGNOS capability.
The test should last for at least 6 days (each day the measurements should be performed at the same time) and every day each parcel must be measured at least 4 times. Having one receiver and following the land parcels schema given in fig. 1 the proposed order of measurements is given in Table 1. Before the measurements the operator should get extensive instructions on how to measure parcel with given receiver, and he or she should also be familiar with the parcels established in the field. Following the proposed schema of field measurement, the measurement will last about 4 hours a day. All collected
data must be stored in GIS format for further calculations and statistical analyses.
Day 1, Day 4 Day 2, Day 5 Day 3, Day 6
morning afternoon morning afternoon morning afternoon
a b a b c d c d e f e f b c b c d e d e f a f a c d c d e f e f a b a b d e d e f a f a b c b c e f e f a b a b c d c d M eas ur em en t Sc he dul e f a f a b c b c d e d e
Table 1. Measurement schedule for single receiver testing Until EGNOS (The European Geostationary Navigation Overlay System) is not fully operational (FOC Full Operational Capability Status) it is recommended not to use EGNOS corrections during the test, since EGNOS data can introduce errors and confusing results.
4. STATISTICAL ANALYSES
After collection of all necessary measurement data in the field an extensive statistical elaboration of the collected results is required. The statistical studies should be performed rigorously according to the ISO – 5725-2 standard – “Accuracy (trueness and precision) of measurement methods and results - Part 2: Basic method for the determination of repeatability and reproducibility of a standard measurement method”
The first step in statistical approach is detection of the outliers among collected results of measurements. The pooling factor in case of field tests of GPS receivers is day of observation. Different days implement reproduction of the measurements in different conditions when there is no other significant factor. The Mandel's test statistics are computed for each day of measurements. Critical values are taken into account at 1 % level and at 5 % level of χ2 distribution.
The Cochran's test is designed to check if the variances between replicates are equal for each day of survey for a given parcel. If the test statistic is greater than its 1 % critical value, the measurement tested is a statistical outlier and is removed from the data. The critical values are taken from χ2 distribution.
The Grubb's test assumes a set of data arranged in ascending order x1, x2 … xn with mean mi and standard deviation σi. The extreme value x1 if G = Gm or xn if G = Gmax is called a straggler if G is greater than its 5% critical value and less than or equal to its 1% critical value. It is called an outlier if G is greater than its 1% critical value. The critical values are taken from χ2 distribution.
After detection of outliers one can calculate and model a wide range of statistical parameters such as: parcel area error, bias of the receiver, standard deviation for all parcels, buffer value and point position error. These calculations finalise the statistical approach and this results give the answer if the receiver can be certified.
In spite of testing and validation of the GNSS equipment it must be stressed that proper qualification of the operator of the instrument is essential. It is especially important in case of official field inspectors, who should have received sufficient instructions and certified training and get official certification of proficiency.
5. TRAINING OF OBSERVERS
The proper qualification of the operators of GNNS equipment measuring the parcel is no less important than the validation of receivers. The operator must understand „art & science” - the theory and practice of satellite measurements.
The theoretical training of the inspector should include the following subjects:
Basic definitions: Reference surfaces: WGS’84 ellipsoid,
reference horizontal plane; Reference coordinates frames: WGS’84 geographical coordinates, cartesian 3D system; projections onto the plane, cartesian 2D system, grid coordinates systems; Local, national and global coordinate systems; Transformation between the different systems of coordinates; Fundamentals of satellite positioning.
Design of survey: Selection of proper methods of
measurement: classical – tape, Total Station, others; Satellite – GPS stand- alone, EGNOS, DGPS, RTK; Remote sensing photogrammetric methods.
GPS/EGNOS positioning: System architecture, signals,
measurements and receivers; Differential GPS (DGPS/RTK) ground-base systems; EGNOS/WAAS satellite-base augmentation; Error sources; Estimation of position and accuracy.
GPS/EGNOS parcel area measurements: Stop-and-go
method of border points positioning; Continuous/kinematic measurement of an area and parcel perimeter; Combined classical + satellite methods; Estimation of accuracy; Determination of acceptable buffer zone = perimeter ⋅ assumed positioning accuracy factor.
Processing of measurement data: Downloading measurement
data; Software for managing the data; Visualization; Transformations between different coordinate systems; Quality control (QC) of data and solutions; Creating data bases/archiving.
Estimation of accuracy and reliability of the results:
Accuracy = Precision + Systematic Errors; Estimation of precision via Least Squares Method assuming normal distribution of random errors; Effect of Geometrical Dilution of Precision; Systematic errors reduction via mathematical modelling of physical errors and using differential DGPS technique; Estimation of reliability via QC of solutions, independent redundant checks of GNSS determinations. Theoretical lectures must be supplemented by practical examples of using the GNSS receivers in the field. Course participants should get extensive field training of parcel area measurements, as well as detailed information on the preparation of technical documents needed for the on-the-spot check protocol.
6. CONCLUSIONS
According to Art.23 of R.796/2004, on-the-spot checks shall be made in such a way as to ensure effective verification of compliance with the terms under which aid is granted. GNSS area measurements made by single systems (standalone) must work using a parcel-perimeter approach. Nowadays the tolerance to be applied is up to 1.25m times the perimeter of the parcel. Recently, it is recommended by the European Commission that a systematic test of a particular receiver/system should be performed and in the near future the validation of GNSS equipment is expected to be obligatory. In spite of testing and validation of the GNSS equipment it must be stressed that proper qualification of the operator of the instrument is essential. The inspector should have received sufficient instructions and certified training, and should be largely able to undertake the work autonomously.
7. REFERENCES AND SELECTED BIBLIOGRAPHY
Bogaert, P., Delincé, J., Kay S., Assessing the error of polygonal area measurements: a general formulation with applications to agriculture, Meas. Sci. Technol. 16 (2005) 1170–1178.
Ciecko, A., Oszczak, S., Validation of Methods for Measurement of Land Parcel Areas: GPS Results, Presentation at the GPS Workshop, Wageningen, Netherlands, 5 - 6 October 2005, http://agrifish.jrc.it/marspac/LPIS/ meetings/GPSWorkshop2005/Ciecko_Oszczak_JRC_Worksho p.pdf
Directive 2004/22/EC Of The European Parliament and of the Council of 31 March 2004 on Measuring Instruments, Official Journal of the European Union, L 135/1, 30.4.2004
Hejmanowska, B., Validation of methods for measurement of land parcel areas. Final report. 2005, http://agrifish.jrc.it/ Documents/lpis/ValidationMethodFinalVer2_2.pdf
Kay S., Field Area Checks Using GPS, GIM International, July 2005, Volume 19, Issue 7, http://www.gim-international.com /issues/articles/id502-ield_Area_Checks_Using_GPS.html Kay S., Field Area Checks Using GPS (2), GIM International, January 2006, Volume 20, Issue 1, http://www.gim-international.com/issues/articles/id602-Field_Area_Checks_ Using_GPS.html
Kay, S., Technical tolerances for On the Spot checks v2.1. Technical Information Document, http://agrifish.jrc.it/ documents/control/recommendations/5834.pdf
Oszczak, S. et al, Assessment and development of selection criteria for GPS measurement methods and equipment to ensure required accuracy and reliability of area-based subsidies control in IACS. Report for ARMA, Poland, 2004.
CONTROL WITH REMOTE SENSING CAMPAIGN ROMANIA 2007
S. Gacichevic1, O. Mihailescu2
1
Romanian Paying and Intervention Agency for Agriculture, Director of IACS Directorate
2
GAUSS Ltd, RO, Department Manager
1. STATUS OF LPIS IN ROMANIA - OUTLINE
• Reference Parcel / Input Data
• Reference parcel in Romania: Physical Blocks based on Orthophoto.
• Orthophotos:
- Delivered by the National Agency for Cadastre - Color, scale1:5.000, pixel resolution 0.5m, accuracy of
+/-1.5m
- Acquired through 7 different aero-photogrammetric projects between 2002-2005
♦ The most complex situation due to: scattered coverage per project, heterogeneous quality of images
2. INPUT DATA
• Status of orthophoto provision:
• 99.43% (237638 sq km) of images delivered - about 99.23% retained
- about 0.20 % returned for quality problems
♦ Part of them have to be reprocessed
♦ Part of them have to be entirely re-flown and
processed
• 0.37 % of images are missing • Solutions:
- Use of HR images
- Use of cadastre maps scale 1:5000
3. DIGITIZATION OF PHYSICAL BLOCKS
• Under completion by 4 external contractors + 1 external quality controller.
• Deliverables by municipality: tile mosaics, physical block coverage with attributes, 1:10.000 printed maps of municipalities, 1:5.000 digital (*.PDF) files with physical blocks, Hard disc drive with images and physical blocks of the Judet and neighboring Judets
• So far: 2692 municipalities digitized and approved by the external quality controller
- out of a total of 3.183
4. FIRST UDPDATE OF THE PHYSICAL BLOCKS
• Based on the verification of the observation forms, at the end of the linkage campaign, the blocks suggested for correction will be divided into three categories:
- physical blocks that can be corrected only based on the observation templates (e.g. change of land use category) - physical blocks that can be corrected only after meeting the farmers again, based on the more detailed 1:5000 maps of the physical blocks. (E.g. change of certain block limits, splits or reunions of blocks, etc)
- physical blocks that can be corrected only after going on-the-spot for measurements (e.g.: different shape of a border or, creation of some new blocks)
• The first category of blocks will be updated beginning December 2006
• The second and third category of blocks will be updated during the on-the-spot campaign of the next year.
5. LINK WITH THE FARMER, NATIONWIDE CAMPAIGN INVOLVING MORE THAN 2.000 STAFF
MEMBERS OF THE PIAA
• Input data:
- maps from digitization
- Farm registration templates filled by the farmer
♦ march 2006: 1.4 million farmers registered, out of expected 1.5 million, the rest can register during the linkage campaign.
♦ Contact info about the farmer
♦ List of parcels and location by municipality
• Output data:
- Updating the registration information
- Corresponding Physical block number for each parcel to be completed during the link with the farmer - Systematic collection of farmers’ observations about the
physical blocks • Results:
- out of the 2520 municipalities delivered so far (24.11.2006) by the digitizers (with corresponding mosaics, physical blocks and maps), the link with the farmer has been finalized in 2227 municipalities (24.11.2006).
- Expected ending date for linkage in the last municipality is December 2006. (Phase 1)
• The campaign is designed to run in 2 phases.
• Phase 1 – is implemented in each municipality as soon as the map(s) become available, a PIAA team goes there for 2-3 weeks to meet the farmers. (jun. 2006 – dec. 2006) • Phase 2 – will be implemented at the county office. • Objective:
- Completion of the parcel identification process - Correction of errors for up to 60 % of the registered
area
- Quality control to be performed with all farmers in
Romania > 50 ha approximately 13.000 farms representing round about 6 Mio. Ha of
agricultural land • Organization:
- Three trained staff members per Judet - Start of the campaign: 04. December 2006 - End of the campaign: at latest mid of March 2007 • Necessary input:
- Three trained staff members - Three working stations - LAFIS LFK installed
- Hard disc drive with images and physical blocks of the Judet and neighboring Judets
Proceedings of the 12th MARS PAC Annual Conference, 2006
Geographical Information in support of the CAP
18
- Working on-screen with the farmer to identify the parcels
- Possibility to measure parcels of the farmer
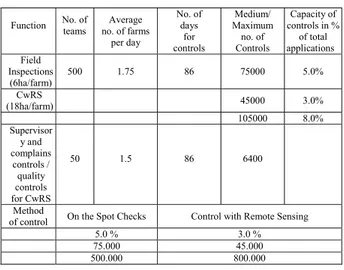
Function No. of teams no. of farms Average per day No. of days for controls Medium/ Maximum no. of Controls Capacity of controls in % of total applications Field Inspections (6ha/farm) 500 1.75 86 75000 5.0% CwRS (18ha/farm) 45000 3.0% 105000 8.0% Supervisor y and complains controls / quality controls for CwRS 50 1.5 86 6400 Method
of control On the Spot Checks Control with Remote Sensing
5.0 % 3.0 %
75.000 45.000
500.000 800.000
Table 1. OTS checks in Romania 2007
6. OTS CONTROL IN ROMANIA 2007
On-the-spot controls – at county level executed by teams of: • Internal inspectors (permanent staff) –500 internal
inspectors (10-12 inspectors/county) and extra 500 outsourced to contractors
- Another 210 permanent staff - preparing and processing of documentation
• Another 42 teams are for supervisory controls which will be done for 2% from all applicants checked and also 8 supervisory teams for controls to solve complains. • Procedures are elaborated at central level
• An adequate training for all the internal field inspectors started in November 2006
• Central level will include a special team for supervisory and quality controls for CwRS
• 500 of the contractors employees shall be trained and tested in April and May 2007
• The complex team is composed of a PIAA inspector and a contractors employee
7. 2007 CwRS CAMPAIGN
• An official letter was sent to JRC at the end of July requesting satellite quota for next year’s campaign for 20 sites
• JRC was notified for the participation of Romania in the EU call for tender in November 2006
• PIAA planned the budget of CwRS 2007 for the tender launched by JRC by the mid of November 2006
• The technical processing of the imagery will be made by private contractors
• Based on the findings of the Pilot project a National Addendum will be prepared by PIAA including any specialities related to the Romanian situation which are not covered by Common Technical Specification (JRC)
8. SITE SELECTION FOR 2007 CwRS CAMPAIGN
CwRS control zone selection based on farm registry data: Description:
1. Fix grid with 30 Km x 30 Km cells is defined (grid_no1)
2. grid intersected with communes boundaries
3. Communes linked to grid if more than 80% of commune area falls within grid.
4. farmers that have more than 80% of their area in the communes belonging to one grid are selected
5. total area of farms, number of parcel and average area of farms within the grid is calculated
Grids highlighted:
a. area that can be controlled is larger than 23000 ha in the grid
b. average farm area in the grid is larger than 16 hectares
Area that can be controlled by
remote sensing 639869 hectares
Number of dossiers that can be
controlled by remote sensing 25782 Number of parcels to be checked 124270 Average area of controlled farms 24.8 hectares Average parcel size 5.1 hectares Average controlled per grid 31993 hectares Average controlled dossiers per grid 1289
9. PILOT PROJECT FOR CwRS -2006
• The Pilot testing for the two sites (Lupsanu and Valea Calugareasca) was executed by GAUSS Ltd, RO with two secondary contractors: Maieutika Ltd, HU and MedSoftOrg Ltd, HU, special thanks to Dr.Daniel Kristof from Szent Istvan University, Institute of Environmental Management Department of Geomatics, and Prof.univ.dr.ing. Dima Nicolae and prof.univ.dr.ing. Herbei Octavian from Petrosani University.
• Lupsanu: 50 claims – area and crop control is done with CAPI, on a VHR QuickBird and 4 SPOT multispectral images
• Valea Calugareasca: 71 claims - area control is done with CAPI, on a VHR QuickBird, crop control was managed with on the spot control (OTS) with GPS measurements
10. RESULTS OF OTS PILOT PROJECT LUPSANU & VALEA CALUGAREASCA
• OTS proved that the physical blocks were well digitized • An increased quality of parcel identification will induce a
• Measuring two medium farms per day is a realistic subject • The results will be used in the remote sensing procedures
manual and in the dimensioning structure of the follow – up personnel
Statistics of the claim evaluation based on crop parcel
• 78 % of the crop parcels are OK, can go to administrative and on-the-spot control
• 10% can be solved by the administration, with the use of the LPIS or other database - manual work, takes time • 12% needs a contact with the farmer, or not usable claim
data
Summary of the result of linking the claim data and the parcels on the blockmap - percentage of the parcels
Statistics of the claim evaluation based on dossiers
• 66 % of the claim has no problem during the data capturing, parcel claim rows and drawings are OK, can go to control
• 34 % needs some procedure before the control step: - 21 % has an obvious error, so the administration has to
deal with manually
- 14 % of the claim has an error only the farmer can correct - contact to the farmer
- 17 % has both obvious +not correctable errors
Documenting the parcels errors to the PIA for follow-up
• 18 % of the eligible area of the physical blocks were OVERDECLARED
• 3, 17 % of the crop parcels are affected by the 12 % slope problem (GAEC).
The result on dossier level after the compensation inside the crop groups
• 36 % of the dossiers were over declared in their area, and 18 % of the dossier has higher over declaration then 5% • There are 13 crop groups SAPS+12 CNDP categories
Result on dossier level % of the dossiers Under declared = declared less area of
crops, then found, AREA OK 54% Area of crops declared and found are
the same AREA OK 11%
64%
Area over declaration from 1-5 % 18% Area over declaration from 5,01-10 % 4% Area over declaration from 10,01-20 % 7% Area over declaration from 20,01-50 % 7%
36%
11. CONCLUSIONS – CwRS
• The RS control was managed based on the EU CTS rules, and specific error codes for Top-up and GAEC were defined
• The help of the cluster map was important to support the CAPI
• There is need for early spring and spring images in 2007 to be able to:
- control better the grasslands and the GAEC criteria’s - verify the eligibility criteria (January 2007)
• To apply RS control in 2007 is the only way to complete the control rate in a 3-4 month period
• More efficient to apply the VHR+time series of HR images method rather then VHR+RFV or OTS - this is more time consuming and more expensive.
• Serious actions must be taken to decrease the errors: - managing an area over declaration control before May
2007, and informing the farmers
- make the farmers aware of the importance of crop type (because of the top-up) and the precision required during defining the area of the parcels.
Session 3: Benchmarking of satellites and airborne instruments,
trials and studies
ORTHORECTIFIED FORMOSAT-2 DATA PERFORMANCE IN THE CWRS CAMPAIGN
2006 AND FUTURE APPLICATIONS
V. Vassilev1, S. Popova1, A. Garnier2, M. Mangolini2, T. Westin3, P. Åstrand4, P. Milenov4
1
Remote Sensing Application Center – ReSAC,61, Tzar Assen Str., 1463 Sofia, Bulgaria, http://www.resac-bg.org/,
resac@techno-link.com
2
Spot Image, 5 rue des satellites, BP 14359, F-31030 Toulouse Cedex 4, http://www.spotimage.fr,
alexandra.garnier@spotimage.fr, marc.mangolini@spotimage.fr
3
Spacemetric AB, Tingsv. 19, SE-19161 Sollentuna, Sweden, http://www.spacemetric.com, tw@spacemetric.com
4European Commission JRC, IPSC, Agriculture and Fisheries Unit, TP266, I-21020 Ispra (VA), Italy
http://agrifish.jrc.it/
,
par-johan.astrand@jrc.it
,
pavel.milenov@jrc.itKEY WORDS: FORMOSAT-2, Very High Resolution, geometry, rigorous modelling, accuracy, Independent Check Points (ICP) ABSTRACT
FORMOSAT-2 (NSPO, Taiwan) was launched on 21st of May, 2004. FORMOSAT-2 was programmed as Very High Resolution (VHR) backup sensor for the 2006 years CwRS Campaign over 12 control zones (7.474 km2). The area success rate was as high as 87.5% (10/12 sites). The delivery of cloud free imagery was more than acceptable (88.9% < 5%, 11.1 % 5%-8 % Cloud Cover). Delivery of Level 1A radiometrically corrected sites worked very smoothly with average image production time of 4 days. Difficulties were however encountered to reach the required location accuracy in production of Level 3 orthorectified imagery (3.5 RMSE1D, [ref 1]) for the sites. A
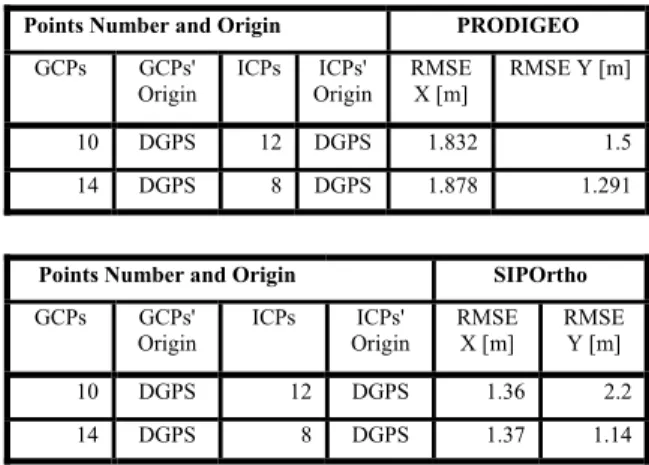
presentation at Toulouse CwRS Conference [ref 2] deals with the difficulties encountered over the control sites, which resulted in embarking on the present study on the Sofia F2 imagery. This study makes robust modelling using 4 software suites on near nadir F2 imagery, making use of GCPs from DGPS measurements, and from orthoimagery, separately allowing accordingly the examination of the effect of accuracy measurements, and the effect of point distribution on orthorectification. Results are promising, demonstrating that it is possible to perform good orthorectification using standard software packages reaching results inside the CwRS requirements. Future tests should however be carried out as to define the optimal number of GCPs to be used when orthorectifying F2 images on a routine basis. Furthermore, the effect of the incidence angle on the accuracy of the orthorectification should also be studied.
1. INTRODUCTION 1.1. Study Aim
The European Commission Services use remotely sensed data in a series of programmes; one of the largest being within the Control with Remote Sensing where aim is to identify irregularities in subsidy claims. Taking into account the enlargement of EU to 27 Member States and subsequent increased number of the sites to be controlled with use of satellite imagery, the possibility to include new sensors like FORMOSAT-2 have to be explored. This will increase the acquisition capacity and will ensure timely delivery of the necessary imagery to the MS administrations and their contractors. Due to its fixed orbit, FORMOSAT-2 is particularly interesting for the areas covered by its swath, because of the daily revisit capacity. In this respect, the satellite could be used as backup of the “prime” dedicated VHR sensors IKONOS and Quickbird.
The study objectives were:
1. to determine a reliable, operational, approach for orthorectification of the FORMOSAT-2;
2. to perform the orthorectification with different vendor-specific and off-the-shelf image processing software suites and to compare the results.
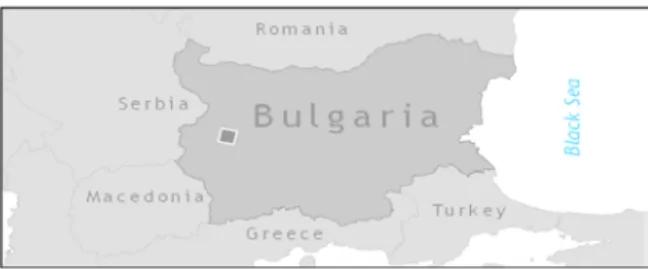
1.2. Study site
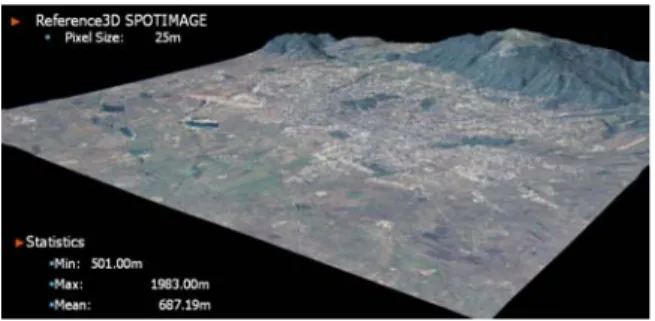
The study area covers the extent of Sofia City - the capital of Bulgaria, - and the Northern hillsides of Vitosha Mountain. The capital is situated in Sofia Valley which is an important for the agricultural plain. The average elevation inside the city is 550m a.s.l., while the nearest highest point is Cherni Vrah ("Black Peak"), 2290m, located to the South, in the Vitosha Mountain. The study area presents various landscapes and terrain variations, thus being a suitable test site for orthorectification and geometry quality assessment.
1.3. Study Instrument and Acquired Imagery
FORMOSAT-2 (NSPO, Taiwan) was launched on 21st of May, 2004. It carries two cameras that deliver imagery of the Earth in the visible (panchromatic (PAN), 0.45 – 0.9µm) and near infrared (multispectral (MSP), 4 bands) electromagnetic spectrum. The swath covered by these high resolution cameras is 24 km at Nadir and their nominal instantaneous geometric field of view, at Nadir, is 2 metres for the PAN sensor and 8 metres for the MSPsensor. F2 has a sun and geosynchronous orbit of 14 fixed orbits/day, and the sensor can be tilted ± 45º