HAL Id: hal-01819407
https://hal.archives-ouvertes.fr/hal-01819407
Submitted on 20 Jun 2018
HAL is a multi-disciplinary open access
archive for the deposit and dissemination of
sci-entific research documents, whether they are
pub-lished or not. The documents may come from
teaching and research institutions in France or
abroad, or from public or private research centers.
L’archive ouverte pluridisciplinaire HAL, est
destinée au dépôt et à la diffusion de documents
scientifiques de niveau recherche, publiés ou non,
émanant des établissements d’enseignement et de
recherche français ou étrangers, des laboratoires
publics ou privés.
Physiological Parameters Variation Based on the
Sensory Stimuli used by a Robot in a News Reading
Task
Roxana Agrigoroaie, Adriana Tapus
To cite this version:
Roxana Agrigoroaie, Adriana Tapus. Physiological Parameters Variation Based on the Sensory Stimuli
used by a Robot in a News Reading Task. The 27th IEEE International Conference on Robot and
Human Interactive Communication, Aug 2018, Nanjing, China. �hal-01819407�
Physiological Parameters Variation Based on the Sensory Stimuli used
by a Robot in a News Reading Task
Roxana Agrigoroaie and Adriana Tapus
Abstract— Enabling robots to determine how physiological parameters vary in relation to the profile of an individual can lead to a better adaptation of the behavior of the robot to the needs of the individual it interacts with. This paper investigates how physiological parameters (i.e., blinking, galvanic skin response (GSR), facial temperature variation) vary in a news reading task, based on various types of stimuli (i.e., auditory and visual) that TIAGo robot uses to present the news. The results from a within participant study with 11 participants are reported. We also consider the impact of personality and the user sensory profile (based on Adult and Adolescent Sensory Profile (AASP)) for the physiological parameters variation. Our results show that blinking is the main physiological parameter that varies in the non-stressing task of news reading.
I. INTRODUCTION
An extensive research was conducted in HRI with the purpose of adapting the behavior of a robot to the individual it interacts with. Multiple aspects have been used for the adaptation. Most notable aspects are: the affective state of the individual [1], proxemics [2], personality traits [3], and different body signals [4]. Recently, the authors of [5] have shown that the sensory profile of an individual can also be used.
The research also indicates that there are different physi-ological parameters (e.g., heart rate [6], respiration rate [7], [8], galvanic skin response (GSR) [9], [10], facial temper-ature variation [11], [12], facial expressions [13], blinking [14], [15]) that can be used to measure how an individual reacts to different stimuli or in different situations.
A robot capable of measuring these parameters can better understand the internal state of the individual it interacts with. Thus, it can adapt its behavior to better suit the needs of that individual. For example, the robot could detect that the individual is stressed, and as a result it could lower its speech volume, interact at a greater distance and lower the amount of stimuli used throughout the interaction.
Our current research focuses on three physiological pa-rameters: blinking, GSR, and facial temperature variation.
The authors of [11] have shown that how the temperature varies across different regions on the face could indicate the emotional state of an individual. For example, a decrease of the temperature in the nose region could mean that the individual is stressed. Anxiety is characterized by an increase of the temperature in the periorbital and forehead regions. *This work was funded and conducted in the context of the EU H2020 ENRICHME projet, Grant Agreement No:643691
The authors are at the Autonomous Systems and Robotics Labora-tory, U2IS, ENSTA-ParisTech, Universit´e Paris-Saclay, Palaiseau, France
The authors of [12] have performed a literature review to determine which are the facial regions that provide valuable information regarding the internal state of a person. They have found six regions of interest (i.e., nose, chin, cheeks, periorbital region, maxillary area, and the forehead).
The galvanic skin response (GSR) has been used by the authors of [16] to measure the cognitive load of individuals in a reading task. It has also been used to determine the arousal level [9], or the emotional state of an individual [17].
The blinking rate of an individual changes based on the activity performed. It also relates to the difficulty level of the task performed [15]. A difficult task leads to an increase in blinking rate. The authors of [14] found a mean blinking rate of 26 blinks/minute during a conversation, compared to 17 blinks/minute as the average resting blinking rate. Exposure to different visual or auditory stimuli can also affect the blinking rate [18], [19]. A decrease in blinking rate has been found in cases of exposure to sensory stimuli.
The current study wants to investigate how the physiologi-cal parameters (i.e., blinking, GSR, facial temperature varia-tion) vary depending on the personality of the participant and the type of sensory stimuli (i.e., visual, auditory) a robot uses in a news reading task. Another factor taken into account in this research is the interaction distance between the robot and the participants (i.e., personal and social distance [20]). From the personality theories found in the literature (e.g., Big 5 model [21], Eysenck Personality Theory [22], Gray’s Reinforcement Sensitivity Theory [23]), two are considered in this research. These two have been selected (i.e., Eysenck Personality Theory, Reinforcement Sensitivity Theory) as both of them strongly relate physiological parameters to different personality traits.
In this paper we also use the model for the user’s sensory profile introduced by Dunn [24] for measuring how individ-uals respond to different stimuli. For example, individindivid-uals that have a high neurological threshold require high-intensity stimuli.
The paper is structured as follows: Section III describes how the data was recorded and analyzed. Section II presents the experimental design. In Section IV, the results are summarized. A short discussion is provided in Section V. The conclusions and a perspective on future works are part of Section VI.
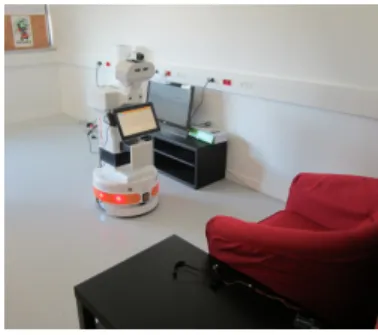
Fig. 1. Laboratory setup with TIAGo Robot
II. EXPERIMENTALDESIGN A. Robotic platform and sensors
For this experiment the TIAGo robot [25] was used. It was developed by PAL Robotics1 in Spain and was customized
for the requirements of the ENRICHME European H2020 research project. The robot (see Fig. 1) features a mobile base, a lifting torso, a touch-screen, and a head.
The speakers are mounted in the head of the robot. The head also features the RGB-D sensor. The Orbbec Astra RGB-D sensor provides RGB images of 640x640 at a frame rate of up to 30 frames/second. The Optris PI450 thermal camera, mounted on the head of the robot, has an optical resolution of 382x288 pixels at a frame rate of up to 80 frames/second.
The GSR sensor used was manufactured by Grove2. The sensor was placed for all the participants on the ring and middle finger of the left hand.
B. Questionnaires
Each participant filled all of the following questionnaires: Eysenck Personality Questionnaire (EPQ) [26] was devel-oped to measure the four personality traits of the Eysenck personality model. The personality traits are: extraversion (E), neuroticism (N), psychotism (P), and lie/social desirabil-ity (L). The model proposes that each personaldesirabil-ity trait has a physiological basis. Extraversion is based on cortical arousal [27], which can be measured by skin conductance, or by using electroencephalograms (EEG). Introverts show greater electrodermal activity than extraverts under non-stressing conditions [28]. Neuroticism is based on the activation of the limbic system [27]. In Eysenck’s view neuroticism is equivalent to the degree of emotionality [29]. Psychotism is characterized by hostile, suspicious, impersonal, and agres-sive personality [30]. It was shown that males tend to have much higher psychotism scores than females [27]. As a result, testosterone levels could be used as an indicator of psychotism. Research confirms that the personality traits are determined by biological factors [22]. Each of the personality traits are measured on a scale from 0 to 12. All results were categorized as either low (scores less than or equal to 6), or high (scores greater than 6).
1www.pal-robotics.com
2http://wiki.seeed.cc/Grove-GSR Sensor
The Reinforcement Sensitivity Theory Personality Questionnaire (RST-PQ) [31] is based on the theoretical analysis of the Reinforcement Sensitivity Theory (RST) proposed by Gray [23]. RST proposes that the personality of a person is based on three neurobehavioral systems. The Fight Flight Freeze System (FFFS) is responsible for the reactions towards aversive stimuli. The Behavior Activation System (BAS) is responsible for the reactions towards all rewarding (“appetitive”) stimuli. The last system, the Behav-ior Inhibition System (BIS), is responsible for the reactions in the situations where there is conflict between approach (BAS) and avoidance (FFFS) situations. RST-PQ was de-veloped to measure all three systems. For the BAS there are 4 subscales: Impulsivity I), Reward Interest (BAS-RI), Reward Reactivity (BAS-RR), Goal-Driven Persistance (BAS-GDP). Each system is measured on a scale from 1 to 4. The results of the participants were categorized as either low (scores less than or equal to 2), or high (scores greater than 2).
Adult/Adolescent Sensory Profile Questionnaire (AASP) [32] was developed to measure the sensory profile of an individual. Dunn [24] proposed a four-quadrant model to measure the responses to everyday sensory experiences. It was initially proposed for children, but research showed that it can be applied to adults as well [33]. The model proposes that there is a relationship between the neurological threshold (low and high), and the behavioral response (accordance and counteract), which lead to four-quadrants: Low Registration (AASP-LR), Sensation Seeking (AASP-SS), Sensation Avoiding (AASP-SA), and Sensory Sensitivity (AASP-Sens). Each quadrant is characterized by six sensory processing categories (i.e., activity level, auditory, movement, taste/smell, touch, and visual). Each processing category is measured on a scale from 1 to 5. The results of the participants were categorized as either low (scores less than or equal to 2.5) or high (scores higher than 2.5).
C. Participants
Eleven participants (2 females and 9 males, with mean age of 26.81, SD=4.56) agreed to take part in this experiment. All participants have a technical background. The participants were required to answer on a scale from 1 (“Not at all”) to 5 (“Very much”) how much they knew about robotics. One participant reported no knowledge at all, 1 a little knowledge, 2 somewhat, 5 knew much, while 2 knew very much.
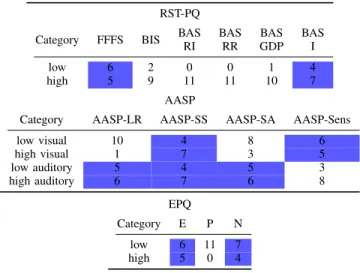
Table I summarizes the results of the participants to the questionnaires presented in Section II-B. A technical problem was encountered while recording the thermal data for two participants.
Therefore, the thermal data from the 9 participants was used for the analysis. The blinking and the GSR physiolog-ical parameters were analyzed for all 11 participants.
Based on the results from Table I the following ques-tionnaire results were considered for further analysis: FFFS, and BAS-I (from RST), E, and N (from EPQ), and auditory
TABLE I
PARTICIPANTS DISTRIBUTION BASED ON QUESTIONNAIRES RESULTS
RST-PQ
Category FFFS BIS BASRI BASRR GDPBAS BASI
low 6 2 0 0 1 4
high 5 9 11 11 10 7
AASP
Category AASP-LR AASP-SS AASP-SA AASP-Sens
low visual 10 4 8 6 high visual 1 7 3 5 low auditory 5 4 5 3 high auditory 6 7 6 8 EPQ Category E P N low 6 11 7 high 5 0 4
LR, visual and auditory SS, auditory AASP-SA, and visual AASP-Sens from AASP.
D. Scenario
For the participants to take part in this experiment, they had to sign a consent form and to fill in the questionnaires presented in Section II-B. Each participant was escorted to the laboratory by the experimenter. Upon arriving in the experimental area, the experimenter explained what the experiment consisted of. Once the participants confirmed that they understood what they had to do, the experimenter left the experimental zone and the experiment started.
The task that the participants had to perform was a news reading task. For this purpose, the web-based News Application module of the ENRICHME H2020 research project was used. The module uses the RSS 2.0 feed of different newspapers to gather the latest news and display them to the user. During this experiment, the news from The Guardian newspaper, “World” category were presented. The news presented were the headlines for the experiment days. They were presented as they were received through the RSS feed. No limitation was imposed on the number of words.
For this experiment, 5 conditions have been designed. Dur-ing each condition the robot interacted with the participants at three interaction distances: 70cm (D70), 1.2m (D120), and 2m (D200). These distances have been chosen as they correspond to the personal and social distances, as defined by Hall [20]. D120 and D200 correspond to the lower, and higher limit of the social distance.
One interaction is defined by a news being presented by the robot either by using auditory stimuli (reading the news out loud), visual stimuli (displaying the news on the tablet), or both auditory and visual stimuli (reading the news and displaying it on the tablet). Both the conditions and the interaction distances for each condition were selected in a random order.
When the robot presented the news by using visual stimuli, it either adapted the font of the text or not. In case of
Fig. 2. Eyes feature points
font adaptation, the font size was changed depending on the distance between the robot and the participant. The robot detected the face of the participant, and using depth information it computed the distance between its RGB-D sensor and the user. The unit of height of the viewport (vh) was used for the font size. The following font sizes were used: for distances less than 70 cm (D70) the font size was set to 4vh; for distances less than 1.2 m (D120) it was set to 5vh; while for distances greater than 1.2 m (D200) a font size of 6vh was used.
The robot was manually controlled by the experimenter. The five conditions are:
• Condition 1. Sound and No Visual Interface
• Condition 2. No Sound and Visual Interface with no font adaptation
• Condition 3. No Sound and Visual Interface with font adaptation
• Condition 4. Sound and Visual Interface with no font adaptation
• Condition 5. Sound and Visual Interface with font adaptation
III. DATA EXTRACTION AND ANALYSIS
In this section, the methods used to extract and analyze the data are described.
A. Blinking
To extract the blinks, the module first described in [34] was used. The module can be used both in real-time and for offline processing. It was designed to be used as a Robot Operating System (ROS) [35] module. It uses the Dlib toolkit [36] to detect the faces in the RGB data. Once the face was detected, the feature points of interest corresponding to the eye lids are localized (see Fig. 2). It requires an initialization period of 30 seconds in which the distance between the eye lids is stored in a buffer, after which the mean eye lid distance is computed for each eye. The initialization period is needed as there are multiple shapes and sizes of the eyes. Furthermore, the camera can be located at different distances from the user. The period can be set as a ROS parameter. For this experiment, the data was analyzed offline.
Once the mean eye lids distance is known, the blinks can be extracted from the RGB data. For each RGB frame the distance between the eye lids is computed. If the distance between the eye lids is less than 0.3 times the mean distance,
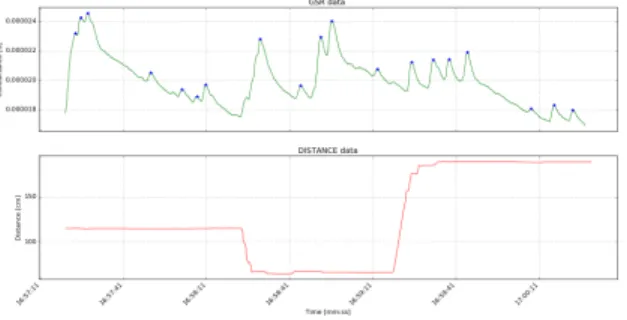
Fig. 3. GSR and distance data for one participant
then the eyes are considered to be closed. In case both eyes are closed for less than 300 ms, a blink has occurred.
For each detected blink a ROS custom message is pub-lished that contains the timestamp at which the blink oc-curred, and a constant value of 1. The following parameters were extracted and used for the statistical analysis: the total number of blinks, and the average blink rate (computed as the total number of blinks divided by the interaction duration and multiplied by 60 seconds).
B. GSR
For the GSR data, there are multiple parameters that can be used for analysis. Two parameters that are widely used are: the accumulative GSR [16] and the number of peaks. As the output of the sensor is the resistance, first the signal had to be converted to conductance.
The signal was first divided into the three interaction distances. Next, the algorithm presented in [16] was applied to extract the accumulative GSR (AccGSR) for each inter-action distance of each condition. First, each participant’s signal had to be normalized, by dividing the signal during one interaction by the mean value of all interactions of the participant (Eq (1) of [16]). The AccGSR was extracted from the normalized signal (Eq (2) in [16]). For the peaks, only the peaks that were at least 2% of the range of values were extracted.
A typical GSR signal during one of the conditions is shown in Fig. 3. The upper part of the figure presents the variation of the GSR signal and the detected peaks, while in the lower part of the figure is shown the interaction distance. C. Thermal data
The temperature variation across different regions of in-terest (ROI) provides good insight into the current internal state of a user. Therefore, the thermal data was used to extract these temperature variations. No open source face detector has been found for thermal images. As a result, a thermal face detector has been trained using the Dlib object detector, which was implemented in Python. The object detector is based on the algorithm presented in [37]. The detector was trained with 900 images from the Natural Visible and Infrared facial Expression Database (NVIE)[38]. Images with and without glasses have been used for training. To detect the ROIs, a feature point detector was trained for 11 feature points. The detector was trained using the
Fig. 4. Example of ROIs at three interaction distances
0 10 20 30 40 50 60
35.9
36.0
36.1
36.2
Temperature for forehead region in C1 and D70
Time [s]
T
emper
ature [ºC]
Fig. 5. Temperatature variation over time
Dlib shape predictor, which was implemented in Python. The shaper predictor, which uses regression trees, is based on the algorithm presented in [39]. A total number of 493 images from the NVIE dataset and from our previous experiments have been used for training the detector. The 11 feature points of interest (i.e., the middle of the eyebrows, the inner and outer corners of the eyes, the corners and the tip of the nose, and the corners of the mouth) were selected as these are sufficient to define six ROIs on the face (see Fig. 4): the entire face, the forehead, the left and right periorbital regions, the nose, and the perinasal region.
As the interaction in this experiment took place at three different distances, the ROIs were defined based on the distance between the inner corners of the eyes (eyes dist) as follows (see Fig. 4 for the ROIs at the three interaction distances):
1) the entire face: The face region starts from eyes dist above the eyebrows and ends at eyes dist below the mouth. It has a width equal to the distance between the outer corners of the eyes, and the height equal to the distance between the eyebrows and the mouth plus two times eyes dist.
2) the forehead region: width equal to the distance be-tween the middle of the eyebrows; and the height equal to the distance between the eyes and the nose. 3) the left, and right periorbital regions: both these regions
were defined as square regions around the inner corners of the eyes with the side equal to 1/3 of eyes dist. 4) the nose: a square region around the tip of the nose,
with the side equal to 1/3 of eyes dist
5) the perinasal region: was defined with a width equal to the distance between the corners of the mouth, and a height equal to the distance between one corner of the nose and the mouth at which a distance of 1/3 of eyes dist was added in order to include the nostrils too. Once the ROIs were defined, the mean temperature could
be extracted together with the timestamp at which it oc-curred. To remove short variations that could lead to false measurements, the data was re-sampled with linear interpola-tion with a rate of 10 Hz. Next, a moving average filter with a window of 20 samples (5 seconds) was applied. Finally, a least-square regression was applied in order to fit a linear model on our data. Figure 5 shows an example of filtered data for the forehead region at a close interaction distance. The result of the linear regression was overlapped on the temperature data (the model was fitted with r2= 0.779 and
p < 2.2e−16). In this case, the temperature increases with 0.00342◦C/s.
IV. RESULTS
As previously mentioned, the blinking and GSR data of all participants were used for the analysis, while for the thermal data, only the data from 9 participants was used. For all parameters the same type of analysis has been performed. First, it was checked to see if the dependent variables were normally distributed. For this purpose a Shapiro-Willks normality test was applied.
Only the AccGSR showed a normal distribution. There-fore, a mixed linear model analysis has been applied in order to determine if the condition, distance, interaction between condition and distance, stimulus type and font size are better predictors for the parameters than the mean value. The stimulus type could be auditory (C1), visual (C2, C3), or auditory/visual (C4, C5). The font size was either none (C1), fixed (C2, C4), or adapted (C3, C5). For the analysis based on the questionnaire results, a Kruskall-Wallis test was applied. Next, the significant results are going to be presented. A discussion based on there results is presented in Section V. A. Blinking
First, the analysis was performed on the total number of blinks. All models, except the distance model, proved to be better predictors for the number of blinks than the mean model.
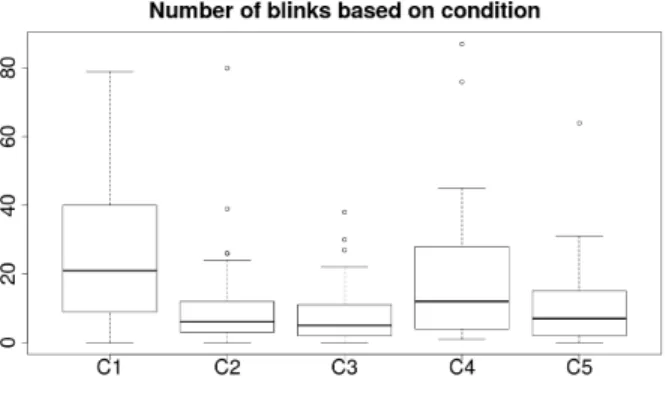
Next, we applied a general linear hypotheses post-hoc test on each of the models. For the condition model (F (1, 4) = 9.40, p < .0001) the following significant results were found: C2 - C1 (z = −4.55, p < 0.001), C3 - C1 (z = −5.43, p < 0.001), C5 - C1 (z = −4.7, p < 0.001), and C4 - C3 (z = 2.86, p = 0.034). A boxplot of the results is shown in Figure 6. During conditions C2, C3, and C5, the participants blinked significantly less than during conditions C1 and C4.
For the stimulus type model (F (1, 2) = 15.88, p < .0001) the significant differences were between auditory/visual auditory stimulus (z = −4.13, p < 0.001), and visual -auditory (z = −5.66, p < e−04) (see Figure 7). When presented with only the auditory stimuli, the participants blinked significantly more than when either auditory/visual or just visual stimuli were used.
For the font size model (F (1, 2) = 16.39, p < .0001) significant differences were found between none - adapted (z = 5.77, p < 0.001), and none - fixed (z = 4.05, p < 0.001) (see Figure 8). When no visual stimuli were shown,
Fig. 6. Number of blinks based on condition
Fig. 7. Number of blinks based on stimulus type
the participants blinked significantly more than when either visual stimuli with a fixed or an adapted font size were presented. The differences between the fixed size font and the adapted font approach significance (z = 2.10, p = 0.088) with more blinks occurring for the fixed font size than for the adapted font size.
For the interaction between condition and distance (F (1, 14) = 3.05, p < .001) we found significant results for: C2D70 - C1D70 (z = −4.11, p < 0.01), C3D70 - C1D70 (z = −4.3, p < 0.01) C5D70 - C1D70 (z = −4.0, p < 0.01). Next, we wanted to see if the number of blinks could be predicted based on the results of the questionnaires. The
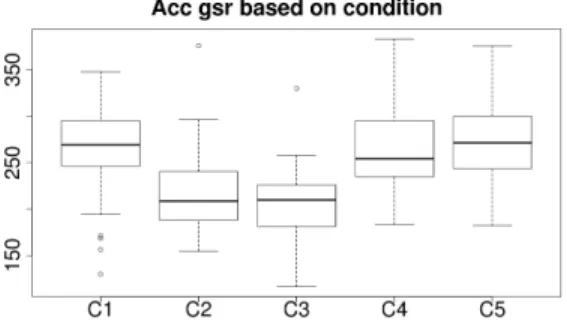
Fig. 9. Accumulative GSR based on condition
following significant results were found: 1) N (χ2= 15.83, p = 6.9e−05) 2) FFFS (χ2= 20.3, p = 6.5e−06)
3) visual AASP-Sens (χ2= 12.64, p = 0.0003)
For all three traits individuals with low scores blinked significantly more than individuals with high scores.
The same analysis applied on the blinking rate yielded the same significant factors.
B. GSR
The analysis was performed on the Accumulative GSR (AccGSR) and the number of peaks greater than 2% of the range of values.
Regarding the AccGSR, the condition, the stimulus and the interaction between condition and distance models proved to be better predictors than the mean model. A general linear hypotheses post-hoc test applied on the condition model (F (1, 4) = 15.64, p < .0001) yielded the following significant results (see Figure 9 for the boxplot of the results): C2 - C1 (z = −3.878, p < 0.001), C3 - C1 (z = −5.17, p < 1e−04), C4 - C2 (z = 4.324, p = 0.0001), C5 - C2 (z = 5.03, p < 1e−04), C4 - C3 (z = 5.626, p < 1e−04), C5 - C3 (z = 6.334, p < 1e−04). Significantly higher values for the AccGSR were found during conditions C1, C4, and C5 compared to conditions C2, and C3. When only visual stimuli were shown (conditions C2, and C3) the participants had lower levels of AccGSR than during the other conditions. Therefore, we can say that during these conditions their cognitive level was lower than when either auditory or a combination of auditory and visual stimuli were used [16].
For the stimulus model (F (1, 2) = 30.18, p < .0001), the following significant results were found (see Figure 10): visual - auditory (z = −5.19, p < 1e−04), visual - audi-tory/visual (z = −7.48, p < 1e−04). As with the conditions, when only visual stimuli were used the participants had a lower cognitive level than when either only auditory or a combination of auditory and visual stimuli were used.
For the interaction between the condition and distance, some of the most significant results are: C5D120 - C2D120 (z = 4.681, p < 0.001), C2D200 - C1D200 (z = −4.461, p < 0.01), C4D200 - C2D200 (z = 4.229, p < 0.01).
Fig. 10. Accumulative GSR based on stimulus type
Fig. 11. Accumulative GSR based on introversion - extraversion
An one-way Anova analysis was applied on the question-naire traits. The significant results are:
• Personality (F (1, 163) = 6.81, p = 0.009) (see also Figure 11)
• auditory AASP-SS (F (1, 163) = 7.92, p = 0.005)
• auditory AASP-SA (F (1, 163) = 4.87, p = 0.028)
• gender (F (1, 163) = 5.083, p = 0.025)
For the personality, introverted individuals showed an in-creased AccGSR than extraverted individuals. Low scores in auditory AASP-SS are associated with high values of AccGSR, while for auditory AASP-SA, high scores are associated with high AccGSR values. Our male participants showed significantly higher AccGSR values than females.
Next, the number of peaks were analyzed. None of the models were better predictors than the mean model. There-fore, we continued with the Kruskal-Wallis analysis based on the questionnaire traits.
The significant results are:
1) Personality (χ2= 13.52, p = 0.0002) 2) N (χ2= 3.90, p = 0.048)
3) FFFS (χ2= 4.4, p = 0.035)
4) auditory AASP-SS (χ2= 22.4, p = 2.3e−06)
5) visual AASP-SS (χ2= 11.04, p = 0.0008)
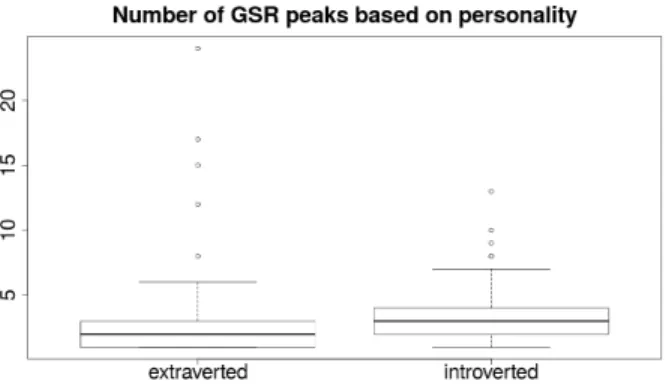
For the trait of FFFS, individuals with high scores had a significantly higher number of GSR peaks than individual with low scores. For personality, auditory and visual AASP-SS individuals with low scores showed a greater number of peaks than individuals with high scores. Figure 12 shows a boxplot of the number of GSR peaks based on personality.
Fig. 12. Number of GSR peaks based on personality
Fig. 13. Nose temperature variation based on FFFS score
C. Facial temperature variation
The rate of temperature change for the forehead, left, and right periorbital regions, nose, and face region was analyzed. None of the models proved to be better predictors for the temperature variation in either of the regions than the mean model. Thus, the Kruskal-Wallis test was performed on the questionnaire results. Significant results were found for only one trait, FFFS in the following regions:
1) forehead (χ2= 18.79, p = 1.45e−05)
2) nose (χ2= 9.63, p = 0.0019)
3) face (χ2= 10.88, p = 0.0009)
In all three regions, individuals with low FFFS scores showed a significantly higher increase in temperature than individual with high scores. Figure 13 shows a boxplot of the rate of change of nose temperature based on FFFS score.
V. DISCUSSION
The number of participants who took part in this study is low (11 for the blinking and GSR analysis, and 9 for the temperature variation analysis). In order to really confirm the obtained results a new study should be performed with more participants. The participants had to perform a non-stressing task (i.e., reading or listening to news). Thus, the lack of significant results for GSR and temperature variation when using the RST and EPQ results as factors can be explained. Both RST and EPQ are based on the assumption that personality has a physiological basis. All their factors
can be measured using physiological parameters and are more noticeable in stressing tasks.
In conditions C2, C3, C4, and C5 the participants had to read the news from the visual display (i.e., the touch-screen). The results that were found for the number of blinks depending on the condition are in accordance with the results in [14], where the authors found a lower blinking rate for a reading task (4.5 blinks/minute), than for a resting situation (17 blinks/minute). Regarding the stimulus type, in both significant comparisons (auditory - auditory/visual, and auditory - visual), when presenting an auditory stimulus the participants blinked significantly more, than when a visual or a combination of visual and auditory stimuli were presented. This result can also be associated with the results found by the authors of [14]. No significant differences were found in the number of blinks between the adaptive and the fixed font size. A tendency has been found for the adaptive font to lead to a lower number of blinks than the fixed size (p = 0.08). We believe that it was easier for the participants to read the font that was changed based on the interaction distance, than the fixed size one. The authors of [18], [19] found that exposure to sensory stimuli lead to a decrease of the blinking rate. Based on how individuals respond to different sensory stimuli (see Section II-B), individuals with low scores inAASP-Sens should not be affected by sensory stimuli. As a result their total number of blinks should not decrease. Our results show that participants with low scores in visual AASP-Sens blinked significantly more than participants with high scores, which is in accordance with the results of [18], [19].
For the GSR data, we found significant results for both parameters (i.e., AccGSR and peaks). A literature review showed that extraverted individuals are less aroused than in-troverted individuals. This means that in a non-stressing task introverts show greater electrodermal activity than extraverts [28]. Our results confirm this relationship.
The FFFS is responsible for the reactions towards aversive stimuli; therefore an individual with high score is more prepared to flee from a situation than an individual with low score. This means that high scores should be associated with a greater electrodermal activity and a lower increase in temperature [12]. Our results are in accordance with this theory. We found individuals with high scores having a significantly higher number of peaks and significantly lower increase in temperature than individuals with low scores.
To the best of our knowledge, no study has been performed in order to find the relationship between the sensory profile and GSR data, or the sensory profile and the facial temper-ature variation across different regions of interest. Further studies should be performed to investigate if the same results are obtained.
Even if the interaction between the robot and the partici-pants was limited, we believe that in a similar study without a robot the results would have been different.
VI. CONCLUSION ANDFUTURE WORK
In this paper, we presented a within participant study with 11 participants which was carried out to find out how different physiological parameters (i.e., blinking, GSR, facial temperature variation) varies in a non-stressing task (i.e., reading or listening to news) based on the type of stimuli pre-sented and the personality of the individuals. For this purpose five conditions have been developed in which the TIAGo robot used different ways of presenting the information to the participants (i.e., only auditory stimuli, only visual stimuli, both auditory and visual stimuli). During each condition, the interaction between the robot and the participants took place at three distances (70 cm, 1.2 m, and 2 m). We used different psychological questionnaires (i.e., RST-PQ, AASP, EPQ) to determine if the results of these questionnaires are a good predictor of the physiological parameters. Significant results were found for how much participants blinked based on how the information was presented. Additionally, significant results were found for the relationship between GSR and extraversion.
Some of our future work include the replication of the results found for the relationship between GSR and the sen-sory profile, and facial temperature variation and the sensen-sory profile. We plan to perform a study that uses a stressing task in order to find if there is any correlation between the physiological parameters (i.e., blinking, GSR, temperature variation, facial expression). Furthermore, we want to find the connection between the psychological questionnaires and the variation of GSR and facial temperature.
REFERENCES
[1] C. Liu and et.al., “Online affect detection and robot behavior adapta-tion for intervenadapta-tion of children with autism,” IEEE transacadapta-tions on robotics, 2008.
[2] M. Walters and et.al., “The influence of subjects’ personality traits on personal spatial zones in a human-robot interaction experiment,” in IEEE International Workshop on Robot and Human Interactive Communication, 2005.
[3] A. Tapus, C. Tapus, and M. J. Mataric, “Hands-off therapist robot behavior adaptation to user personality for post-stroke rehabilitation therapy,” in Robotics and Automation, 2007 IEEE International Con-ference on, 2007.
[4] N. Mitsunaga and et.al., “Robot behavior adaptation for hri based on policy gradient reinforcement learning,” Journal of the Robotics Society of Japan, 2006.
[5] R. Agrigoroaie and A. Tapus, “Influence of robot’s interaction style on performance in a stroop task,” 9th International Conference on Social Robotics, 2017.
[6] B. M. Appelhans and L. J. Luecken, “Heart rate variability as an index of regulated emotional responding.” Review of general psychology, vol. 10, no. 3, p. 229, 2006.
[7] R. Chauvin and et.al., “Contact-free respiration rate monitoring using a pan-tilt thermal camera for stationary bike telerehabilitation sessions,” IEEE Systems Journal, 2014.
[8] C. Barbosa-Pereira and et.al., “Remote monitoring of breathing dy-namics using infrared thermography,” 37th Annual International Conference of the IEEE Engineering in Medicine and Biology Society -EMBS, 2015.
[9] V. D. Nebylitsyn and J. A. Gray, Biological bases of individual behavior. Academic Press, 1972.
[10] Y. Nagai, L. H. Goldstein, H. D. Critchley, and P. B. Fenwick, “Influence of sympathetic autonomic arousal on cortical arousal: implications for a therapeutic behavioural intervention in epilepsy,” Epilepsy research, 2004.
[11] S. Ioannou, V. Gallese, and A. Merla, “Thermal infrared imaging in psychophysiology: Potentialities and limits,” Phychophysiology, 2014. [12] S. Ioannou, P. Morris, H. Mercer, M. Baker, V. Gallese, and V. Reddy, “Proximity and gaze influences facial temperature: a thermal infrared imaging study,” Frontiers in psychology, 2014.
[13] P. Ekman and et.al., Facial Action Coding System - Investigator’s Guide. Research Nexus, Salt Lake City - USA, 2002.
[14] A. R. Bentivoglio and et.al., “Analysis of blink rate patterns in normal subjects,” Movement disorders, 1997.
[15] Y. Tanaka and K. Yamaoka, “Blink activity and task difficulty,” Perceptual and Motor Skills, 1993.
[16] N. Nourbakhsh, Y. Wang, F. Chen, and R. A. Calvo, “Using galvanic skin response for cognitive load measurement in arithmetic and reading tasks,” in Proceedings of the 24th Australian Computer-Human Interaction Conference. ACM, 2012.
[17] C. L. Lisetti and F. Nasoz, “Using noninvasive wearable computers to recognize human emotions from physiological signals,” EURASIP Journal on Advances in Signal Processing, 2004.
[18] J. A. Stern, L. C. Walrath, and R. Goldstein, “The endogenous eyeblink,” Psychophysiology, 1984.
[19] K. Fukuda, “Eye blinks: new indices for the detection of deception,” International Journal of Psychophysiology, 2001.
[20] E. T. Hall, “The hidden dimension,” 1966.
[21] L. Goldberg, “An alternative ’description of personality’: the big-five factor structure,” in Journal of Personality and Social Psychology, 1990.
[22] H. J. Eysenck, “Dimensions of personality: 16, 5 or 3? - criteria for a taxonomic paradigm,” Personality and Individual Differences, 1991. [23] J. Gray and N. McNaughton, The neuropsychology of anxiety: An
enquiry into the functions of the septo-hippocampal system, 2nd ed. New York: Oxford University Press, 2000.
[24] W. Dunn, “The impact of sensory processing abilities on the daily lives of young children and their families: A conceptual model,” Infants and young children, 1997.
[25] J. Pages, L. Marchionni, and F. Ferro, “Tiago: the modular robot that adapts to different research needs,” International Workshop on Robot Modularity, IROS, 2016.
[26] H. J. Eysenck and S. B. G. Eysenck, Manual of the Eysenck Personality Questionnaire (junior and adult). Hodder and Stoughton, 1975. [27] H. Eysenck, “Psychophysiology and personality: Extraversion,
neuroti-cism and psychotineuroti-cism,” Physiological correlates of human behavior, vol. 3, pp. 13–30, 1983.
[28] R. M. Stelmack, The Psychophysiology of Extraversion and Neuroti-cism. Berlin, Heidelberg: Springer Berlin Heidelberg, 1981, pp. 38– 64.
[29] H. Eysenck, The biological basis of personality. Springfield, 1967. [30] H. Eysenck and S. Eysenck, Psychoticism as a Dimension of
Person-ality. Hodder and Stoughton, London, 1976.
[31] P. Corr and A. Cooper, “The reinforcement sensitivity theory of personality questionnaire: Development and validation.” Psychological Assessment, 2016.
[32] C. Brown and W. Dunn, “Adult/adolescent sensory profile: Self questionnaire,” Pearson Clinical, 2002.
[33] C. Brown, N. Tollefson, W. Dunn, R. Cromwell, and D. Filion, “The adult sensory profile: Measuring patterns of sensory processing,” American Journal of Occupational Therapy, 2001.
[34] R. Agrigoroaie and A. Tapus, “Contactless physiological data analysis for users quality of life improving by using a humanoid social robot,” in 19th Conference on Image Analysis and Processing, ICIAP 2017. Catania, Italy: Springer, 2017.
[35] M. Quigley and et.al., “Ros: an open-source robot operating system,” in ICRA Workshop on Open Source Software, vol. 3, 2009, p. 5. [36] D. King, “Dlib-ml: A machine learning toolkit,” in Journal of Machine
Learning Research, vol. 10, 2009, pp. 1755 – 1758.
[37] N. Dalal and B. Triggs, “Histograms of oriented gradients for human detection,” in Computer Vision and Pattern Recognition, 2005. CVPR 2005. IEEE Computer Society Conference on. IEEE, 2005. [38] S. Wang, Z. Liu, S. Lv, Y. Lv, G. Wu, P. Peng, F. Chen, and
X. Wang, “A natural visible and infrared facial expression database for expression recognition and emotion inference,” IEEE Transactions on Multimedia, 2010.
[39] V. Kazemi and J. Sullivan, “One millisecond face alignment with an ensemble of regression trees,” in Proceedings of the IEEE Conference on Computer Vision and Pattern Recognition, 2014.