HAL Id: hal-02382211
https://hal.archives-ouvertes.fr/hal-02382211
Submitted on 27 Nov 2019HAL is a multi-disciplinary open access archive for the deposit and dissemination of sci-entific research documents, whether they are pub-lished or not. The documents may come from teaching and research institutions in France or abroad, or from public or private research centers.
L’archive ouverte pluridisciplinaire HAL, est destinée au dépôt et à la diffusion de documents scientifiques de niveau recherche, publiés ou non, émanant des établissements d’enseignement et de recherche français ou étrangers, des laboratoires publics ou privés.
polytetrafluoroethylene surfaces in electrolyte solutions
Antun Barišić, Johannes Lützenkirchen, Grégory Lefèvre, Tajana Begović
To cite this version:
Antun Barišić, Johannes Lützenkirchen, Grégory Lefèvre, Tajana Begović. The influence of temperature on the charging of polytetrafluoroethylene surfaces in electrolyte solutions. Col-loids and Surfaces A: Physicochemical and Engineering Aspects, Elsevier, 2019, 579, pp.123616. �10.1016/j.colsurfa.2019.123616�. �hal-02382211�
The influence of temperature on the charging of
Polytetrafluoroethylene surfaces in electrolyte solutions
Antun Barišića
, Johannes Lützenkirchenb, Grégory Lefévrec, Tajana Begovića,*,
a
Department of Chemistry, Faculty of Science, University of Zagreb, Horvatovac 102A, HR-10000 Zagreb, Croatia
b
Institut für Nukleare Entsorgung, Karlsruher Institut für Technologie, P.O. Box 3640, 76021 Karlsruhe, Germany
c
PSL Research University, Chimie ParisTech — CNRS, Institut de Recherche de Chimie Paris, 75005, Paris, France
*Corresponding author: Tajana Begović, e-mail: [email protected]
Johannes Lützenkirchen, Antun Barišić, Grégory Lefévre, Tajana Begović
ABSTRACT
The surface properties of Polytetrafluoroethylene (PTFE) depend on the pH and the ionic strength of the electrolyte solution. The point of zero charge (pHpzc) and the isoelectric point (pHiep) of PTFE were found to be 2.9 and 3.2 at 25 °C, respectively. The electrophoretic mobility at pH > pHiep indicates that the PTFE particles are negatively charged in the neutral pH region. In absence of surface functional groups, this observation can be explained by the distribution of OH– and H+ ions between the PTFE interface and the remaining solution. A thermodynamic model of ion distribution and the temperature dependency of the electroneutrality points which enables evaluation of the thermodynamic parameters is proposed. The enthalpies of interfacial reactions were indirectly determined by measuring the temperature dependency of the electroneutrality points by potentiometric mass titration and streaming current measurements. It was found that the exchange of the H+ and OH– ions between the interfacial region and bulk of the solution is an endothermic reaction. The specific enthalpy of dilution of PTFE dispersions was found to be pH dependent, with the lowest value at pH ≈ 3, i.e. in the zero surface charge region.
KEYWORDS
Polytetrafluoroethylene (PTFE), ion distribution, electrical interfacial layer, enthalpy of interfacial reactions, point of zero charge, isoelectric point
1. INTRODUCTION
Hydrophobic materials, such as inert gases, hydrocarbon oils, ice, polytetrafluoroethylene (PTFE, Teflon ®) or diamond do not bear surface functional groups and therefore should neither chemically react with water molecules nor with ions from aqueous electrolyte solution. Due to their hydrophobicity water dipoles are repelled from the surfaces and orientation of water molecules becomes less random than in the bulk of the solution. The resulting ordering and the concomitant distribution of water molecules and ions in the vicinity of the surface cause the formation of an electrical interfacial layer (EIL) [1,2]. Due to their unexpected charging behavior, the interfacial properties of such inert hydrophobic materials in aqueous electrolyte solutions have been the subject of numerous experimental as well as theoretical investigations [3–7]. A number of experimental techniques, such as electrokinetic [4–9], surface tension [10] or bubble potential measurements [11,12], have been applied in order to evaluate surface properties and charge distribution at these inert material/aqueous solution interfaces. It was found for all hydrophobic materials that the electrophoretic mobility, and thus the net electrokinetic charge and even surface potentials are pH dependent. Furthermore the electroneutrality points of inert materials occur in the acidic region, around pH ≈ 3, which in turn means that below pH ≈ 3 the inert material/aqueous electrolyte solution interface is net positive, while above pH ≈ 3 the interface is net negative. The origin of the electrical charge of the inert material/aqueous electrolyte solution interface, and its pH dependency, have been the subject of numerous debates over the years and the issue is still not solved [1–4,10,13–17]. While several models of electrical charging of inert materials for ambient conditions were proposed [18], the purpose of this article is to apply a model to evaluate thermodynamic parameters for surface charging of inert materials. In this respect the enthalpy of surface reactions was directly determined by means of calorimetric experiments and indirectly by measuring the temperature dependency of some equilibrium properties. The indirect method for determination of reaction enthalpy includes the temperature dependency of some equilibrium properties. A suitable experimental quantity that provides the required information about surface equilibrium is the electroneutrality point. At the electroneutrality point, surface potential and surface charge density equal zero, so that the electrostatic contribution to the thermodynamic functions, i.e. Gibbs energy, enthalpy and entropy is absent.
In terms of surface reactions, the equilibrium state is represented through the thermodynamic equilibrium constants which are concealed in the values of the electroneutrality points i.e.
isoelectric point (IEP) and point of zero charge (PZC). Determination of accurate electroneutrality points is relevant to the evaluation of thermodynamic parameters and the development of models for processes which take place within the interfacial layer.
The standard method for the determination of the IEP of solid colloidal particles is electrophoresis [19,20]. Electrophoresis is an electrokinetic phenomenon in which electrically charged dispersed particles move relative to a fluid under the influence of an externally applied uniform electric field. If the mobility of the particles equals zero, the system is at the electrophoretic isoelectric point. The IEP of the same solid material but with different macroscopic dimensions or shapes i.e. crystal plane, plate or pellets can be obtained by streaming potential (or streaming current) measurements [20,21]. Streaming potential and streaming current are electrokinetic phenomena caused by an aqueous electrolyte solution that is driven by a pressure gradient through a channel or porous plug with charged walls. The measured value of the streaming potential (current) difference is related to the zeta potential of the charged surface.
A standard method for the determination of the PZC of solid colloid particles is potentiometric acid-base titration [22]. The PZC of colloid particles can also be obtained from the results of such titrations of aqueous electrolyte dispersions for at least two (better three) ionic strengths. If a sample does not contain acidic or basic contaminations potentiometric acid-base titration would yield the absolute charge related to the surface reactions of protons and hydroxide ions. In the case of contaminated samples relative surface charges are obtained. The results are highly sensitive to the accuracy of pH measurement, exact volume addition and preparation of solutions with precisely known concentration. Another applicable method for determination of the PZC is potentiometric mass titration. It was developed as a suitable tool for determination of the PZC and the surface charge density of metal oxide colloidal particles at different ionic strengths [22,23], and has several advantages compared to the acid-base titration. First, the procedure is simple, second the comparison with the blank titration is avoided and third the salt content of the dispersion remains constant. In such a titration, known portions of a solid powder are added to an aqueous electrolyte solution, and the pH of the equilibrated dispersion is measured. The pH gradually changes and approaches a constant
value, which (in the case of pure samples) equals the point of zero charge, pHpzc. This makes
determination of temperature dependency of pHpzc or pHeln simple [24]. Accordingly, this procedure allows the evaluation of the chemical (standard) part of thermodynamic quantities
evaluated from the temperature dependency of PZC of metal oxides [25–31] (Figure 1). Unlike inert materials, at metal oxide surfaces electrically charged and chemically reactive surface groups exist. The respective surface chemical reactions on these surfaces are commonly described by surface complexation models [32].
It was found that the PZC of metal oxides decreases as temperature increases. Slight changes in the temperature do not cause significant shifts in the pHpzc value. For measurable differences in pHpzc, temperature shifts of at least 5 K are recommended. At temperatures below 200°C a negative slope in pHpzc(T) is observed indicating that the process of surface protonation is exothermic. 2.8 2.9 3.0 3.1 3.2 3.3 3.4 3.5 6.0 6.5 7.0 7.5 8.0 8.5 9.0 9.5 10.0 NiO[26] Co3O4[26] Co(OH)2[26] Ni(OH)2[26] TiO2[30] Fe2O3[29] pH pzc 103 x K/T
Figure 1. Temperature dependency of pHpzc for various metal oxides as reported by Tewari (1976) [26], Preočanin (2002) [29] and Kallay (2003) [30].
Compared to this indirect approach, a direct method for evaluation of thermodynamic quantities is calorimetric titration. In order to examine the distribution of hydrogen and hydroxide ions in a calorimetric experiment the colloidal suspension can be titrated with acid or base. During such an experiment several surface reactions, as well as neutralization in the bulk of the solution, occur. It is not easy to separate the extents of the different reactions in a calorimetric vessel and to calculate the respective contributions to the measured heat, i.e. enthalpy change. If the calorimetry experiments are performed outside the electroneutrality region, the electrostatic contribution needs to be included [33]. Therefore, any calorimetric experiment should be carefully planned taking into account all possible reactions and processes.
The intention of this article is to investigate the reactions and processes within the interfacial layer of PTFE/aqueous electrolyte solutions with focus on temperature dependency. We propose a thermodynamic model for describing the accumulation of the potential determining ions (H+ and OH–) near the surface of the inert particles. The processes accompanying the dilution of a concentrated dispersion of chemically inert PTFE particles are additionally discussed. Thermodynamic parameters of the above mentioned processes are obtained indirectly and directly, from the temperature dependency of equilibrium parameters and from calorimetry, respectively. Electroneutrality points are reported in the temperature range from 10 °C to 50 °C by measuring the streaming current near flat PTFE planes as well as the pH-values of concentrated dispersion of purified PTFE colloidal particles. Additionally, calorimetric experiments involving the dilution of concentrated PTFE dispersions enable the evaluation of the electroneutrality point and yield insight into the energetic changes in the PTFE dispersion. The results are compared with the values obtained for surface reactions which take place at metal oxide colloidal particles.
2. THEORY: THERMODYNAMIC MODEL
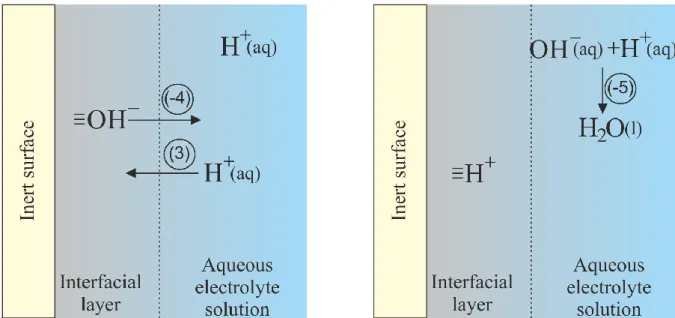
The ionic equilibrium within the EIL can be interpreted by the surface complexation model or by distribution/accumulation of potential determining ions between the interfacial layer and the bulk of the solution. At a metal oxide surface in aqueous environment interfacial functional groups exist and react with potential determining ions [32]. The surface charging of inert surfaces based on the accumulation of hydrogen (hydronium) and hydroxide ions at the
interface thus considers the distribution of H+ and OH– ions between the bulk of the solution
(aq) and the interfacial region (≡)
H (aq) ƒ H H
0
H r H H exp / ( ) ( ) ; Δ ( ) ( ) c F RT x K H a o o (1) OH (aq) ƒ OH OH
0
OH r OH OH exp / ( ) ( ) ; Δ ( ) ( ) c F RT x K H a o o (2)where K°(H+) and K°(OH–) denote the respective thermodynamic equilibrium constants. The
relative activities of interfacial H+ and OH–are expressed as amount (mole) fractions x(H+) and x(OH–). 0 denotes interfacial potential, i.e. the electrostatic potential affecting the state of interfacial H+ and OH– [34]. The relative activity of bulk H+ and OH– (ac(H+) and
ac(OH–)) are expressed in terms of molar concentrations In this special case, hydronium and
2
H O(l)ƒ H (aq) OH (aq)
2 w,bulk H OH H OH H O ( ) ( ) ( ) ( ) ( ) a a K a a a o ; Δw,bulkHo (3) as well as from self-ionization of interfacial water molecules
2 H O H OH ƒ 2 w,bulk H OH H OH H O ( ) ( ) ( ) ( ) ( ) a a K a a a o ; (4)
For the electrolyte solutions we are interested in the relative activity of water in the liquid phase and in the interfacial region is approximately 1. Due to different physical and chemical properties of water at inert hydrophobic surfaces the values of the thermodynamic equilibrium constants of bulk and interfacial water differ [35]. According to the literature [34], the value of the thermodynamic equilibrium constant based on concentration for ionization of bulk water at 25 ºC is Kw,bulk,o c1.006 10 14. The value based on amount fraction of H
+
and OH–
ions calculated using molar mass and density of water is equal to Kw,bulk,o x3.26 10 18. The
value of the interfacial thermodynamic equilibrium constant based on amount fraction of H+
and OH– ions, obtained from experimental surface potential and electrokinetic potential data
of the gas/water interface is Kw,int,o x 8.7 10 6. Consequently, the degree of interfacial water molecule dissociation is about 106 times higher than in the bulk of the solution [21].
Within the model the surface potential Ψ0 affecting the state of interfacial H+ and OH– ions can be related to bulk pH, the ratio of amount fractions of interfacial by H+ and OH– ions, and thermodynamic equilibrium constants of distribution reactions.
Electroneutrality of the interfacial layer surface is achieved if the interfacial amounts of H+ and OH– are equal, x
H x OH
, i.e. Ψ0 = 0. In the case of symmetrical counterion association, or even lack of counterion association, the electroneutrality point coincides with the IEP (i.e. = 0) and PZC (i.e. 0 = 0), so that pHeln = pHiep = pHpzc [32]. The electroneutrality point pHeln is determined by the corresponding equilibrium constant(s),eln w ,bulk, H OH ( ) 1 pH lg 2 ( ) c K K K o o (5)
The usually reported IEP and PZC, are standard parameters that characterize dispersed solid particles in aqueous electrolyte solutions, and affect the electrical surface properties such as adsorption of ions and colloidal stability. While the values of the thermodynamic equilibrium constants of surface reactions cannot be directly determined the electroneutrality points are relatively easily obtained. For example, at surface electroneutrality the mobility of particles in
an applied electrical field is equal to zero, the surface concentrations of positively and negatively charged ions within the interfacial region are equal.
By changing conditions in the colloidal dispersion, such as pH, ionic strength, concentration of colloid particles, temperature, changes within the interfacial layer occur. Variations in the distribution of potential determining ions (Eqs. 1 and 2), dissociation of water molecules (Eqs. 3 and 4) or reorientation of water molecules near the surface [36] changes the equilibrium state, and affect the electrical charge densities of the colloidal particles and the total interaction energy. Energy changes of the accompanying surface reactions are characterized by enthalpy changes, while the standard Gibbs energies of surface reactions are directly related to the corresponding intrinsic equilibrium constants:
r r r
ln
RT K G H T S
o o o o
(6) Combining equations (5) and (6) yields the electroneutrality point of inert material/aqueous electrolyte solutions: r r w,bulk r r w,bulk eln H OH H OH Δ ( ) Δ ( ) Δ Δ ( ) Δ ( ) Δ pH 2 ln10 2 ln10 H H H S S S RT R o o o o o o (7) Consequently, the chemical (standard) part of surface reactions enthalpies can be evaluated from the temperature dependency of the electroneutrality point:
eln r H r OH w d pH Δ ( ) Δ ( ) Δ d(1 / ) 2 ln10 H H H T R o o o (8)
The enthalpy change ΔrHo( ) ΔH rHo(OH) Δ wHo is related to the reaction
2
2H (aq) OHƒ HH O(l) (9)
which involves exchange of H+ and OH–between interfacial layer and bulk solution (Figure 2a) and ionization of a water molecule (Eq. 3) in solution (step 2 on Figure 2b):
Ionization of a water molecule and formation of H+ and OH– in aqueous bulk solution is exothermic (Δw,bulkHo≈ 56 kJ mol–1 [37]). The determination of the enthalpy concerning the exchange of H+ and OH– ions requires subtraction of Δw,bulkHo:
H (aq) OHƒ HOH (aq) ΔrH (overall) ΔrH ( ) ΔH rH (OH )
o o o
Figure 2. The overall reaction (Eq. 9) involves exchange of H+ (Eq. 1) and OH– (Eq. 2) ions between interfacial layer and bulk of the solution and dissociation (Eq. 3) of water molecule in the bulk of the aqueous electrolyte solution.
The temperature dependency of pHeln provides a difference in standard reaction enthalpies, but not individual values. Outside the electroneutrality region the surface is electrically
charged. The thermodynamic property rX (where X denotes G, H or S) must then be
expressed as the sum of the standard rXo and the electrostatic rXel parts
rX rX rXel
o
(11)
These electrostatic contributions are connected to the surface potential (0) by rGel zF0
(12)
where z is the change in the charge number due to interfacial reactions; for reactions (1) z
= +1, and for reaction (2) z = –1. The electrostatic contribution is related to the temperature
dependency of the surface potential as
0 rHel zF 0 zFT T (13)
While the standard part of the reaction enthalpy can be obtained from the temperature dependence of the electroneutrality point, the determination of the electrical part the temperature dependency requires the inner surface potential.
The reactions involving counter – ion association within the ion distribution approach for cations can be expressed as:
C (aq) ƒ C C
C r C C exp / ( ) ( ) ; Δ ( ) ( ) c F RT x K H a o o (14)and for anionsas: A (aq) ƒ A A
β
A r A A exp / ( ) ( ) ; Δ ( ) ( ) c F RT x K H a o o (15)Here Ko(C)and Ko(A)denote the corresponding thermodynamic equilibrium constants. The relative activities of the interfacial C+ and A– are expressed as amount (mole) fractions x(C+) and x(A–) and β is the interfacial potential at the so-called β-plane, that affects the state of
interfacial C+ and A–. The relative bulk activities of C+ and A– are expressed as their molar concentrations.
If the affinity of cations towards negatively charged interfacial entities is higher than that of the accompanying anions towards positively charged ones (preferential association of cations,
C A
( ) ( )
Ko Ko
), the IEP is shifted from the electroneutrality point pHeln to higher pH values, while the PZC is shifted to lower pH values, i.e. pHiep > pHeln > pHpzc [38]. For the preferential association of anions (KA KC
o o
) the shifts are in the opposite directions: pHpzp > pHeln > pHiep. PZC shifts are expected to be smaller than those in IEP [39]. A difference
between IEP and PZC (pHiep ≠ pHpzc) indicates unequal association of anions and cations. The
temperature dependency of the IEP and PZC in those cases contains finite but small electrostatic contribution.
As mentioned earlier, the heat measured in calorimetric experiments (during addition of acid or base) includes contributions from all surface and bulk reactions. Therefore, we designed a calorimetric experiment which only targeted the distribution of potential determining ions i.e. we measured the heat exchange due to dilution of concentrated colloidal PTFE dispersions. We performed an isothermal calorimetric experiment in which a small amount of concentrated dispersion is added to the aqueous electrolyte solution of the same pH and ionic
strength. The dilution of the colloidal dispersion of particles P from mass concentration γ1 to
mass concentration γ2 can be expressed by the following equation:
P(γ1) → P(γ2) ΔHdil (16)
Here ΔHdil is the enthalpy change for the dilution process, i.e. an extensive physical quantity
which depends on the size of the system. The extent of the dilution reaction is not easy to calculate for interfacial reactions. In order to obtain an intensive physical quality, the specific
enthalpy change Δhdil, the measured enthalpy change is divided by the mass of added PTFE
dil dil dil H H h m V (17)
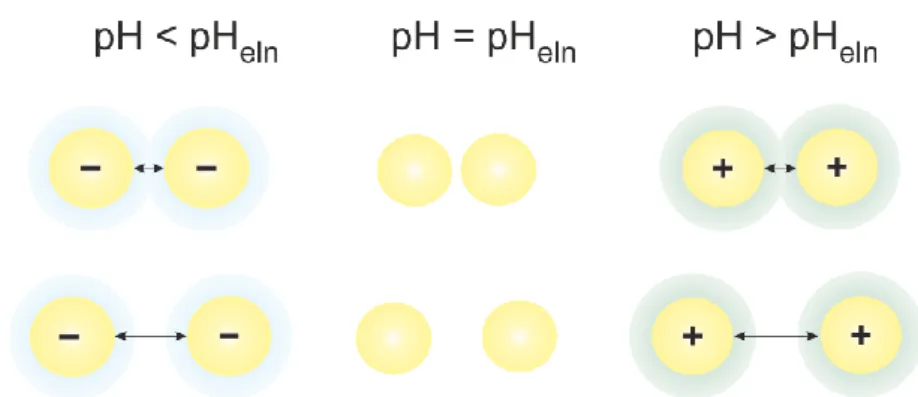
Figure 3. The process of dilution (Eq. 16) in the calorimetric experiment, at constant pH and
ionic strength, involves increasing the distance between two PTFE particles and consequently a reduction in electrostatic interactions of electrically charged particles (for pH ≠ pHeln)
During dilution several processes may take place. The state within the interfacial region stays the same because pH and ionic strange do not change. Due to dilution the particles are moved apart from each other and overall interaction decreases. Additionally, the overlap of the electrostatic interfacial layer reduces and solvation increases. The electrostatic interactions depend on the electrical properties of the particles (potential and charge densities) which are related to the pH and the ionic strength of the aqueous electrolyte solution, Figure 3. For pH = pHeln all electrical properties (0, 0 and ) and electrostatic interactions vanish. For pH ≠ pHeln repulsive electrostatic interactions occur, and the heat of dilution depends on pH and ionic strength.
3. MATERISLAS AND METHODES
Materials: All solutions and dispersions were prepared using MiliQ water. All measurements were made in the presence of argon gas to avoid carbon dioxide dissolving in water. The glass electrode was calibrated by using standard buffer solutions (Fluka) in the temperature range 10 °C – 50 °C.
Two samples were used, PTFE particles and flat PTFE sheets. PTFE particles were obtained from Polysciences Inc. (Microdispers-200), with a specified mean particle size of 200-300 nm. The specific surface area of the PTFE particles determined using the BET (Brunauer–
Emmett–Teller) method (Micromeritics, Gemini using liquid nitrogen) was s = 7.2 m2/g. The
PTFE particles were used for the temperature dependency of the PZC charge and in the calorimetry experiments.
Due to the hydrophobicity of PTFE particles a high mass dispersion of PTFE particles was prepared by dispersing dry PTFE in a small amount of 96% ethanol. Then water and NaCl were added and the dispersion was left until all detectable ethanol had evaporated.
The second PTFE sample was a flat conventional PTFE sheet from Dalau Ltd. The sample was cut into rectangular shape (20 mm x 10 mm) for streaming current measurements with the adjustable gap cell of the Surpass Apparatus Gen 1 type A (Anton Paar).
The temperature dependency of the PZC and IEP of PTFE materials was evaluated by the following experimental methods.
3.1. Potentiometric mass titration of PTFE
To determine the minimum amount of PTFE that buffers the pH of a dispersion, initially neutral, the pH was followed while adding PTFE powder to a stirred KCl 10–2 mol dm–3 solution. Due to the hydrophobicity of the PTFE, this protocol did not allow to incorporate the
whole amount of the solid. Yet at mass concentrations above nominal 100 g/dm3 the
dispersion reached the PZC condition. The PZC of PTFE dispersion is in the same pH region (pHpzc ≈ 3.5) as the pHiep [18]. The pH value of uncontaminated dispersions of high mass concentration, pH∞, corresponds to the pHpzc [23].
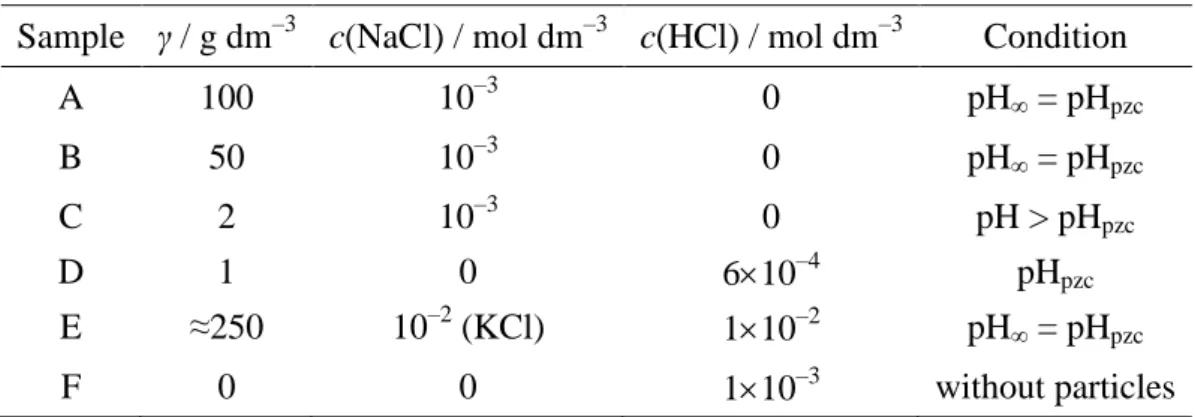
3.2. Temperature dependency of the point of zero charge
The pH values of concentrated PTFE dispersions (pH = pHpzc) were measured between 10 °C and 50 °C. The initial composition of the investigated PTFE dispersions is presented in Table 1. The mass concentrations of the PTFE dispersions were 100 g/dm3 (sample A), 50
g/dm3 (sample B) and 2 g/dm3 (samples C and D). The mass concentrations of samples A and
B were sufficient to reach pH. In the diluted PTFE dispersion of 2 g/dm3 (samples C) the pH was 5.75, so that the particles were negatively charged. In the second diluted PTFE dispersion (sample D) the pH value was adjusted to the PZC by addition of hydrochloric acid. Sample E
represents an initial solution of 20 cm3 KCl 1×10⁻² mol dm–3 to which a mass of 5g of PTFE
was added, leading to a concentration of ≈ 250 g/dm3, but due to the hydrophobicity of PTFE
not all PTFE particles incorporated in the suspension. Sample F contained only hydrochloric acid c(HCl) = 110–3 mol dm–3, without PTFE particles.
The systems were kept under an argon atmosphere and were thermostated ( 0.1 C). The pH was measured by a combined (glass - Ag/AgCl/KCl) electrode.
Table 1. The composition of the investigated PTFE dispersion samples at 25 °C.
Sample γ / g dm–3 c(NaCl) / mol dm–3 c(HCl) / mol dm–3 Condition
A 100 10–3 0 pH∞ = pHpzc B 50 10–3 0 pH∞ = pHpzc C 2 10–3 0 pH > pHpzc D 1 0 610–4 pHpzc E ≈250 10–2 (KCl) 110–2 pH∞ = pHpzc F 0 0 110–3 without particles
3.3. Temperature dependency of isoelectric point
Streaming current measurements were performed using the SurPass apparatus of Anton Paar.
Aqueous solutions were prepared with NaCl ( Ic = 1 × 10⁻³ mol dm–3), while NaOH and HCl
were used for pH control. The pH was measured by a combined (glass - Ag/AgCl/KCl) electrode. The electrode was calibrated using standard buffer solutions (Fluka Analytical) in the temperature range 10 °C – 50 °C. The aqueous solution was thermostated in a large vessel and temperature was monitored throughout the experiments in this vessel and within the streaming potential cell. Before gluing the two PTFE plates to the holders with double side
tape they were pretreated with the aqueous solution that contained 1 × 10⁻³ mol dm-3 NaCl and
NaOH as proposed by R. Šostar and coworkers [40]. The gap height was manually adjusted to approximately 100 μm.
3.4. Heat of dilution
Microcalorimetric experiments were performed by means of an isothermal titration calorimeter (CSC 4200 ITC, Calorimetry Sciences Corporation) at 25.0 °C. The calorimeter was calibrated electrically and chemically by means of the standard reaction of protonation of tris(hydroxymethyl)aminomethane (THAM) with HCl(aq). Calorimetric data were processed using Titration Bindworks and OriginPro 7.5. The calorimeter reaction cell was filled with
sodium chloride and hydrochloric acid solution of the appropriate pH values (V = 1.3 cm3, Ic
= 110–2 mol dm–3). The enthalpy changes were recorded upon stepwise, automatic additions
of the HCl/NaCl solution present in reaction cell, from a 250 L Hamilton syringe. All measurements were repeated three times.
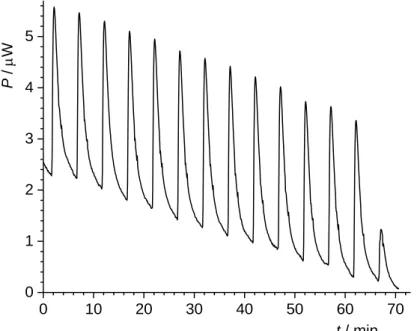
0 10 20 30 40 50 60 70 0 1 2 3 4 5 P / W t / min
Figure 4. Microcalorimetric titration of sodium chloride and hydrochloric acid solution (V =
1.3 mL) of the pH = 2.95 with 15 L PTFE dispersion (pH 2.95; γ = 1 g dm–3) at θ = 25 °C.
As an example, a thermogram obtained in a titration of an aqueous HCl/NaCl solution (pH = 2.95) with PTFE dispersion (γ = 1 g dm–3, pH = 2.95) at 25 °C is shown in Figure 4. The stepwise addition of PTFE dispersion resulted in exothermic enthalpy changes. Successive enthalpy changes are obtained by integration of the calorimetric peeks. The standard specific enthalpy for the dilution of the PTFE dispersion was calculated by a least squares linear regression analysis.
4. RESULTS AND DISCUSION 4.1. Mass titration
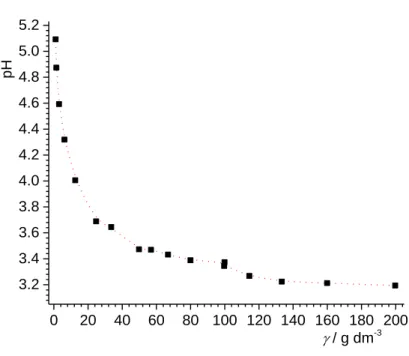
Potentiometric mass titrations of PTFE by continuous addition of solid particles to an aqueous
potassium chloride solution were continued until reaching a constant pH value (pH∞ →
pHpzc). Results are presented on Figure 5. The PZC of PTFE according to the results at 25 °C
0 20 40 60 80 100 120 140 160 180 200 3.2 3.4 3.6 3.8 4.0 4.2 4.4 4.6 4.8 5.0 5.2 pH / g dm-3
Figure 5. Mass titration of 1×10⁻² mol dm–3 potassium chloride aqueous solution with PTFE particles at 25°C.
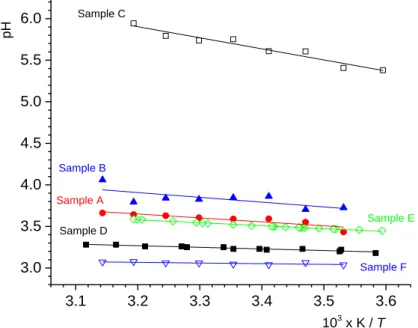
The temperature dependency of the PZC was determined by measuring the pH of the PTFE
dispersions of high mass concentrations (A: 100 g/dm3 and B: 50 g/dm3, E: 250 g/dm3) and
also of the diluted PTFE dispersion (D: 1 g/dm3)in which pH was adjusted to the pHpzc by HCl(aq). Additionally, the temperature dependencies of the pH in a pure PTFE dispersion (C:
1 g/dm3) and a blank solution of hydrochloric acid (F) without PTFE particles were measured.
For all measured systems the pH value is increasing with increasing temperature. More precisely, a linear dependency of pH on 1/T was found, Figure 6. From the slopes of the pHpzc(1/T) lines for suspensions A and B, eq. 8, the difference in standard enthalpies of distribution of hydronium and hydroxide ions between the PTFE interface and bulk aqueous sodium solution was obtained. In the PZC region the electrostatic contributions can be neglected. For the concentrated PTFE dispersions, ΔrH ( ) ΔH rH (OH )
o o
was found to be
(76 2) kJ mol–1, Table 2. The insignificant temperature dependence of pH-values of PTFE in
a dilute hydrochloric acid solution (blank sample F) indicates that measurement accuracy is about 3 kJ mol–1.
A slightly lower value (63 kJ mol–1) was obtained for PTFE particles in diluted dispersions but with pH adjusted to the PZC. Overall, the results indicate that reaction (eq. 10), i.e.
exchange of the H+ and OH– ions between the interfacial region and bulk of the solution is an
extremely endothermic reaction. In other worlds, it is necessary to invest about 72 kJ energy
3.1 3.2 3.3 3.4 3.5 3.6 3.0 3.5 4.0 4.5 5.0 5.5 6.0 Sample F Sample E Sample D Sample C Sample B pH 103 x K / T Sample A
Figure 6. Temperature dependency of pH for: (, sample A) 100 g/dm3 PTFE dispersion in 1 mmol dm–3 NaCl(aq); (▲, sample B) 50 g/dm3 PTFE dispersion in 1 mmol dm–3 NaCl(aq);
(□, sample C) 1 g/dm3
PTFE dispersion in 1 mmol dm–3 NaCl(aq); (■, sample D) 1 g/dm3 in
610–4 mol dm–3 HCl(aq); (◊, sample E) 250 g/dm3 PTFE dispersion in 10 mmol dm–3
KCl(aq) and (▽, sample F) 1 mmol dm–3 HCl(aq).
For the dilute PTFE dispersion, with pH > pHpzc (sample C) the pH change includes electrostatic contributions to the enthalpy of ion distribution. The slope of the pH(1/T) function yields an electrostatic contribution of around 33 kJ/mol, similar to what was previously reported for metal oxides, where the electrostatic contribution for two step
protonation of negatively charged hematite surface sites (≡FeO– + 2 H+(aq) → ≡FeOH2+) was
found to be 42 kJ mol–1 [35]. Two step protonation is also the process of the accumulation of
hydronium ions within the interfacial region of PTFE.
From the intercepts of the obtained pH(1/T) lines the standard values of differences in reaction entropy of hydronium and hydroxide ion distribution between the PTFE interface and the bulk of the aqueous sodium chloride solution were evaluated, Table 2. Assuming that enthalpy and entropy are constant within the examined temperature range the standard values of the reaction Gibbs energy were calculated and are included in Table 2.
Table 2. Thermodynamic parameters for hydronium and hydroxide ion distribution between
the PTFE interface and bulk of the aqueous sodium chloride solution described by eq.10.
Sample γ / g dm–3 pH25 / slope / K r 1 Δ (overall) kJ mol H o r 1 1 Δ (overall) J K mol S o r 1 Δ (overall) kJ mol G o A 100 3.6 –474 74 117 39 B 50 3.8 –576 78 139 36 C 1 5.7 –1333 107* 309* 15* D 1 3.2 –193 63 68 43 E ≈250 3.2 –353 69 100 40 F 0 3.0 –81 NA NA NA PTFE plate 0 2.9 - - - -
* Electrostatic contributions are included
There is a significant difference in the temperature dependency of PZC between PTFE particles (Figure 6) and metal oxide particles (Figure 1). For the metal oxides the pHpzc decreases with increase in temperature. Blesa [27] applied the surface dissociation model to the available thermodynamic data and concluded that entering of hydronium ions into the inner layer and reacting with negative surface groups is an energetically favorable reaction
with an enthalpy contribution ranging from –20 to –40 kJ mol–1 and an entropy contribution
between 20 and 100 J K–1 mol–1.
4.2. Electrokinetic measurements 2 3 4 5 6 7 8 9 10 11 12 -70 -60 -50 -40 -30 -20 -10 0 10 20 10°C 25°C 38°C / mV pH
Figure 7. Electrokinetic potential of PTFE plate in 1 mmol dm–3 sodium chloride aqueous solution at different temperatures. Average function (bold curves) with SD bars (transparent areas) are plotted.
Electrokinetic -potentials of PTFE plates in 1 mmol dm–3 NaCl(aq) at three different temperatures (10 °C, 25 °C and 38 °C) were obtained from measured streaming current. Figure 7. shows the average functions (with standard deviation bars) of at least three
measurements at the same temperature. The value of -potential depends on pH, crossing the
zero ( = 0) at the IEP. The average IEP of PTFE decreases as temperature increases, which is
opposite to the measured PZC temperature dependency for concentrated PTFE suspensions. Due to overlap, the uncertainty of the IEP determination at 25°C and 10°C does not allow to claim a significant temperature dependence of the IEP. However, the small magnitude in the variation of the IEP values is in agreement with PZC temperature dependence. The IEP of the PTFE plates used in these experiments at 25 °C is found to be 2.9 ± 0.4 (Table 2.).
Additional measurements of electrophoretic mobility and conductance for PTFE suspensions as a function of temperature (see SI) actually suggest a decrease of the IEP with decreasing temperature, which agrees with the mass titration results for the same system. Interestingly, differences between particles and flat samples have been observed for similar systems [41].
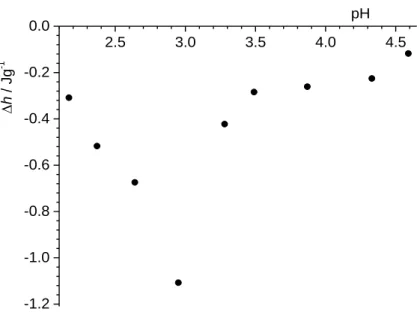
4.3. Calorimetry 2.5 3.0 3.5 4.0 4.5 -1.2 -1.0 -0.8 -0.6 -0.4 -0.2 0.0 h / Jg -1 pH
Figure 8. Specific enthalpy of dilution of PTFE dispersion; (γ = 1 g dm–3) with sodium chloride/hydrochloric acid aqueous solution of different pH-values at t = 25 °C.
Integration of the calorimetric peaks in the dilution series yields the successive enthalpy change. The specific enthalpies for the dilution of the PTFE dispersion as calculated by a least squares linear regression analysis of calorimetric titration data are shown in Figure 8. The specific enthalpy of dilution of PTFE dispersions was found to be pH dependent, with the lowest h value at pH ≈ 3, close to the measured PZC and IEP. During dilution of PTFE
dispersion several processes take place. Our calorimetric experiments were designed in a way that pH and ionic strength do not change throughout. After addition of 10 µL of PTFE suspension to the calorimetric vessel the mass concentration of PTFE decreases by a factor of 100. Due to dilution the PTFE particles are moved apart and the overall interactions between them diminishes. Since PTFE is highly hydrophobic, particles tend to aggregate. Dilution of electrically uncharged particles is energetically more unfavored (due to hydrophobicity) than for electrically charged particles (at pH ≠ pHeln). In the electroneutrality region (pH ≈ pHeln), the minimum of specific heat of dilution was observed, which can be explained by absence of repulsive electrostatic interactions between PTFE particles. By contrast, at pH ≠ pHeln particles are positively or negatively charged, and repulsive electrostatic interactions are noticeable. During the dilution of a charged PTFE suspension the interactions between particles decrease and less exothermic effects were measured. As a consequence of dilution the hydrophobic PTFE surface tends to reduce the contact with aqueous solution and a redistribution of potential-determining ions (H+ and OH–) takes place. The distribution of these ions affects the state within the interfacial region.
5. CONCLUSIONs
For PTFE surfaces the positions of pHiep and pHpzc were determined to be 2.9 and 3.2 at 25
°C, respectively. The electroneutrality point was additionally confirmed by a calorimetric experiment as a minimum of specific enthalpy change Δhdil. These values indicate that hydroxide ions can more easily accumulate in the EIL than hydronium ions. The observation is in accordance with other experiments made on inert/aqueous solution interfaces
[12,18,42,43]. A positive value of reaction Gibbs free energy for the exchange reaction of H+
and OH– ions between the interfacial layer and the bulk of the solution (Eq. 10) is in correspondence with the above conclusion showing that the reverse process (hydroxide ions
entering inert material layer and pushing hydronium ions in bulk of solution) is spontaneous. From the calculated reaction enthalpy and entropy, we can conclude that the reverse process is enthalpy driven.
Acknowledgments: The authors are grateful to the Laboratory for Precipitation
Processes, Ruđer Bošković Institute (Zagreb, Croatia) for BET measurements and the
Department of Textile Chemistry Technology and Ecology, Faculty of Textile Technology (University of Zagreb) where streaming current measurements were done.
Funding: This work has been supported by Croatian Science Foundation under the
Refrences:
[1] B. Winter, M. Faubel, R. Vácha, P. Jungwirth, Behavior of hydroxide at the
water/vapor interface, Chem. Phys. Lett. 474 (2009) 241–247. https://doi.org/10.1016/j.cplett.2009.04.053.
[2] A. Gray-Weale, Comment on ’Behaviour of Hydroxide at the water/vapor interface,
Chem. Phys. Lett. 241 (2009) 22–24. https://doi.org/10.1016/j.cplett.2009.09.008.
[3] J.K. Beattie, A.M. Djerdjev, W.G. Gregory, The surface of neat water is basic, Faraday
Discuss. 141 (2009) 9–30. https://doi.org/10.1039/B816684F.
[4] B. Winter, M. Faubel, R. Vácha, P. Jungwirth, Reply to comments on Frontiers Article
“Behavior of hydroxide at the water/vapor interface,” Chem. Phys. Lett. 481 (2009) 19–21. https://doi.org/10.1016/j.cplett.2009.09.010.
[5] S.H. Cho, J.Y. Kim, J.H. Chun, J.D. Kim, Ultrasonic formation of nanobubbles and
their zeta-potentials in aqueous electrolyte and surfactant solutions, Colloids Surfaces A Physicochem. Eng. Asp. 269 (2005) 28–34.
https://doi.org/10.1016/j.colsurfa.2005.06.063.
[6] R. Zimmermann, S. Dukhin, C. Werner, Electrokinetic measurements reveal interracial
charge at polymer films caused by simple electrolyte ions, J. Phys. Chem. B. 105 (2001) 8544–8549. https://doi.org/10.1021/jp004051u.
[7] L. Kong, J.K. Beattie, R.J. Hunter, Electroacoustic study of concentrated oil-in-water
emulsions, J. Colloid Interface Sci. 238 (2001) 70–79. https://doi.org/10.1006/jcis.2001.7464.
[8] S. Usui, T.W. Healy, Zeta potential of insoluble monolayer of long-chain alcohol at the
air - Aqueous solution interface, J. Colloid Interface Sci. 240 (2001) 127–132. https://doi.org/10.1006/jcis.2001.7661.
[9] M. Takahashi, ζ Potential of Microbubbles in Aqueous Solutions: Electrical Properties
of the Gas−Water Interface, J. Phys. Chem. B. 109 (2005) 21858–21864. https://doi.org/10.1021/jp0445270.
[10] J.K. Beattie, A.M. Djerdjev, The pristine oil/water interface: Surfactant-free hydroxide-charged emulsions, Angew. Chemie - Int. Ed. 43 (2004) 3568–3571.
https://doi.org/10.1002/anie.200453916.
[11] M. Manciu, E. Ruckenstein, Ions near the air/water interface: I. Compatibility of zeta potential and surface tension experiments, Colloids Surfaces A Physicochem. Eng. Asp. 400 (2012) 27–35. https://doi.org/10.1016/j.colsurfa.2012.02.038.
[12] T. Preočanin, F. Šupljika, M. Lovrak, J. Barun, N. Kallay, Bubbling potential as a measure of the charge of gas bubbles in aqueous environment, Colloids Surfaces A Physicochem. Eng. Asp. 443 (2014) 129.
https://doi.org/10.1016/j.colsurfa.2013.11.002.
[13] B.C. Garrett, Ions at the Air/Water Interface, Science 303 (2004) 1146–1147. https://doi.org/10.1126/science.1089801.
Soc. 130 (2008) 3915–3919. https://doi.org/10.1021/ja077205t.
[15] R. Vácha, V. Buch, A. Milet, J.P. Devlin, P. Jungwirth, Autoionization at the surface of neat water: is the top layer pH neutral, basic, or acidic?, Phys. Chem. Chem. Phys. 9 (2007) 4736. https://doi.org/10.1039/b704491g.
[16] P. Creux, J. Lachaise, A. Graciaa, J.K. Beattie, A.M. Djerdjev, Strong specific
hydroxide ion binding at the pristine oil/water and air/water interfaces, J. Phys. Chem. B. 113 (2009) 14146–14150. https://doi.org/10.1021/jp906978v.
[17] D. Ehre, E. Lavert, M. Lahav, I. Lubomirsky, Water freezes differently on positively and negatively charged surfaces of pyroelectric materials, Science 327 (2010) 672–675. https://doi.org/10.1126/science.1178085.
[18] T. Preočanin, A. Selmani, P. Lindqvist-Reis, F. Heberling, N. Kallay, J. Lützenkirchen, Surface charge at Teflon/aqueous solution of potassium chloride interfaces, Colloids Surfaces A Physicochem. Eng. Asp. 412 (2012) 120.
https://doi.org/10.1016/j.colsurfa.2012.07.025.
[19] C. Yang, T. Dabros, D. Li, J. Czarnecki, J.H. Masliyah, Measurement of the zeta potential of gas bubbles in aqueous solutions by microelectrophoresis method, J. Colloid Interface Sci. 243 (2001) 128–135. https://doi.org/10.1006/jcis.2001.7842. [20] R.J. Hunter, Zeta Potential in Colloid Science: Principles and Applications, Academic
Press Inc., London, 1981. https://doi.org/10.1016/C2013-0-07389-6.
[21] G. Werner, H. Körber, R. Zimmermann, S. Dukhin, H.J. Jacobasch, Extended
electrokinetic characterization of flat solid surfaces, J. Colloid Interface Sci. 208 (1998) 329–346. https://doi.org/10.1006/jcis.1998.5787.
[22] J. Lützenkirchen, T. Preočanin, D. Kovačević, V. Tomišić, L. Lövgren, N. Kallay, Potentiometric Titrations as a Tool for Surface Charge Determination, Croat. Chem. Acta. 85 (2012) 391–417. https://doi.org/10.5562/cca2062.
[23] J.N. Noh, J.A. Schwarz, Estimation of the Point of Zero Charge of Simple Oxides by Mass Titration, J. Colloid Interface Sci. 130 (1989) 157–164.
https://doi.org/10.1016/S0032-5910(99)00011-X.
[24] M. Barale, C. Mansour, F. Carrette, E.M. Pavageau, H. Catalette, G. Lefèvre, M. Fedoroff, G. Cote, Characterization of the surface charge of oxide particles of PWR primary water circuits from 5 to 320°C, J. Nucl. Mater. 381 (2008) 302–308. https://doi.org/10.1016/j.jnucmat.2008.09.003.
[25] N. Kallay, T. Preočanin, Application of „Mass Titration“ to Determination of Surface Charge of Metal Oxides, Croat. Chem. Acta. 71 (1998) 1117–1125.
[26] P.H. Tewari, A.B. Campbell, Temperature dependence of point of zero charge of cobalt and nickel oxides and hydroxides, J. Colloid Interface Sci. 55 (1976) 531–539.
https://doi.org/10.1016/0021-9797(76)90063-1.
[27] M.A. Blesa, A.J.G. Maroto, A.E. Regazzoni, Surface acidity of metal oxides immersed in water: A critical analysis of thermodynamic data, J. Colloid Interface Sci. 140 (1990) 287–290. https://doi.org/10.1016/0021-9797(90)90343-M.
[28] L.G.J. Fokkink, A. de Keizer, J. Lyklema, Temperature dependance of the electrical double layer on oxides: Rutile and hematite, J. Colloid Interface Sci. 127 (1989) 116–
131. https://doi.org/10.1016/0021-9797(89)90012-X.
[29] T. Preočanin, S. Krehula, N. Kallay, Enthalpy of surface reactions: Temperature dependency of pH of acidic or basic concentrated hematite suspension, Appl. Surf. Sci. 196 (2002) 392–400. https://doi.org/10.1016/S0169-4332(02)00077-6.
[30] N. Kallay, T. Madić, K. Kučej, T. Preočanin, Enthalpy of interfacial reactions at TiO2 aqueous interface, Colloids Surfaces A Physicochem. Eng. Asp. 230 (2003) 3.
https://doi.org/10.1016/j.colsurfa.2003.09.008.
[31] M. Kosmulski, Standard enthalpies of ion adsorption onto oxides from aqueous solutions and mixed solvents, Colloids Surfaces A Physicochem. Eng. Asp. 83 (1994) 237–243. https://doi.org/10.1016/0927-7757(93)02658-2.
[32] J. Lützenkirchen, Surface Complexation Modelling, 1st ed., Elsevier Ltd, London, 2006.
[33] N. Kallay, S. Žalac, Enthalpy of Interfacial Charging of Metal Oxide / Water systems, Croat. Chem. Acta. 67 (1994) 467.
[34] N. Kallay, T. Preočanin, A. Selmani, D. Kovačević, J. Lützenkirchen, H. Nakahara, O. Shibata, Thermodynamic model of charging the gas/water interface, J. Phys. Chem. C. 119 (2015) 997. https://doi.org/10.1021/jp507477u.
[35] N. Kallay, T. Preočanin, S. Žalac, H. Lewandowski, H.D. Narres, Electrostatic contribution to the enthalpy of charging at hematite/electrolyte interface, J. Colloid Interface Sci. 211 (1999) 401–407. https://doi.org/10.1006/jcis.1998.6003.
[36] S. Strazdaite, J. Versluis, H.J. Bakker, Water orientation at hydrophobic interfaces, J. Chem. Phys. 143 (2015). https://doi.org/10.1063/1.4929905.
[37] W.B. Holzapfel, Effect of pressure and temperature on the conductivity and ionic dissociation of water up to 100 kbar and 1000°C, J. Chem. Phys. 50 (1969) 4424–4428. https://doi.org/10.1063/1.1670914.
[38] N. Kallay, T. Preočanin, T. Ivšić, Determination of surface potentials from the electrode potentials of a single-crystal electrode, J. Colloid Interface Sci. 309 (2007) 21. https://doi.org/10.1016/j.jcis.2006.10.075.
[39] N. Kallay, T. Preočanin, D. Kovačević, J. Lützenkirchen, E. Chibowski, Electrostatic Potentials at Solid/Liquid Interfaces, Croat. Chem. Acta. 83 (2010) 357.
[40] R. Šoster, K. Stana-Kleinschek, M. Brumen, V. Ribitsch, Measurements of Zeta Potential of Poly(Tetrafluoroethylene) Foils, Mater. Sci. Forum. 480–481 (2005) 89.
https://doi.org/10.4028/www.scientific.net/MSF.480-481.89.
[41] A. Selmani, J. Lutzenkirchen, N. Kallay, T. Preočanin, Surface and zeta potentials of silver halide single crystals: pH-dependence in comparison to particle systems, J. Phys. Condens. Matter. 244104 (2014) 26. doi:10.1088/0953-8984/26/24/244104.
[42] J. Lützenkirchen, T. Preočanin, N. Kallay, A macroscopic water structure based model for describing charging phenomena at inert hydrophobic surfaces in aqueous electrolyte solutions, Phys. Chem. Chem. Phys. 10 (2008) 4946. https://doi.org/10.1039/b807395c. [43] N. Kallay, F. Šupljika, T. Preočanin, Charging of water at inert and hydrophobic
surfaces. Effect on interfacial properties of silver halides, Adsorption. 19 (2013) 211. https://doi.org/10.1007/s10450-012-9442-y.
![Figure 1. Temperature dependency of pH pzc for various metal oxides as reported by Tewari (1976) [26], Preočanin (2002) [29] and Kallay (2003) [30]](https://thumb-eu.123doks.com/thumbv2/123doknet/7771252.256948/6.892.237.660.399.729/figure-temperature-dependency-various-reported-tewari-preočanin-kallay.webp)