DESIGN OF NANOSTRUCTURED PHOTOCATALYSTS
FOR HYDROGEN PRODUCTION AND ENVIRONMENTAL
APPLICATION
Thèse
Cao Thang Dinh
Doctorat en génie chimique
Philosophiae doctor (Ph.D.)
Québec, Canada
© Cao Thang Dinh, 2014
iii
Résumé
Au cours des dernières décennies, la photocatalyse par les semiconducteurs a été intensivement étudiée pour une grande variété d'applications, y compris la production d'hydrogène à partir de la dissociation de l'eau et la décomposition des polluants dans l'air et l'eau. Actuellement, TiO2 est le matériau photocatalytique le plus largement étudié en
raison de son faible coût et ses propriétés physiques et chimiques exceptionnelles. Cependant, la rapide recombinaison électron-trou et son absorption dans la région de l’ultra-violet le rendent inefficace sous la lumière du soleil. Cette thèse vise à développer des photocatalyseurs efficaces à base de TiO2 en appliquant différentes stratégies telles que
le contrôle de la morphologie des nanoparticules de TiO2, le couplage du TiO2 avec des
métaux et d’autres semi-conducteurs, et l'optimisation de la porosité des photocatalyseurs. Nous avons mis au point une méthode de synthèse solvo-thermique pour produire des nanocristaux de TiO2 hautement cristallins de différentes formes, tel que rhombique,
sphérique, et sous forme de tige. Les nanocristaux TiO2 obtenus ont ensuite été décorés par
des clusters d'Ag de taille contrôlée pour former des hybrides Ag-TiO2 ayant une
performance photocatalytique supérieure à celle du photocatalyseur conventionnel Ag-TiO2-P25. Nous avons également développé une technique non-hydrolytique pour la
synthèse de nanodisques uniformes de TiO2 de diamètre contrôlé entre de 12 nm et 35 nm.
Ces nanodisques ont ensuite été utilisés comme blocs de construction pour la synthèse des photocatalyseurs multi-composants solubles dans l'eau à base de CdS-Titanate-Ni; ces derniers sont très actifs pour la production d'hydrogène grâce à leur absorption efficace de lumière visible et leur séparation efficace d’électrons et trous. Finalement, nous avons construit un assemblage tridimensionnel ordonné de nanosphères creuses de coquille mince de Au/TiO2, en utilisant les blocs de construction de nanodiques de titanate. Ces
photocatalyseurs présentent non seulement une surface spécifique très élevée, mais aussi un comportement photonique et une diffusion multiple de la lumière, ce qui améliore significativement l'absorption de la lumière visible. Ces nanosphères creuses de structure ordonnée tridimensionnelle présentent une activité photocatalytique induite par la lumière
iv
visible, étant plusieurs fois plus élevée que celle des nanopoudres conventionnelles d’Au/TiO2.
v
Abstract
Semiconductor photocatalysis has been intensively studied over the past decades for a wide variety of applications including hydrogen production from water splitting and decomposition of pollutants in air and water. Currently, TiO2 is the most widely
investigated photocatalytic material because of its low cost and outstanding physical and chemical properties. However, its fast electron-hole recombination and light absorption only in ultra-violet region make it inefficient working under sunlight. The goal of the research presented in this thesis is to design efficient TiO2 based photocatalysts by
applying various strategies encompassing controlling the morphology of TiO2 particles,
coupling TiO2 with metals, and other semiconductors and optimizing porosity of the
photocatalysts.
We have developed a solvothermal synthetic method for producing highly crystalline TiO2 nanocrystals with various shapes, such as rhombic, spherical, and bar. The obtained
TiO2 nanocrystals were then decorated with size-controlled Ag clusters to form Ag-TiO2
hybrids which exhibit superior photocatalytic performance in comparison to conventional Ag-TiO2-P25 photocatalyst. We have also developed a nonhydrolytic technique for the
synthesis of uniform titanate nanodisks with controlled diameter in the range of 12 nm to 35 nm. These nanodisks were then used as building blocks for the design of water-soluble CdS–Titanate–Ni multicomponent photocatalysts which are highly active for hydrogen generation due to their effective visible light absorption and efficient charge separation. Finally, we have constructed a three-dimensional ordered assembly of thin-shell Au/TiO2
hollow nanospheres from titanate nanodisk building blocks. The designed photocatalysts exhibit not only a very high specific surface area but also photonic behavior and multiple light scattering, which significantly enhances visible light absorption. As a result, Au/TiO2
hollow nanospheres with three-dimensional ordered structure exhibit a visible-light-driven photocatalytic activity that is several times higher than conventional Au/TiO2
vii
Table of Contents
Résumé ... iii
Abstract... v
Table of Contents ... vii
List of Figures... xiii
List of Schemes ... xxi
List of Abbreviations ... xxiii
Acknowledgements ... xxv
Dedication... xxvii
Preface ... xxix
Chapter 1: Introduction ... 1
1.1 Energy and environmental issues ... 3
1.2 Photocatalysis as the viable solution ... 4
1.3 Efficient photocatalyst challenges ... 5
1.4 Scope of the thesis ... 5
1.5 Organization of the thesis ... 6
Chapter 2: Titanium Dioxide Photocatalysis ... 9
2.1 Fundamentals of TiO2 photocatalysis ... 11
2.1.1 Heterogeneous photocatalysis ... 11
2.1.2 Desired properties of a photocatalyst ... 12
2.1.3 TiO2 as photocatalyst ... 15
2.2 Strategies toward efficient TiO2 based photocatalysts ... 18
2.2.1 Doping ... 18
2.2.1.1 Origins of visible light absorption in doped TiO2 ... 18
2.2.1.2 Factors influencing the performance of doped TiO2 ... 19
2.2.2 Loading with metals ... 21
2.2.2.1 Metal cocatalysts ... 21
2.2.2.2 Plasmonic metals ... 24
viii
2.2.3 Coupling semiconductors ... 29
2.2.3.1 TiO2 based heterojunctions ... 29
2.2.3.2 Factors influencing the photocatalytic performance of semiconductor composites ... 31
2.2.3.3 Synthesis of TiO2 based heterojunctions ... 32
2.2.4 Controlling particle morphology ... 33
2.2.4.1 Effect of particle size ... 33
2.2.4.2 Effect of particle shape ... 34
2.2.4.3 Size and shape controlled synthesis of TiO2 nanocrystals ... 36
2.2.5 Controlling porosity ... 38
2.2.5.1 Mesoporous structure ... 38
2.2.5.2 Ordered macroporous structure ... 39
2.2.5.3 Hollow sphere ... 41
2.2.6 Titanate nanosheet based photocatalysts ... 43
2.2.6.1 Layered titanate structure ... 43
2.2.6.2 Titanate nanosheets from layered titanate ... 44
2.2.6.2 Optical and electronic properties of titanate nanosheets ... 46
2.2.6.3 Design of photocatalysts from titanate nanosheets ... 46
2.3. Conclusions and further development ... 48
Chapter 3: Characterization Techniques ... 51
3.1 Electron microscopy ... 53
3.1.1 Transmission electron microscope ... 53
3.1.2 Scanning electron microscope ... 55
3.2 X-ray diffraction ... 56
3.3 X-ray photoemission spectroscopy ... 58
3.4 UV-Visible absorbance spectroscopy ... 58
3.5 Thermogravimetric analysis ... 60
3.6 Infrared spectroscopy ... 60
3.7 Atomic absorption spectroscopy ... 61
3.8 Zeta potential analysis ... 62
3.9 Nitrogen physisorption ... 63
3.10 Gas chromatography ... 65
Chapter 4: Shape-Controlled Synthesis of Highly Crystalline Titania Nanocrystals . 67 Résumé ... 69
ix
Abstract ... 71
4.1 Introduction ... 73
4.2 Results and discussion ... 74
4.2.1 Effects of surfactants and water content ... 74
4.2.2 Effects of precursor concentration ... 79
4.2.3 Effects of reaction temperature ... 81
4.3 Conclusions ... 83
4.4 Experimental ... 83
4.4.1 Synthesis ... 83
4.4.2 Characterization ... 84
4.5 Supporting information ... 85
Chapter 5: A New Route to Size and Population Control of Silver Clusters on Colloidal TiO2 Nanocrystals ... 91
Résumé ... 93
Abstract ... 95
5.1 Introduction ... 97
5.2 Results and discussion ... 98
5.2.1 Ag-TiO2 hybrid nanocrystals with different Ag cluster sizes ... 98
5.2.2 Ag-TiO2 hybrid nanocrystals with different Ag cluster populations ... 102
5.2.3 Optical properties of Ag-TiO2 hybrid nanocrystals ... 104
5.2.4 Photocatalytic activity ... 106
5.2.5 Ag-TiO2 hybrid nanocrystals with different shapes of TiO2 ... 107
5.3 Conclusions ... 107 5. 4 Experimental ... 108 5.4.1 Synthesis ... 108 5.4.2 Characterization ... 108 5.4.3 Photocatalytic tests ... 109 5.5. Supporting information ... 111
Chapter 6: Controlled Synthesis of Titanate Nanodisks as Versatile Building Blocks for the Design of Hybrid Nanostructures ... 117
Résumé ... 121
Abstract ... 123
6.1 Introduction ... 125
x
6.2.1 Size controlled synthesis of titanate nanodisks ... 126
6.2.2 Water-soluble titanate nanodisks ... 130
6.2.3 Titanate based mesoporous hybrids ... 130
6.2.4 Titanate based colloidal hybrids ... 132
6.3 Conclusions ... 135 6.4 Experimental ... 135 6.4.1 Synthesis ... 135 6.4.2 Characterization ... 137 6.4.3 Catalytic study ... 137 6.5 Supporting information ... 139
Chapter 7: Design of Multicomponent Photocatalysts for Hydrogen Production under Visible Light using Water-Soluble Titanate Nanodisks ... 145
Résumé ... 147
Abstract ... 149
7.1 Introduction ... 151
7.2 Results and discussion ... 153
7.2.1 Synthesis of water-soluble CdS–TND composites ... 153
7.2.2 Water-soluble property ... 154
7.2.3 Particle morphology and crystalline structure. ... 155
7.2.4 Composition, optical properties and porous structure. ... 158
7.2.5 Photocatalytic H2 production activity of CdS–TND composites using Ni cocatalysts ... 159
7.2.6 Role of Ni cocatalysts and proposed photocatalytic mechanism ... 162
7.2.7 Synthesis of other water-soluble metal sulfide–TND composites ... 165
7.3 Conclusions ... 166 7.4 Experimental ... 167 7.4.1 Synthesis ... 167 7.4.2 Characterization ... 168 7.4.3 Photocatalytic testing ... 168 7.5 Supporting information ... 170
Chapter 8: Three-Dimensional Ordered Assembly of Thin-Shell Au/TiO2 Hollow Nanospheres for Enhanced Visible-Light-Driven Photocatalysis ... 173
Résumé ... 177
Abstract ... 179
xi
8.2 Results and discussion ... 182
8.2.1 Morphology and crystallinity ... 182
8.2.2 Chemical states and porosity ... 185
8.2.3 Optical properties ... 186 8.2.4 Photocatalytic activity ... 187 8.3 Conclusions ... 189 8.4 Experimental ... 190 8.4.1 Synthesis ... 190 8.4.2 Characterization ... 191
8.4.3 Photocatalytic decomposition of isopropanol ... 192
8.5 Supporting information ... 193
Chapter 9: Conclusions and Future Outlook ... 197
9.1 General Conclusions ... 199
9.2 Future outlooks ... 201
References ... 205
xiii
List of Figures
Figure 1.1. Illustration of the applications of photocatalysis in water splitting to
produce hydrogen and in decomposition of organic pollutants. ... 4
Figure 2.1. Processes in semiconductor photocatalysis (A: electron acceptor; D:
electron donor). ... 11
Figure 2.2. Relationship between band structure of semiconductor and redox
potentials of water splitting. ... 14
Figure 2.3. Spectral distribution of the solar photon irradiation based on the Air
Mass 1.5 global data; the curve is based on the American Society for Testing and Materials Terrestrial Reference. ... 14
Figure 2.4. Representations of the TiO2 anatase, rutile, and brookite forms. ... 16
Figure 2.5. Three different transitions in TiO2: (1) transition from VB to CB; (2)
transition from VB to acceptor impurity level (Ea); and (3) transition
from donor impurity level (Ed) to CB. ... 18
Figure 2.6. (A) The UV–Vis absorption spectra of TiO2 (a) and Cr ion-doped TiO2
(b′–d′) photocatalysts prepared by an impregnation method. The amount of doped Cr ions (wt%): (a′) 0, (b′) 0.01, (c′) 0.1, (d′) 0.5 and (e′) 1. (0.1 wt% equals 4.9 µmol/g–TiO2) (B): The UV–Vis absorption spectra of
TiO2 (a) and Cr ion-implanted TiO2 photocatalysts (b–d). The amount
of implanted Cr ions (µmol/g); (a) 0, (b) 0.22, (c) 0.66 and (d) 1.3. ... 20
Figure 2.7. (A) Experimental optical-absorption spectra of TiO2-x Nx and TiO2
films. (B) UV-Vis absorption spectra of TiO2 (O2/Ar) and N–TiO2-(X)
thin films prepared on quartz substrates by a radio-frequency magnetron sputtering method. X (%): (a) 2, (b) 4, (c) 10 and (d) 40. ... 21
Figure 2.8. Schematic of Schottky barrier (left) and illustration of electron transfer
in metal-TiO2 hybrids under UV illumination (right). φm and φs are
work functions of metal and semiconductor, respectively. Ef is Femi
level. E0 is vacuum level. ... 22
Figure 2.9. A volcano-type relationship between the loading amount of metal and
the photocatalytic activity of the metal-loaded semiconductor photocatalyst. ... 23
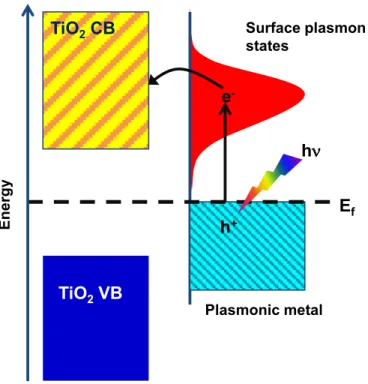
Figure 2.10. Mechanism of SPR-induced charge transfer between plasmonic metal
and TiO2. ... 26
Figure 2.11. Absorption spectra of gold nanorods of different aspect ratios. Each
curve has two peaks corresponding to the separate resonances in the transverse and longitudinal directions. The inset is the transmission electron microscopy (TEM) image of the gold nanorods. ... 26
xiv
Figure 2.13. Two structures of type II TiO2 based heterojunction. ... 30
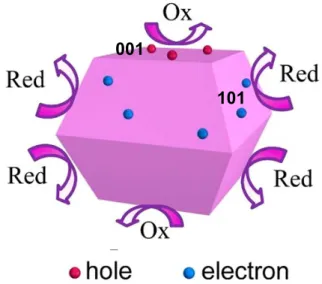
Figure 2.14. Schematic of atomic structure of {101}, {001}, and {010} faces. ... 35 Figure 2.15. Schematic of the spatial separation of redox sites on anatase crystals
with {101} and {001} facets. ... 36
Figure 2.16. Scanning electron microscopy (SEM) image of TiO2 at different
magnifications. ... 40
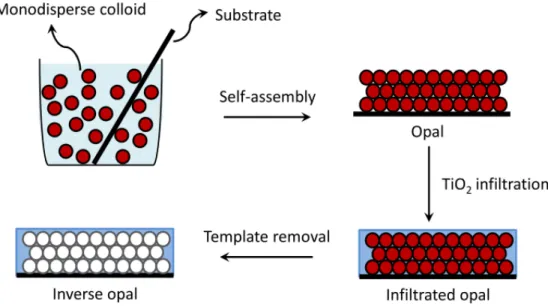
Figure 2.17. Schematics of the fabrication procedure of a TiO2 inverse opal. ... 41
Figure 2.18. Crystal structure of lepidochrosite-type layered titanate. ... 44 Figure 2.19. Schematic illustration of the exfoliation of a typical lepidocrocite-type
titanate into titanate nanosheets. ... 45
Figure 2.20. TEM (a) and AFM (c) images, and crystalline structure (b) of titanate
nanosheets exfoliated from Cs0.7Ti1.825□0.175O4. ... 45
Figure 2.21. UV–vis absorption spectra (left) and electronic band structures (right)
of exfoliated Ti0.91O20.36- nanosheets and anatase TiO2. ... 46
Figure 3.1. Scheme of electron-matter interactions arising from the impact of an
electron beam onto a specimen. The signals below the specimen is only observable if the thickness is small enough to allow some electrons to pass through. ... 54
Figure 3.2. (A) TEM image of Ag-TiO2 hybrid NCs (sample from Chapter 5), and
(B) SAED pattern of TiO2 NCs (data taken from Chapter 4). The arrows
in A indicate the positions of Ag clusters. ... 55
Figure 3.3. Schematic illustration of the Brag’s law. ... 57 Figure 3.4. (Left) a schematic of a transmission UV-vis measurement. An UV-vis
light source is passed through a transparent sample and the remaining light is analyzed by the detector. (Right) a schematic of a diffuse reflectance UV-vis measurement. The light source is focused on the sample, and a parabolic mirror is used to collect all diffusely scattered light, which is then focused on the detector. ... 60
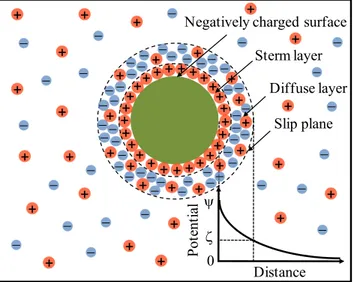
Figure 3.5. Scheme for the ionic distribution and electrical potential of a negatively
charged particle. ... 62
Figure 3.6. IUPAC classification of the physisorption isotherms. ... 64 Figure 4.1. TEM images of (A) the rhombic shapes obtained at TB/OA/OM =
1:4:6; (B) truncated rhombic shape obtained at TB/OA/OM = 1:5:5; (C) spherical shape obtained at TB/OA/OM = 1:6:4. Insets show high-magnification images of the corresponding shapes. (D) SAED pattern of truncated rhombic TiO2 nanoparticles. ... 75
Figure 4.2. TEM images of (A) dog-bone-shaped TiO2 obtained at TB/OA/OM =
xv TB/OA/OLA = 2:5:5. Insets are high-magnification images of the corresponding shapes (left, longitudinal view; right, cross view on panel B). ... 79
Figure 4.3. XRD patterns of (a) elongated rhombic-shaped TiO2, (b) truncated and
elongated rhombic-shaped TiO2, (c) dog-bone-shaped TiO2, and (d)
spherical-shaped TiO2. The XRD pattern of spherical-shaped TiO2 is
shown again for comparison. ... 80
Figure 4.4. TEM images of (A) elongated spherical TiO2 obtained at TB/OA/OM =
1.3:6:4; (B) dumbbell TiO2 obtained at TB/OA/OM = 1.6:6:4. ... 80
Figure 4.5. TEM images of (A) TiO2 nanobars obtained with TB/OA/OM = 1:6:4 at
140 °C; (B) TiO2 nanorods obtained with TB/OA/OM = 1:7:3 at 140
°C. ... 82
Figure S4.2. Low magnification TEM image of truncated rhombic shape TiO2
obtained at TB:OA:OM = 1:5:5. ... 85
Figure S4.2. XRD patterns (a) rhombic shape obtained at TB:OA:OM = 1:4:6; (b)
truncated rhombic shape obtained at TB:OA:OM = 1:5:5; (c) spherical shape obtained at TB:OA:OM = 1:6:4. ... 86
Figure S4.3. SAED patterns of (A) rhombic shaped TiO2 and (B) spherical shaped
TiO2. ... 86
Figure S4.4. TEM images of TiO2 NCs obtained with pure ethanol vapor (A), and
with pure water vapor (B) (TB:OA:OM = 1:6:4). ... 87
Figure S4.5. TEM images of rhombic shaped TiO2 obtained at low OA:OM ratios:
(A) TB:OA:OM = 1:2:8, and (B) TB:OA:OM = 1:3:7. ... 87
Figure S4.6. TEM images of TiO2 nanorods obtained at high OA:OM ratio: (A)
TB:OA:OM = 1:8:2, and (B) TB:OA:OM = 1:7:3. ... 87
Figure S4.7. TEM images of TiO2 NCs obtained using only one surfactant: (A) with
OM, TB:OM = 1:5, and (B) with OA, TB:OA = 1:5. ... 88
Figure S4.8. Low magnification TEM images of dog-bone shaped TiO2 obtained
with TB:OA:OM = 2:6:4 (A), and truncated and elongated rhombic TiO2 obtained with TB:OA:OM = 2:5:5 (B). ... 88
Figure S4.9. TEM images of elongated rhombic TiO2 obtained with TB:OA:OM =
2:4:6 (A), and TiO2 NCs obtained with TB:OA:OM = 4:6:4 (B). ... 88
Figure S4.10. TEM image of TiO2 NCs obtained with TB:OA:OM = 1:6:4 at 120 oC
(A), and high-magnification TEM image of TiO2 NCs obtained with
TB:OA:OM = 1:6:4 at 140 oC (B). ... 89
Figure S4.11. TEM images of TiO2 NCs obtained with (A) TB:OA:OM = 1:6:4 at 160 oC, and (B) TB:OA:OM = 1:8:2 at 140oC. ... 89
Figure 5.1. TEM image of hybrid Ag–TiO2 NCs (2.6 % mol Ag) synthesized from
xvi
OA, after UV irradiation (1 minute). Insets are size distribution of Ag clusters (upper) and photograph of the Ag–TiO2 NC solution before and
after irradiation (lower). ... 99
Figure 5.2. TEM image of hybrid Ag–TiO2 NCs synthesized from a solution of
TiO2 nanorods containing silver nitrate without additional OA, after UV
irradiation (40 min). Inset is size distribution of Ag clusters. ... 101
Figure 5.3. TEM images of the hybrid Ag–TiO2 NCs synthesized by additional OA
and irradiated for 40 min. (A) OA:TiO2 = 1:1, and (B) OA:TiO2 = 0.1:1. 103
Figure 5.4. UV–vis absorption spectra of the hybrid Ag–TiO2 NCs with different
sizes (A) synthesized without additional OA and irradiated for (a) 1 min, (b), 10 min, and (c) 40 min, and different populations of Ag clusters, (B) synthesized with (e) OA:TiO2 = 1:1, (d) OA:TiO2 = 0.1:1,
and (c) without OA (bottom panel), and photographs of the corresponding solutions (top panel). (f) UV–vis spectrum (bottom panel, B) and the photograph (top panel) of a hybrid Ag–TiO2 NC
solution after being exposed to visible light for 1 day. ... 105
Figure 5.5. (A) UV–vis absorption spectra of a methylene blue (MB) solution as a
function of irradiation time in the presence of hybrid Ag–TiO2 NCs
catalyst, and (B) comparison of the MB photodegradation using TiO2
nanorods, P25, Ag–P25, and hybrid Ag–TiO2 NCs as photocatalysts. ... 106
Figure S5.1. TEM images of the hybrid Ag-TiO2 NCs (2.6 % mol. Ag) synthesized
by irradiating a solution of TiO2 nanorods containing silver nitrate salt
for one minute with no additional OA. (A) low magnification image, and (B) image taken of a low particle concentration region on the grid, however, no separated Ag clusters were observed. ... 111
Figure S5.2. Ag 3d XPS spectrum (A) and XRD pattern (B) of the hybrid Ag-TiO2
NCs (2.6 % mol. Ag) synthesized by irradiating of TiO2 nanorods
solution containing silver nitrate salt for one minute with no additional OA. XRD pattern of the TiO2 nanorods is also included in B for
comparison. The two XRD patterns are similar, indicating a very small size of Ag clusters. ... 111
Figure S5.3. Low magnification TEM images of the hybrid Ag-TiO2 NCs
synthesized without additional OA and irradiated for 40 minutes (A), and hybrid Ag-TiO2 NCs synthesized without additional OA and
irradiated for 60 minutes (B). Inset in B is the photo of the mixture after reaction. The hybrid Ag-TiO2 NCs are precipitated and leave behind a
blank solution indicating that the Ag clusters existed only on TiO2 NC
surface. ... 112
Figure S5.4. TGA curves of the hybrid Ag-TiO2 NCs synthesized without additional
OA and irradiated for 40 and 60 minutes, as indicated. ... 112
Figure S5.5. TEM image of hybrid Ag-TiO2 NCs formed by adding a small amount
xvii irradiating a solution of TiO2 nanorods containing silver nitrate salt for
40 minutes, and irradiating for 60 minutes. ... 113
Figure S5.6. O1s XPS spectrum of the as-synthesized TiO2 NCs. ... 113
Figure S5.7. FTIR spectrum of as-made TiO2 NCs used as support for the deposition
of Ag clusters. ... 114
Figure S5.8. XRD pattern hybrid Ag-TiO2 NCs with Ag clusters of size between 5 to
10 nm (corresponding TEM image in Figure 5.3A). ... 114
Figure S5.9. TEM images of the hybrid Ag-TiO2 NCs synthesized by irradiating a
solution of TiO2 nanorods containing silver nitrate salt for one minute
with no additional OA before exposing to visible light (A), after exposing to visible light for one day (B), and after exposing to visible light for one day and re-exposing to UV light for 1 minute (C). ... 115
Figure S5.10. TEM images of hybrid Ag-TiO2 NCs synthesized using dog-bone
shaped TiO2 NCs with OA:TiO2 ratio of 1:1 (A), and rhombic TiO2
NCs without additional OA (B). The irradiation time was 1 minute. ... 115
Figure 6.1. a–c) TNDs in nonpolar solvents; a,b) TEM images of TNDs dispersed
in toluene, c) illustration of TND organization in toluene. d–f) TNDs in polar solvents; d,e) TEM images of TNDs precipitated in ethanol, f) illustration of TND organization in ethanol. ... 126
Figure 6.2. a,b) HRTEM images of TNDs laying perpendicular to the electron
beam. c,d) HRTEM images of TNDs laying parallel to the beam. e) SAED pattern of a single TND. f,g) XRD patterns of TNDs; f) wide-angle, g) low-angle. ... 127
Figure 6.3. a,b) TEM images of Ag2O–titanate hybrids synthesized from TNDs of
22 nm diameter (Ag2O-titanate-22) showing the presence of Ag2O NPs;
a) low magnification, b) high magnification and HRTEM (inset). Middle panel shows elemental mapping of Ag2O–titanate hybrids; scale
bars are 1μm. c) N2 physisorption isotherms of Ag2O–titanate hybrids
synthesized from TNDs with different particle diameters. d) Corresponding NLDFT pore size distributions (adsorption branch). ... 131
Figure 6.4. a,b) TEM images of TND-stabilized Ag NPs; a) low magnification, b)
high magnification and HRTEM image (inset). (c) UV–Vis absorption spectra of TND-stabilized and PVP-stabilized Ag NPs; inset shows photos of the corresponding NPs dispersed in water. (d) Variation of MB concentration vs. reaction time for TND-stabilized and PVP-stabilized NPs; inset shows plots of ln(Co/C) vs. reaction time showing
the fit using a first order reaction rate. ... 133
Table S1. Physicochemical parameters of the different mesoporous hybrids prepared using TNDs as building blocks. ... 139
Figure S6.1. Schematic illustration in perspective view of TND and projections of a
xviii
Figure S6.2. TGA and DTA curves (A) and N1s XPS spectrum (B) of as-synthesized
TNDs (OM-TND). ... 140
Figure S6.3. TEM image (A) and XRD pattern (B) of the anatase TiO2 particles
obtained in the absence of OM. ... 140
Figure S6.4. TEM images of 12 nm diameter TND obtained by using 6 g of BA (A),
35 nm diameter TND obtained by using 24 g of BA (B), and a mixture of anatase TiO2 and TNDs obtained by using 36 g of BA (C). Inset in C
is the SAED of anatase TiO2 particle (indicated by the arrow). ... 141
Figure S6.5. FTIR spectra of OM-TNDs, TEA-TNDs, and Ag+-TNDs (left). Photos
of OM-TNDs dispersed in toluene (a), TEA-TNDs dispersed in water (b), and Ag+-TNDs precipitated in water (c) (right). ... 141
Figure S6.6. Ag 3d XPS spectrum (A) and EDS spectrum (B) of mesoporous Ag2
O-titanate-22 hybrids. ... 142
Figure S6.7. Nitrogen sorption isotherms measured at -196 °C of mesoporous
Ag-titanate-10, CuxO-titanate-22, and CdS-titanate-35 hybrids. ... 142
Figure S6.8. TEM image of PVP-stabilized Ag NPs. ... 142 Figure S6.9. Variation of MB concentration against reaction time over
TND-stabilized Ag NPs in five consecutive reduction cycles. ... 143
Figure S6.10. TEM image (A) and XRD pattern (B) of Ag-TND hybrid colloids after
five consecutive reduction cycles. ... 143
Figure S6.11. TEM images of Cu-TND (A), Ni-TND (B), and AgBr-TND (C)
hybrids. ... 143
Figure 7.1. Photograph of the CdS–TND solution with a typical Tyndall effect of
colloidal solution (a). Zeta potential of CdS–TND composite colloidal solution measured at pH = 7.5 (b). ... 155
Figure 7.2. TEM images (a-f) and XRD patterns (g) of the CdS-TND composites
obtained at different stages of the growth process. ... 156
Figure 7.3. TEM (a, b), HRTEM (c-f) images and EDS elemental mapping data
(lower panel) of the CdS-TND composite obtained by 5 cycles of CdS growth. ... 157
Figure 7.4. EDS (a) and UV-vis spectra (b), photographs (inset in b) of the
CdS-TND composites obtained at different stages of the CdS growth process. Nitrogen sorption isotherms (c) measured at -196 °C for CdS-TND composites, obtained by 5 cycles of CdS growth, after the treatment with dilute HNO3 to replace the TEA cations with H+ and the
respective NLDFT pore size distribution calculated from the adsorption branch (d). ... 158
Figure 7.5. (a) Comparison of the activity of different photocatalysts in the
xix visible light illumination, with or without Ni cocatalyst. (b) The rate of H2 production on CdS-TND composites obtained through 5 cycles of
CdS growth (C5) loaded with different amounts of Ni under visible
light. Reaction conditions: 20 mg of catalyst; 20 vol% ethanol solution (70 mL); light source is a xenon lamp (300 W) with a cutoff filter (λ > 420 nm). ... 160
Figure 7.6. XPS spectrum of Ni 2p in the CdS-TND-Ni MPs after 2 hours of Ni2+
reduction in comparison to those of Ni in CdS-Ni sample and metallic Ni nanoparticles prepared by chemical reduction using NaBH4 as
reducing agent and Ni(NO3)2 as nickel precursor (a). Amount of H2 gas
produced as a function of irradiation time during the photoreduction of Ni2+ over CdS-TND composite (sample C5) and CdS (b). ... 163
Figure 7.7. Schematic illustration of the electron transfer in the photoreduction of
Ni2+ adsorbed on the surface of TNDs under visible light illumination and schematic illustration of the formation of Ni clusters on the surface of TND in the CdS-TND composites by visible light illumination (a). Schematic illustration of the charge transfer in CdS-TND-Ni MPs in the photocatalytic H2 production from water-ethanol mixture under visible
light. To simplify, only one particle of each component is shown, although a MP colloid is composed of several CdS NPs, TNDs and Ni clusters (b). ... 164
Figure 7.8. (a) TEM images of: ZnS-TND composites obtained by 3 cycles of ZnS
growth. (b) CuS-TND composite obtained by 4 cycles of CuS growth. (c) ZnS-CdS-TND composite obtained by 3 cycles of CdS growth and 2 cycles of ZnS growth. (d) UV-vis spectra of different metal sulfide-TND composites. Insets in a, b, c are photograph of the corresponding metal sulfide-TND composite solutions. ... 166
Figure S7.1. FTIR spectra of TEA-TND and CdS-TND composites obtained by 5
cycles of CdS growth. ... 170
Figure S7.2. TGA curves of CdS-TND composites obtained by 5 cycles of CdS
growth. ... 170
Figure S7.3. H2 production on CdS-TND composites obtained through 5 cycles of
CdS growth (C5) and CdS loaded with 2.8 wt% Ni coctalysts under
visible light monitored over 15 h. Each 3 h, the reaction system is bubbled with N2 for 15 min to remove the H2 inside. Reaction
conditions: 20 mg of catalyst; 20 vol% ethanol solution (70 mL); light source is a xenon lamp (300 W) with a cutoff filter (λ ≥ 420 nm). ... 171
Figure 8.1. Schematic illustration of the procedure for the design of Au/TiO2
-3DHNSs: 1) Uniform coating of TNDs on the surface of colloidal SiO2
NSs followed by the loading of AuCl4− to form TND-PEI-AuCl4−/SiO2;
2) assembly of TND-PEI-AuCl4−/SiO2 into a 3D ordered structure
followed by calcination to form a 3D ordered assembly of Au/TiO2/SiO2; 3) removal of SiO2 to obtain Au/TiO2-3DHNSs. ... 183
xx
Figure 8.2. A) TEM image of TND-PEI-AuCl4−/SiO2 NSs (inset shows a
high-magnification image); B) SEM image of 3D ordered assembly of Au/TiO2/SiO2; C, D) SEM images of Au/TiO2-3 DHNSs. ... 184
Figure 8.3. A) TEM; B) STEM; C, D) HRTEM images of Au/TiO2-3DHNSs. ... 185
Figure 8.4. A) UV/Vis diffuse reflectance spectra for Au/TiO2-3DHNSs and the
TiO2-3DHNSs reference sample. The shaded region in (A) shows the
presence of photonic stop band. B) UV/Vis absorption spectra of Au/TiO2-3DHNSs before and after being crushed. Inset in (B) shows a
digital photo of Au/TiO2-3DHNSs. ... 186
Figure 8.5. Amount of CO2 generated A) under visible light illumination (λ≥420
nm) for 10 h and B) under UV-light illumination (λ=365 nm) for 4 h using 1) Au/TiO2-P25, 2) Au/TiO2-3DHNSs, 3) crushed Au/TiO2
-3DHNSs, 4) Au/TiO2-HNSs (without the 3D ordered structure) as
photocatalysts. ... 188
Figure S8.1. TEM image of TND-PEI-AuCl4-/SiO2 NSs ... 193
Figure S8.2. SEM image (A) showing the uniform size, and TEM image (B)
showing the smooth surface of SiO2 NSs. ... 193
Figure S8.3. XRD pattern of Au/TiO2-3DHNS (A). EDS spectrum of Au/TiO2
-3DHNSs confirming the presence of Au and Ti in the sample (B). It can be also observed that the amount of silica remained in the sample is negligible. ... 193
Figure S8.4. Au 4f7/2 (A) and Ti 2p3/2 (B) XPS spectra of Au/TiO2-3DHNSs. ... 194
Figure S8.5. Nitrogen sorption isotherms of Au/TiO2-3DHNSs (A), and the
respective NLDFT pore size distribution calculated from the adsorption branch (B). ... 194
Figure S8.6. TEM images of Au/TiO2-3DHNSs crushed (A) and Au/TiO2-P25 (B)
showing the presence of Au nanoparticles with the size from 8-15 nm. (C) UV-vis absorption spectra of Au/TiO2-P25 in comparison to that of
Au/TiO2-3DHNSs crushed sample... 195
xxi
List of Schemes
Scheme 4.1. Schematic representation showing the shape evolution of TiO2 NCs as a
function of the OA/OM ratio. ... 78
Scheme 4.2. Schematic illustration of the overall formation and shape evolution of
TiO2 NCs. ... 82
Scheme S4.1. Schematic illustration of the synthesis of TiO2 nanocrystals with
different sizes and shapes. ... 85
Scheme 5.1. Formation of colloidal hybrid Ag–TiO2 NCs upon UV light irradiation .... 98
Scheme 7.1. Illustration of the synthesis of the water-soluble CdS–TND composite
colloids: (i) exchanging the TEA+–TND with Cd2+ to form Cd2+–TND;
(ii) reacting Cd2+–TND with TEA+ and thiourea at 70 °C to form
xxiii
List of Abbreviations
3D Three dimensional
3DHNSs Three dimensional ordered assembly of hollow nanospheres AAS Atomic absorption spectroscopy
BA Benzyl alcohol
BET Brunauer−Emmett−Teller
CB Conduction band
EDS Energy dispersive X-ray spectroscopy FTIR Fourier transform infrared spectroscopy GC Gas chromatography
HNS Hollow nanosphere
HRTEM High resolution transmission electron micoscopy IUPAC International Union of Pure and Applied Chemistry MB Methylene blue
MP Multicomponent photocatalyst
NC Nanocrystal
NLDFT Nonlocal density functional theory
NP Nanoparticle NS Nanosphere OA Oleic Acid OM Oleylamine PEI Poly(ethyleneimine) PVP Polyvinylpyrrolidone
xxiv
SAED Selected area electron diffraction SBSC Small band gap semiconductor SEM Scanning electron microscopy SI Supporting information SHE Standard hydrogen electrode SPR Surface plasmon resonance
STEM Scanning transmission electron microscopy TB Titanium butoxide
TBA Tetrabutyl ammonium TEA Tetraethyl ammonium
TEABH Tetraethylammonium borohydride TEM Transmission electron microscopy TEOS Tetraethylorthosilicate
TGA Thermogravimetric analysis TND Titanate nanodisk
UV Ultraviolet
UV-vis Ultraviolet-visible spectroscopy
VB Valence band
XPS X-ray photoelectron spectroscopy XRD X-ray diffraction
xxv
Acknowledgements
First and foremost, I would like to thank Prof. Trong On Do, my supervisor, for giving me the opportunity to study at Université Laval and for his tremendous support and guidance throughout my career. Prof. Do gave me incredible freedom to pursue my own interest, but he was always available to give valuable advice. I would also like to thank my co-supervisor, Prof. Freddy Kleitz, who gave me invaluable thoughtful insights, continual support and mentoring since I was a master student. I am deeply grateful towards both my supervisors for their always having faith in my ability, which has been critical to my enjoyment of these years at Laval.
The work described in this thesis would not have been possible without the assistance of many other people. I would like to thank Richard Janvier for his help with electron microscopes. Thanks to Alain Adnot for XPS analysis, and Jean Frenette for XRD measurement. Thanks to Yann Giroux for his great help with Autosorb instrument. I would like to thank Yongbeom Seo and Prof. Ryong Ryoo (KAIST, Korea) for access to high-resolution TEM microscopy data. I would also like to thank the Chemical Engineering department staff for all the technical and administrative assistance that I received during the entire period of my study.
I would like to express my acknowledgement and appreciation to all past and current members of the Do Research Groups. I have learnt a lot from them since I started as a graduate student. Dr. Thanh-Dinh Nguyen taught me a great deal about general synthesis of nanocrystals. Dr. Gia-Thanh Vuong, Dr. Bousselham Echchahed, and Driss Mrabet were instrumental in teaching me to handle various experimental setups and to organize the lab. Dr. Minh-Hao Pham and Vu Thi Thuy Duong, who have been also working on photocatalysis, have both been great friends and colleagues. I have enjoyed discussing with them and I know they have taught me much more than I have taught them. The younger students in our group have also been very helpful in many ways, and I wish them continued success: Chinh-Chien Nguyen, Mohammad Reza Gholipour, Mathieu St-Jean, and Amir Enferadi Kerenkan. I would also like to thank everyone in the Kleitz research group for scientific discussions, moral support and being a friend as well as a colleague. Especially, I
xxvi
would like thank Bouchoucha Meryem and Fanny Silencieux for their great help in completing the abstracts in French of the thesis.
I gratefully acknowledge the Fonds de recherche du Québec – Nature et technologies (FQNRT) for the scholarship, which allowed me to concentrate on science rather than fundraising. I would like to thank the Centre in Green Chemistry and Catalysis (CGCC) and the Department of Chemical Engineering at Université Laval for additional financial support. I would also like to acknowledge the Natural Science and Engineering Research Council of Canada (NSERC) for funding our research.
Now on a personal level, I would like to express my gratitude to all my Vietnamese friends in Université Laval who made my graduate school experience in Canada really joyful and memorable. Particularly, I would like to thank Dr. Vinh-Thang Hoang for his tremendous help from the first days I came to Université Laval. I would also like to thank Phuong-Trinh Nguyen for being my little sister, and for her great support and encouragement.
Finally, and most important of all, I would like to thank my families who have all contributed to my thesis work in their own special ways. Thanks to my parents and parents-in-law for their love, encouragement and support during all the years of my education. Thanks to my beloved wife, Hoang Yen, for being a great friend, colleague, and partner. Her endless love and companionship have been the best part of my life these past few years. Thank to my dearest son, Hoang Tung, a wonderful gift of my life. He has brought to my life so much joy and a great deal of happiness. I am truly indebted to all my family members. This thesis would not have been possible without their love and support. Thank you all from the bottom of my heart.
xxvii
Dedication
xxix
Preface
This thesis is composed of nine chapters. Five of them were written in the form of scientific papers that have been published. The candidate is the primary author of these papers.
Chapter 4 has been published as C. T. Dinh, T. D. Nguyen, F. Kleitz, T. O. Do, Shape-controlled synthesis of highly crystalline titania nanocrystals, ACS Nano, 2009, 3, 3737–3743.
Chapter 5 has been published as C. T. Dinh, T. D. Nguyen, F. Kleitz, T. O. Do, A new route to size and population control of silver clusters on colloidal TiO2 nanocrystals,
ACS Appl. Mater. Interfaces, 2011, 3, 2228-2234.
Chapter 6 has been published as C. T. Dinh, Y. Seo, T. D. Nguyen, F. Kleitz, T. O. Do, Controlled synthesis of titanate nanodisks as versatile building blocks for the design of hybrid nanostructures, Angew. Chem. Int. Ed., 2012, 51, 6608 –6612.
Chapter 7 has been published as C. T. Dinh, M. H. Pham, Y. Seo, F. Kleitz, T. O. Do, Design of multicomponent photocatalysts for hydrogen production under visible light using water-soluble titanate nanodisks, Nanoscale, 2014, 6, 4819-4829.
Chapter 8 has been published as C. T. Dinh, Y. Hoang, F. Kleitz, T. O. Do, Three-dimensional ordered assembly of thin-shell Au/TiO2 hollow nanospheres for enhanced
visible-light-driven photocatalysis, Angew. Chem. Int. Ed., 2014, 53, 6618-6623.
In these works, the candidate designed and performed all of the experiments with the supervision of Prof. Trong On Do and Prof. Freddy Kleitz, and the help from other coauthors. The high resolution TEM data was taken by Yongbeom Seo who was also coauthor or acknowledged. The candidate collected the data and wrote the first drafts of all manuscripts. All the authors revised the manuscripts prior to publication.
1
Chapter 1:
Introduction
In this chapter, the energy and environmental problems facing our world today and photocatalysis as a potential solution to these problems are discussed. The scope and organization of this thesis are also detailed.
3 1.1 Energy and environmental issues
The prospect of future energy shortages is a major global challenge that calls for immediate attention. The world energy demand continues to increase due to population and economic growth in many parts of the world. Estimates indicate that the rate of worldwide energy consumption reached 15 terawatts in 2008 and is expected to nearly double by 2050.1 Today, our major energy resources still originate from fossil fuels, such as coal, oil
and natural gas. However, both oil and natural gas will run out in the foreseeable future making a fossil energy based society impossible in a longer time perspective. In addition, the combustion of these fossil fuels has emitted a number of greenhouse gases and pollutants causing global climate change. Finding renewable, clean and carbon-neutral alternative energy resources is thus urgently needed.2,3
Among various available renewable energy resources, solar energy is by far the most abundant one, which could meet current and future human energy demand. The total solar energy irradiation on the earth is about 120000 terawatts a year. Harnessing less than 0.02% of the solar energy is therefore sufficient to total human energy demand today. There is thus a growing desire to develop effective strategies for direct harvest and conversion of solar energy into usable energy format.4,5 There are three critical challenges that must be addressed in making use of solar energy, which include solar energy harvest, conversion, and storage. Currently, the most popular way to use solar energy is through photovoltaic cells, which could directly convert solar energy into electricity. This approach effectively addresses the problems of solar energy harvest and conversion. However, it does not address the problem of energy storage. This is because the generated electricity must be used immediately or stored in secondary devices, such as capacitors and batteries which are also very challenging.4 Developing alternative methods for the conversion of
solar energy into easily storable and transportable fuels such as hydrogen or other energetic organic species is therefore highly desired.
Along with the energy challenges, environmental pollution has also become a major threat to the lives of humans nowadays.6-10 Persistent organic chemicals are present as
pollutants in wastewater effluent from industrial manufacturers and normal households, and in landfill leachates. Pollutants emitted from these various sources pose a severe
4
ecological problem as the bio-degradation of these pollutants is often very slow.11 Thus,
the development of advanced physicochemical and eco-friendly processes for destroying these pollutants became an imperative task. In addition, volatile organic compounds are among the most abundant chemical pollutants in the indoor air that we breathe. Millions of people are currently suffering from the consequences of poor indoor air quality.8,10,12
Innovative technologies for the quick and economical removal of volatile organic compounds from indoor air are also urgently needed.
1.2 Photocatalysis as the viable solution
Among various strategies toward a green earth and clean, renewable, and scalable energy project, semiconductor photocatalysis has emerged as one of the most promising technologies because it allows a direct use of sunlight to produce hydrogen fuel from water based on water-splitting devices and to decompose a wide range of hazardous substances (Figure 1.1).2,3,13-20 In principle, semiconductors can be excited by light with enough
energy to generate electron-hole pair which can drive a variety of redox reactions. Initial interest in semiconductor photocatalysis was prompted by Fujishima and Honda’s 1972 discovery that water could be split into hydrogen and oxygen upon illuminating a TiO2
based electrochemical cell.21 Since then, the semiconductor photocatalyst assisted
Figure 1.1. Illustration of the applications of photocatalysis in water splitting to produce hydrogen
and in decomposition of organic pollutants.
e -h+
hν
Valence band Conduction band Splitting WaterOrganic pollutants Decomposition CO2+ H2O Hydrogen
5 solar water splitting has attracted considerable attention throughout the scientific community due to its significant potential to resolve the energy issue. It also soon became apparent that novel redox reactions of organic and other inorganic substrates could also be induced by band gap irradiation of several semiconductor particles. Semiconductor photocatalysis has been demonstrated as an effective tool for environmental decontamination for a large variety of organics, viruses, bacteria, algae, and cancer cells, which can be totally degraded and mineralized to CO2, H2O, and harmless inorganic
anions.22-25
1.3 Efficient photocatalyst challenges
Although the semiconductor photocatalysis has been studied for a long time, its practical application is very limited and mainly related to environmental remediation. The main reason is the lack of a semiconductor that is capable of harvesting and converting the sunlight into chemical energy efficiently.17,26 In general, photocatalysis involves three
processes: the excitation, bulk diffusion and surface transfer of photoinduced charge carriers. Thus, an efficient photocatalyst must satisfy several critical requirements related to its semiconducting and chemical properties, its crystalline structure and surface characteristics.26 However, there are always inherent deficiencies of the semiconductors, and currently there is no single component that can address all of these requirements. Several semiconductors such as silicon or metal sulfides, which can harvest the sunlight effectively, are either unstable or unable to drive the desired redox reactions. In contrast, many metal oxide semiconductors, which are chemically and photochemically stable and exhibit strong redox potential, cannot absorb sunlight efficiently. Significant challenges remain in developing a sunlight driven photocatalyst with high efficiency and chemical stability.27-29
1.4 Scope of the thesis
Currently, titania is the most widely explored photocatalytic material largely due to its low cost, high chemical stability and relatively high catalytic efficiency.30-32 However, the large band gap (>3.0 eV) of TiO2 make it inefficient for sunlight utilization.33,34 Considerable
6
on three strategies: (1) improving sunlight absorption; (2) improving charge separation; and (3) optimizing surface properties.30,34,35 The first strategy can be achieved by: (i)
chemical doping of TiO2 with metal and non-metal elements;36,37 (ii) coupling TiO2 with
dyes, small band gap semiconductors or plasmonic metal nanoparticles (NPs);38,39 and (iii)
designing TiO2 structure with photonic effects.40-42 The remaining two strategies can be
accomplished by: (i) controlling TiO2 particle morphology and porosity;43-46 and (ii)
coupling TiO2 with metal cocatalysts.47,48 Although these strategies have been widely used
to enhance the photocatalytic activity of TiO2, they are usually achieved separately. Very
little synthetic methods have been capable of integrating these strategies to obtain high performance multifunctional photocatalysts.
The focus of our research is to design efficient TiO2 based photocatalysts for
hydrogen production and degradation of organic pollutants. Our approach is to develop new methods for the synthesis of TiO2 based photocatalysts on the basis of combining the
strategies for improving photocatalytic performance of TiO2 as mentioned above. We
synthesize titanium oxide nanocrystals (NCs) with controlled shape and size as the building blocks for the construction of the desired photocatalysts. These titanium oxide NCs are combined with metal NPs, small band gap semiconductors, and plasmonic metal in such a way that the sunlight absorption, charge separation, and surface area are significantly enhanced.
1.5 Organization of the thesis
This short introduction is followed by Chapter 2, which first introduces briefly the fundamentals of heterogenous photocatalysis, and then mainly focuses on reviewing various strategies for improving the photocatalytic activity of TiO2. The reasons behind the
photocatalytic activity improvement using these strategies are discussed along with the key factors that influence their efficiency. The discussion in this chapter summarizes the major proposed mechanisms and lays the groundwork for more rigorous investigation in the chapters to follow.
In Chapter 3, the characterization techniques employed throughout the thesis are described. We revised the fundamentals of each method and the information that can be extracted from them.
7 In Chapter 4, we report a new approach based on a solvothermal technique for the tailored synthesis of TiO2 NCs with controlled shapes (e.g., rhombic, truncated rhombic,
spherical, dog-bone, truncated and elongated rhombic, and bar). The key features of this approach are the use of water vapor to accelerate the hydrolysis of titania precursor and the use of both oleic acid and oleylamine as two distinct capping surfactants to control the growth of TiO2 crystals. We show that the presence of an appropriate amount of water
vapor along with the desired oleic acid/oleylamine molar ratio plays a crucial role in controlling size and shape of TiO2 NCs.
In Chapter 5, we use the TiO2 NCs developed in Chapter 4 for the design of colloidal
hybrid Ag-TiO2 NCs in which Ag clusters are uniformly deposited on the surface of each
individual TiO2 NC. The central feature of our approach is the use of surfactant-capped
TiO2 NCs with different degrees of surface coverage as a nanosupport, in combination with
a photodeposition technique. We show that the population of Ag clusters on each TiO2 NC
can be controlled by tuning the amount of oleic surfactant adsorbed on TiO2 surface, while
the size of each Ag cluster may be altered simply by varying irradiation time.
In Chapter 6, we report the synthesis of highly uniform colloidal titanate nanosheets exhibiting a plate-like shape, denoted as titanate nanodisks (TNDs), with exceptional size control (12–35 nm). We demonstrate that these new TNDs can serve as ideal building blocks for the fabrication of mesoporous titanate hybrids with a high surface area and easily tunable nanoporosity. These uniform TNDs can also be used as stabilizer in the synthesis of ultra-small colloidal metal NPs, i.e., forming metal-TNDs colloidal hybrids, which exhibit enhanced catalytic properties, as compared to metal colloids stabilized by a conventional organic protecting agent.
In Chapter 7, we use the TNDs developed in Chapter 6 to construct efficient multicomponent photocatalysts (MPs) for H2 production under visible light. The
photocatalysts are designed to significantly enhance simultaneously the efficiency of the three main steps in the photocatalytic process i.e., light absorption, charge separation and catalytic reaction. We show, as an example, the construction of water-soluble CdS–TND– Ni MPs. Under visible light illumination (λ ≥ 420 nm), the optimally designed CdS–TND– Ni MPs could generate H2 from ethanol–water solution with rate as high as 15.326 mmol
8
g−1 h−1 during a reaction course of 15 h and an apparent quantum yield of 24% at 420 nm.
Moreover, we also demonstrate that TNDs can be combined with other single or mixed metal sulfides to form water-soluble metal sulfide–TNDs composites which could also be of great interest for photocatalytic H2 production.
In Chapter 8, the TNDs developed in Chapter 6 are further used for the construction of three-dimensional ordered assembly of thin-shell Au/TiO2 hollow nanospheres (namely
Au/TiO2-3DHNSs). The designed materials exhibit not only exceedingly high surface area
but also photonic behavior originating from periodic macroscopic voids from both the inside and the outside of hollow spheres that have very thin shells. The multiple light scattering and slow photon effects resulting from this unique architecture greatly enhance the surface plasmon resonance of Au NPs, which leads to a significant enhancement in the visible light absorption of Au/TiO2-3DHNSs. As a result, these new photocatalysts exhibit
a photocatalytic activity that is several times higher than conventional Au/TiO2
nanopowders, as illustrated by the example of the photocatalytic decomposition of isopropanol under visible light illumination.
In Chapter 9, we highlight the major conclusions drawn from the work in this thesis. The continuation and application of this work in new research directions is also recommended.
9
Chapter 2:
Titanium Dioxide Photocatalysis
This chapter provides an introduction to the field of heterogeneous photocatalysis. We focus on presenting various strategies for improving the photocatalytic activity of TiO2.
The underlying reasons for the photocatalytic activity improvement using these strategies are discussed along with the key factors that influence their efficiency. New methods associated with the design of more effective TiO2 based photocatalysts are also suggested.
11 2.1 Fundamentals of TiO2 photocatalysis
2.1.1 Heterogeneous photocatalysis
Heterogeneous photocatalysis is a process in which light radiations having energy equal to or greater than the band gap energy of a semiconductor strikes on its surface and generates electron-hole pairs. The excited electrons and holes then separate and migrate to the surface of the photocatalyst where they can undergo charge transfer to adsorbed species on the semiconductor surface from solution or gas phase contact.25,49 There are several
processes occurring in heterogeneous photocatalysis as illustrated in Figure 2.1. They include light absorption of the semiconductor photocatalyst, generation of excited charges (electrons and holes), recombination of the excited charges, separation of excited charges, migration of the charges, trap of excited charges, and transfer of excited charges to adsorbed molecules. All of these processes affect the overall efficiency of the photocatalytic reaction.26
Figure 2.1. Processes in semiconductor photocatalysis (A: electron acceptor; D: electron donor).49
The initial process in heterogeneous photocatalysis is the generation of electron-hole pairs in the semiconductor particles under band gap illumination. Apparently, the photocatalytic efficiency is mainly determined by the amount of charges generated. Therefore, any other processes that consume excited electrons should be avoided in order
Reduction Oxidation Band gap excitation
A
A
-D
D
++
-+
+
-
+
Bulk recombination12
to maximize the efficiency of the photocatalytic process, and process that generates excited electrons should be improved.50 Thus, if we look at the charge-generation process, the
semiconductor photocatalyst should first have a low band gap to absorb as much light as possible, and reflection or scattering of light by the photocatalyst should be minimized. Second, using the absorbed photons, the semiconductor photocatalyst should have a high efficiency in generating excited charges, instead of generating heat.
After excited charges are generated, charge recombination and separation/migration are two important competitive processes inside the semiconductor photocatalyst that largely affect the efficiency of the photocatalytic reaction. Recombination of the generated electrons and holes can occur in the volume of the semiconductor particle or on the surface with the release of heat. Obviously, charge recombination is detrimental to the efficiency of the photocatalytic process. Thus, efficient charge separation and fast charge transport, avoiding any bulk/surface charge recombination, are essentially important for semiconductor photocatalysis. Any approach beneficial to the charge separation and transport should be taken into account for the design of efficient photocatalysts.49,50
Once the electrons and holes are delivered to the semiconductor surface, they can undergo the charge transfer to adsorbed organic or inorganic species or to the surrounding solvent. The electron transfer process is more efficient if the species are preadsorbed on the surface. While at the surface, the semiconductor can donate electrons to reduce an electron acceptor; in turn, a hole can migrate to the surface, where an electron from a donor species can combine with the surface hole, oxidizing the donor species. The probability and rate of the charge transfer processes for electrons and holes depend upon the respective position of the band edges of the conduction and valence bands as well as the redox potential levels of the adsorbate species. In addition, as the charge transfer processes also depends upon the adsorption of the species on the semiconductor surface, the factors such as surface properties and surface area thus strongly influence the overall efficiency of the heterogeneous photocatalysis process.22,49
2.1.2 Desired properties of a photocatalyst
There are several different semiconducting materials which are readily available, but not many of them are suitable for the photocatalytic decomposition of organic pollutants and
13 especially for hydrogen production from water splitting. This is because the semiconductor photocatalyst must be (i) photoactive, (ii) able to utilize visible and/or near UV light, (iii) chemically inert and photostable, and (iv) inexpensive.27,51-54
In order for a semiconductor to be photochemically active, it must have a suitable band structure because the ability of a semiconductor to undergo photoinduced electron transfer to adsorbed species on its surface is governed by the band energy position of the semiconductor and the redox potentials of the adsorbate. The relevant potential level of the acceptor species is thermodynamically required to be below the conduction band (CB) potential of the semiconductor. The potential level of the donor needs to be above the valence band (VB) position of the semiconductor in order to donate an electron to the vacant hole. For example, in the photocatalytic overall water splitting, the redox potential of photogenerated VB hole must be sufficiently positive to oxidize water to generate oxygen, and the redox potential of the photogenerated CB electron must be sufficiently negative to be able to reduce water to produce hydrogen. Figure 2.2 shows a schematic of the band edge positions of the different semiconductor materials with respect to the redox potentials of water.17 It can be seen that the flat band potential requirements immediately
eliminate some materials from consideration as single-component photocatalyst for overall water splitting. Hematite (α-Fe2O3) and WO3, for example, have quite small band gaps and
effectively absorb visible light. However, they are unable to induce the water reduction because their CB potentials are below the reduction potential of water.
One of the most attractive aspects about photocatalysis is its potential utilization of the solar energy. A potential semiconductor photocatalyst should therefore absorb the sunlight effectively. As seen in Figure 2.3, the major fraction of the solar spectrum is visible light. This means that, in order for the semiconductor to use the sunlight effectively, its band gap must be smaller than 3 eV.4 From this point of view, many wide band gap
metal oxides which exhibit strong oxidation and reduction potentials, for example ZrO2
14
Figure 2.2. Relationship between band structure of semiconductor and redox potentials of water
splitting.17
Figure 2.3. Spectral distribution of the solar photon irradiation based on the Air Mass 1.5 global
data; the curve is based on the American Society for Testing and Materials Terrestrial Reference.4
Besides the electronic band structure, the resistance to chemical degradation by electrochemical corrosion, photo-corrosion and dissolution processes is another essential requirement to be met by a photocatalyst. A number of photocatalysts, especially metal sulfides, would appear to be ideal photocatalysts for water splitting and decomposition of organic pollutants based on electronic band potentials (e.g., CdS in Figure 2.2). However, they are not photostable because the anions of these materials are more easily oxidized than water causing their degradation by oxidation of the material.26 Oxide semiconductors
15 are typically more photostable under photocatalytic reaction conditions, since they are normally already in a high oxidation state. However, even some oxide semiconductors, such as ZnO, suffer from photo-instability in water.17
In addition to the numerous considerations mentioned above, suitable photocatalysts for hydrogen production from water splitting and for decomposition of organic pollutants must be abundant and affordable in order to ultimately facilitate the practical application. Taking into account all of the aspects including electronic band structures, stability and availability, TiO2 appears to be the most suitable photocatalyst. In fact, it is currently the
only semiconductor used as photocatalyst commercially.32
2.1.3 TiO2 as photocatalyst
Titanium is the world’s seventh most alundant metal and the ninth most abundant element, constituting about 0.63% of the Earth’s crust. Industrially, TiO2 is produced from ilmenite
(FeTiO3), which is quite common and found in large deposits in many countries. The
relative abundance of inexpensive raw materials makes this photocatalyst easier for commercial application. In addition, based on chemical configuration, TiO2 is chemically
stable under a wide range of photocatalytic conditions.30,31 More importantly, TiO 2 has
been used as a white pigment from ancient times, and thus, its safety to humans and the environment is guaranteed by history.32
In nature, TiO2 is found in three main polymorphs i.e., anatase (tetragonal), brookite
(orthorhombic), and rutile (tetragonal). Among them, anatase and rutile are commonly used in photocatalysis.30 Although both anatase and rutile are constructed from TiO
6
octahedra as building units, their structures are different by the distortion of each octahedron and by assembly patterns of the octahedra chains as shown in Figure 2.4.44 The
octahedron in rutile is not regular, showing a slight orthorhombic distortion. The octahedron in anatase is significantly distorted so that its symmetry is lower than orthorhombic. The structure of rutile has each octahedron in contact with 10 neighboring octahedrons (two sharing edge oxygen pairs and eight sharing corner oxygen atoms) (Figure 2.4). In contrast, the anatase structure, as also shown in Figure 2.4, has each octahedron in contact with eight neighboring octahedrons (four sharing an edge and four sharing a corner).49
16
Figure 2.4. Representations of the TiO2 anatase, rutile, and brookite forms.44
The differences in lattice structures cause difference in electronic band structures of anatase and rutile TiO2 with the former exhibiting a larger band gap (3.2 eV compared to
3.0 eV, respectively).34,49 Thus, rutile phase appears to be more effective photocatalyst compared to anatase one in term of light absorption. However, it was found that the anatase phase, in most cases, exhibits higher photocatalytic activity.16,30,34,55 It has been suggested that the higher photoreactivity is due to anatase’s slightly higher Fermi level, lower capacity to adsorb oxygen and higher degree of hydroxylation (i.e., number of hydroxy groups on the surface).56,57 However, reactions in which both crystalline phases have the
same photoreactivity or rutile has a higher one, are also reported.58 The disagreement of the
results may lie in the intervening effect of various coexisting factors, such as specific surface area, pore size distribution, crystal size, crystal shape, and preparation methods.
The high importance of TiO2 as photocatalyst lies in its ability to oxidize a large
number of organic compounds into harmless ones such as CO2 and H2O and to split water
into hydrogen and oxygen.57 This feature originates from its suitable electronic band
structure. The redox potential for photogenerated holes from TiO2 is +2.53 V versus the
standard hydrogen electrode (SHE) which is positive enough to produce oxygen or hydroxyl radicals (●OH) from water. The redox potential for CB electrons is −0.52 V,
which is in principle negative enough to evolve hydrogen from water and to produce superoxide O2- from absorbed oxygen. The generation of ●OH radicals and superoxide O2
17 As mentioned above, an ideal semiconductor photocatalyst should be able to efficiently catalyze reactions, efficiently be activated by sunlight, chemically and biologically inert, photostable, easy to produce and cost effective. TiO2 is close to being an
ideal photocatalyst, displaying almost all the above properties. The only exception is that, like other wide band gap semiconductors, it does not absorb visible light, making it ineffective under sunlight. Several approaches have been developed to extend the light absorption of TiO2 to the visible region including doping TiO2 with metal or non-metal
elements, coupling TiO2 with small band gap semiconductors or plasmonic metals. In
addition, strategies to enhance the charge separation and surface catalytic processes such as loading TiO2 with metal cocatalysts and controlling the morphology of TiO2 particles have
been also reported. These strategies are discussed in the next section of this chapter. Furthermore, one effective method for designing efficient TiO2 based photocatalysts which
uses titanate nanosheets (ultrathin titanium oxide nanosheets) as building blocks is also discussed.
18
2.2 Strategies toward efficient TiO2 based photocatalysts 2.2.1 Doping
Doping is well known to be an effective way to alter the optical and electronic properties of semiconductors for different applications. Technically, doping is the introduction of foreign elements into the parent materials without giving rise to new crystallographic forms, phases or structures. In photocatalysis, doping with metal and non-metal elements is a popular technique that facilitates visible light activity of wide band gap semiconductors.37,60-81
2.2.1.1 Origins of visible light absorption in doped TiO2
In TiO2, the CB and VB consist of dominant Ti 3d and O 2p states, respectively.36 Band
gap narrowing of this material requires either elevating the VB maximum or lowering the CB minimum. When a metal (cation) or non-metal (anion) is used as a doping agent for TiO2, its energy levels can be incorporated into the band gap of TiO2. The new energy
levels, also known as impurity states, can either accept electrons from the VB or donate electrons to the CB.64,67,69,74,78 As shown in Figure 2.5, the energy gap between impurity
states and conduction or VB are narrower, in comparison with the energy gap between the VB and CB. Therefore, the doped TiO2 may absorb visible light and generate electron-hole
pairs.
Figure 2.5. Three different transitions in TiO2: (1) transition from VB to CB; (2) transition from
VB to acceptor impurity level (Ea); and (3) transition from donor impurity level (Ed) to CB.
It is noted that the location of energy levels within the band gap, which is highly dependent on the dopant used, is important when determining the reduction and oxidation strength of doped TiO2. If electrons are being promoted from the VB of TiO2 to the
+ + - -Ea Ed CB VB Ti3d O2p (1) (2) (3) UV Visible Visible -+