Quality Fruit Grading by Colour Machine Vision: Defect Recognition
Leemans, V.1, Destain, M.-F.1, Magein, H.2
1 Faculté universitaire des Sciences agronomiques de Gembloux - Ingénierie des Biosystèmes, Passage des déportés, 2, 5030 Gembloux, Belgium
2 Faculté universitaire des Sciences agronomiques de Gembloux - Unité d'Horticulture générale, Passage des déportés, 2, 5030 Gembloux, Belgium
Abstract
This paper presents the classification of Jonagold apple defects on their shape, colour and texture-basis according to the E.U. standards. The small defects (less than 11 mm2) with little variability were graded separately, with 5 parameters (roundness, mean colour and mean red standard deviation) into three classes (healthy, russeting, defects). With linear discriminant analysis, the global correct classification rate reached 71%. 95% of the healthy blobs, coming from slight over-segmentation, were correctly graded. For larger patches, a first grading between healthy patches and defects (including calyx and stem ends) was carried out. 86% of the patches were correctly graded with 12 parameters: 4 for the shape , 3 for the colour and 5 for the texture. The defects were graded afterwards with the same descriptors set. The results were quite good as a whole (66% of the defects correctly graded). Scabs, stem end and russeting were well recognised, but slight defects and defects rejecting the fruits were less accurately sorted. The use of neural networks enhanced this result (71% of the defects correctly graded).
Keywords : apples ; defects recognition ; grading ; machine vision ; quality
1. Introduction
The grading of fruits according to their quality is discussed using apples as example. The European apple quality standards (Anonymous, 1989) specify that all fruits must be intact, sound and clean. Thus, any mutilation or injury spoiling the flesh integrity of the fruit is always considered as main defecf and is not tolerated. Three commercial categories (E, A, B) are defined based mainly on colour and shape requirements. Light skin defects are not allowed in Cat. E and their tolerances in Cat. A and B are listed according to their nature. Specifically, scab spot(s) may not exceed maxima areas, russet tolerance varies with its localisation and all other skin defects may not exceed a particular area or length. Fruits that do not reach these minima requirements are considered as culls and are traditionally sold for processing.
Classification of apples by machine vision implies two successive and imbricated steps: segmentation and recognition of defects.
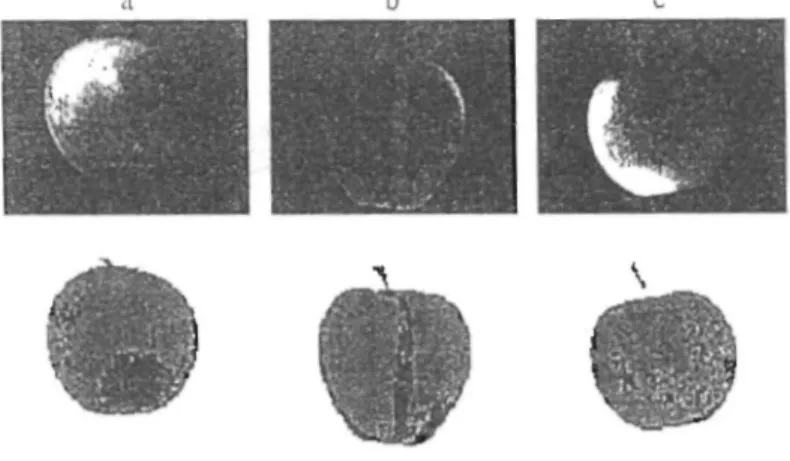
Defects segmentation is a difficult task because the fruits and the defects' colours vary widely. For example, on a given fruit, part of a good surface can have the same colour as a defect. Furthermore, the contrast between the fruit and the defect is highly variable. The consequence is that a threshold method is rarely efficient. On the other hand, the defect shape is considerably variable and consequently techniques known in image analysis as "pattern recognition" would fail. In previous works, Leemans et al. (1998, 1997) developed two different algorithms for accurate detection of fruit defects. Both were based on colour vision and on analysis of RGB (red, green, blue) coordinate values. The first was well suited for monochrome fruits like Golden delicious apples and was based on a parametric model of the tissue colour. The second was more appropriated for multicolour fruits such as Jonagold apples and was a bayesian method based on a non-parametric model of the probability distribution of the blemish colours and the sound tissue colours. The results obtained by both methods were accurate, from the judgement of observers and within the scope of fruit grading. The result of the segmentation are images like Fig. 1 (Jonagold apples), where the grey level is 255 (white) for the background, 128 (grey) for the healthy tissue and 0 (black) for the defects. The segmentation algorithm included a parameter which had to be adjusted to
determine the detection level. This setting had to carry out a compromise between an over-segmentation of patches resulting from normal variations of the healthy tissues or an under-segmentation of defects. The first
alternative was preferred because the erroneously segmented areas could be eliminated during the defect recognition step, while the result of an under-segmentation could not be corrected. The result was that on the segmented images some areas corresponding to healthy tissue had to be eliminated in the recognition step. On the other hand, on some images, the calyx or stem ends were present. These items could be identified by special techniques using structured light (Yang, 1995). In our case, only diffuse light was used and calyx and stem ends appeared like defects. They must also be recognised.
This shows clearly that segmentation and recognition are related. This paper presents a method to recognise the different kinds of defects on apples including namely russet, scald, wound, bruise, sunsclad, insect holes, bitter pit, disease, frost damage... The chosen fruit were Jonagold apples which are characterised by a red blush colour and a green ground colour.
Figure 1. Segmentation results : above green channel of the original images (with enhanced contrast for
printing purpose); below segmentation results
2. Material and method
2.1. Material
207 Jonagold apples presenting at least one defect and selected to present a wide diversity of blemishes were studied; ¾, i.e. 155 images were used for the computation of the decision rules (learning phase) and ¼ i.e. 52 images were used for the validation. 2850 patches were found in the learning images and 771 in the validation set. The frequency distribution vs. the area is shown in Fig. 2.
2.2. Defects recognition
A "blob analysis" consisting in aggregating the defect pixels into blobs was performed (Image-Pro routine - Media Cybernetics). Shape parameters were directly measured on the segmented images. The boundary of the blobs was transferred into the original image to compute some parameters expressing the colour or the texture of the defect. In a first step, several parameters were measured and the most discriminant amongst them were selected. A discriminant analysis using that selection was then used for the defect recognition, according to European standards.
2.2.1. Measurements
16 parameters were measured to characterise the defects. The shape was quantified by 8 parameters (described by Anonymous, 1994) including namely the area or the length which are directly required by the standards. The other parameters are classical shape descriptors.
Shape parameters: • the area (noted Area); • the perimeter (Perim);
• the length of the major axis of the inertia ellipse (MajAx);
• the ratio between the major and minor axis of the inertia ellipse (Aspect); • the Ferret's mean diameter (MeanDia);
• the roundness (Round);
• the length along the major axis (Length); • the width along the minor axis (Width);
The colour and the texture were characterised by 8 parameters. The mean colorimetric values of the blob (mR, mG, mB) were computed. The standard deviations of each channel (sR, sG, sB) characterised the colour variations on the whole blob. The texture was appreciated by the roughness computed as the standard deviation in a small squared region around the considered pixel in the red channel (SR). Two parameters were computed : the mean value (mSR) and the standard deviation of SR (sSR). Wide variations also influence mSR which must be used with sR.
Colour and texture parameters : • the mean red (mR);
• the mean green (mG); • the mean blue (mB);
• the standard deviation on the R channel (sR); • the standard deviation on the G channel (sG); • the standard deviation on the B channel (sB);
• the mean of the standard deviation for each pixel on the R channel (mSR);
• the standard deviation of the standard deviation for each pixel on the R channel (sSR).
The shape parameters and mR, mG and mB were computed using Image-Pro software (Media Cybernetics) while sR, sG, sB, mSR and sSR parameters are not standard features and were implemented in C++ (Visual C+ +, Microsoft).
2.2.2. Classification process
All the parameters presented did not have the same discriminant power and some arc related to others (for example, Round is proportional to the Area ∕ Perim ratio). The procedure used to select the discriminant
parameters was widely inspired from the stepwise selection procedure (Dagnelie, 1975). Contrary to the stepwise process, the variables to be added to the set were not chosen automatically, but the selection was supervised by the operator. If two or more variables were close in term of discrimination enhancement, the operator, on a
priori knowledge basis, might select one which could not strictly be the best on a statistical point of view.
All the blobs smaller than 4 pixels were not taken into account (one pixel = 1.1 mm2). The small blobs, having an
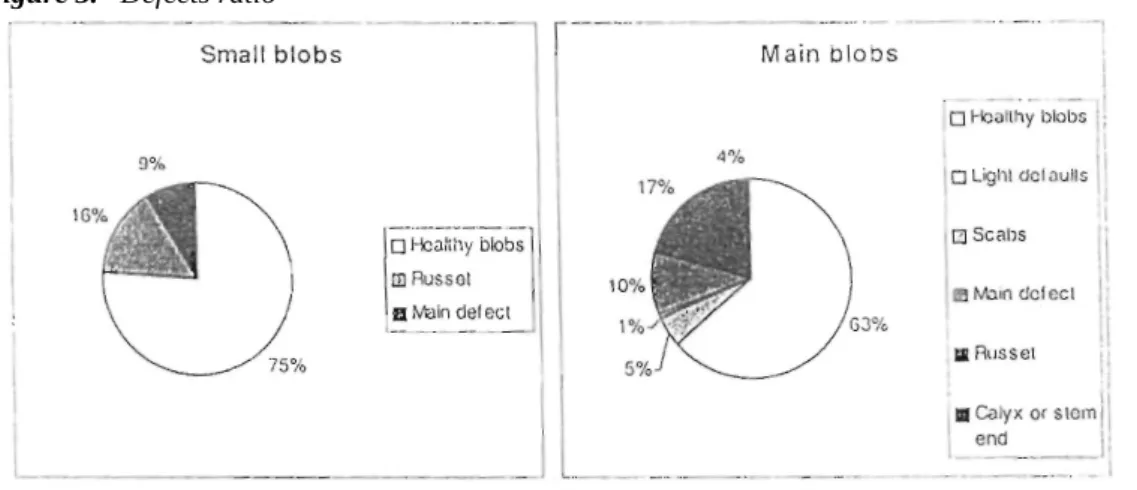
area between 4 pixels (included) and 10 pixels (excluded), represented 58% of the total amount of blobs and less than 7% of the total surface. Fig. 3 gives the defect repartition for the small and the main blobs. It seemed
normal to consider fewer parameters for the small blobs since the size (Area or Length for example), the shape or the colour variations are limited. Mostly, if a blob is not correctly sorted, the risk (expectation of the cost) is less important than for bigger defects. Only 3 classes were considered here : the healthy blobs, the russet and the other defects. Fisher's linear and quadratic discriminant analysis were used to separate them. Fig. 3 suggests that the prior probabilities are not the same. Consequently, their influence on the discrimination rate was also studied.
Figure 3. Defects ratio
For the larger blobs, the classification was performed in two steps. Firstly the blobs were separated between "healthy blobs" and "defects". Secondly the defects were sorted into five classes (including the stem and calyx end) :
1. slight defects acceptable in categories A or B; 2. scabs;
3. main defect (rejecting the fruit); 4. russet;
5. calyx or stem end.
This classification was directly inspired by the standards which do not require to recognise each kind of defect but specify some precise criteria concerning scab, russet and the main defect responsible of fruit rejection. Fisher's linear and quadratic discriminant analysis were used to establish the decision rules (Dagnelie, 1975). The use of neural network to enhance the previous results was also tested. The structure of the neural network, a multi-layer perception (Fig. 4) included one hidden layer with five neurones and a sigmoïdal transfer function and five output neurones with a linear transfer function.
3. Results and discussion
Fig. 5 shows the influence of the number of parameters on the grading accuracy of a main defect into six classes (the five presented in the classification process section plus the healthy blobs). The discrimination rate grew with the number of parameters p, but the growing rate decreased when p increased. The best combination included 4 shape parameters, the 3 colour parameters and the 5 texture parameters : Aspect, MajAx, MeanDia, Perim, mR, mG, mB, sR, sG, sB, mSR, sSR. This sub-set was used to sort the large blobs. The small blobs were classified using the five best parameters : Round, mR, mG, mB and mSR.
Figure 5. Discrimination rate vs. number of parameters - quadratic discriminant analysis
3.1. Small blobs
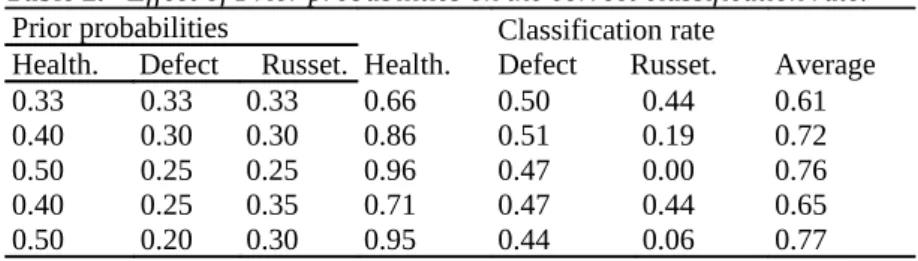
Using the linear discriminant analysis, it was possible to grade correctly 61% of the small blobs. Table 1 gives the associated confusion matrix. The quadratic discriminant analysis did not enhance significantly this result (64%). Table 2 indicates the correct classification rate, for each class and globally, in relation with the prior probabilities. It should be noticed that the global accuracy grew, up to 77%, with the increase of prior probability of the healthy blob class. This was due to a better classification of the healthy blobs at the loss of the two other classes, to such a point that russet was nearly no longer separable. For Jonagold, the colour of the transition area between surface colour and blush colour is very close to the russet colour. This explains the difficulties for the segmentation and for the blob classification afterwards.
Table 1. Confusion matrix for small blobs sorted with linear discrimination; correct classification rate.
Sorted in group Healthy
True groups
Defects Russet
Healthy 0.66 0.25 0.40
Defects 0.05 0.50 0.16
Russet 0.29 0.25 0.44
Table 2. Effect of Prior probabilities on the correct classification rate.
Prior probabilities
Health. Defect Russet. Health.
Classification rate
Defect Russet. Average
0.33 0.33 0.33 0.66 0.50 0.44 0.61 0.40 0.30 0.30 0.86 0.51 0.19 0.72 0.50 0.25 0.25 0.96 0.47 0.00 0.76 0.40 0.25 0.35 0.71 0.47 0.44 0.65 0.50 0.20 0.30 0.95 0.44 0.06 0.77 3.2. Large blobs
The result of the classification into healthy blobs or defects is presented in Table 3. The two error rates were very different, around 30% of the defects were not recognised, while 5% of the healthy blobs were not correctly graded. It must be noticed that the error costs arc very different too. The five percent of healthy blobs sorted as defects are important because the fruits could be degraded and the producer looses money directly. On the other hand, the error on the defects is important but if 10% of the fruits present a defect, after grading, 3% of the accepted fruits could present a defect, which is below the tolerances of the Extra class. The global correct classification rate was 84%. This result reached 86% with the neural networks.
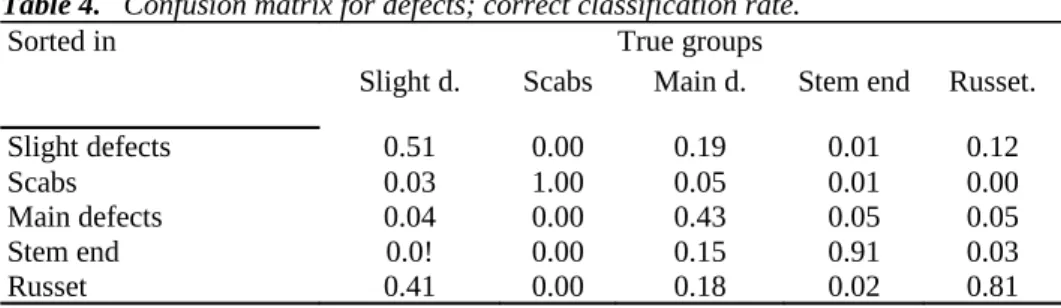
Table 4 presents the results of the classification of the defects into 5 classes, with quadratic discriminant functions. Scab and russet were well discriminated. Stem ends were graded correctly with an accuracy of 91%. This is not good enough because each fruit presents this item and consequently, a particular technique devoted to the stem and calyx ends recognition should be studied. The slight defects were often confused with russel. This can be explained because lots of defects present scar tissue having visual appearance close to the russet. The main defects were correctly graded in one case out of two. This class included a wide range of defects, presenting a wide range of shape, colour or texture, which could explain that errors are split up into the other classes. The correct global rate was 65%. Neural networks gave interesting enhancement with 71% of the defects correctly sorted.
Table 3. Confusion matrix for large blobs sorted; correct classification rate.
True groups
Sorted in Healthy Defect
Healthy 0.95 0.31
Defect 0.05 0.69
Table 4. Confusion matrix for defects; correct classification rate.
Sorted in True groups
Slight d. Scabs Main d. Stem end Russet.
Slight defects 0.51 0.00 0.19 0.01 0.12 Scabs 0.03 1.00 0.05 0.01 0.00 Main defects 0.04 0.00 0.43 0.05 0.05 Stem end 0.0! 0.00 0.15 0.91 0.03 Russet 0.41 0.00 0.18 0.02 0.81 Acknowledgements
This research is funded by the Federal Ministry of Agriculture of Belgium. Project n° D1/4-6121/5703 A
References
Anonymous 1989. Norme de qualité des pommes et poires de table. Journal des Communautés européennes, L97/19 . Règlement CEE 920/89
Anonymous 1994. Image-Pro Plus Reference Guide. Media Cybernetics, L.P.: 554, Silver Spring - Maryland - USA Dagnelie P. 1975. Analyse statistique à plusieurs variables. Les presses agronomiques de Gembloux: 362, Gembloux
Leemans V., Magein B.., Destain M.-F. 1997. Mesure par vision artificielle des caractéristiques externes de pommes en vue d'établir un classement. Rapport d'activité du Centre de recherche de méthodes non-destructives permettant d'apprécier "on-line" la qualité des pommes 1996-1997: 131, Gembloux, unpubl.
Leemans V., Magein H., Destain M.-F. 1998. Defects segmentation on 'Golden Delicious' apples by using colour machine vision. Computers and Electronics in Agriculture, Elsevier Science . Accepted for publication on 16 January 1998
Yang Q., R.D.Tillet 1995. Neural network, classifier in apple blemish inspection. Preprints of 1st workshop on Control applications in post-harvest and processing technology. J. De Baerdemaeker and J. Vandewalle: 137-141
![[PDF] Cours : Excel Budget Prévisionnel | Télécharger PDF](data:image/gif;base64,R0lGODlhAQABAIAAAP///wAAACH5BAEAAAAALAAAAAABAAEAAAICRAEAOw==)