HAL Id: hal-01194352
https://hal.archives-ouvertes.fr/hal-01194352
Submitted on 6 Sep 2015
HAL is a multi-disciplinary open access
archive for the deposit and dissemination of
sci-entific research documents, whether they are
pub-lished or not. The documents may come from
teaching and research institutions in France or
abroad, or from public or private research centers.
L’archive ouverte pluridisciplinaire HAL, est
destinée au dépôt et à la diffusion de documents
scientifiques de niveau recherche, publiés ou non,
émanant des établissements d’enseignement et de
recherche français ou étrangers, des laboratoires
publics ou privés.
IEEE 802.11ac Multi-User MIMO Capacity and Impact
of Antenna Array Geometry based on Indoor
Measurements
Khouloud Issiali, Valery Guillet, Ghais El Zein, Gheorghe Zaharia
To cite this version:
Khouloud Issiali, Valery Guillet, Ghais El Zein, Gheorghe Zaharia. IEEE 802.11ac Multi-User MIMO
Capacity and Impact of Antenna Array Geometry based on Indoor Measurements. 2015 IEEE 26th
Annual International Symposium on Personal, Indoor, and Mobile Radio Communications (PIMRC),
Aug 2015, Hong Kong, Taiwan. �10.1109/pimrc.2015.7343393�. �hal-01194352�
IEEE 802.11ac Multi-User MIMO Capacity and
Impact of Antenna Array Geometry based on Indoor
Measurements
Khouloud ISSIALI and Valery GUILLET
Engineering and Propagation Department Orange Labs,1 Rue Louis et Maurice de Broglie,
90007 Belfort Cedex, France Email: Khouloud.Issiali@orange.com
and Valery.Guillet@orange.com
Ghais EL ZEIN and Gheorghe ZAHARIA
IETR-INSA
UMR 6164, 20 av. des buttes de Co¨esmes, CS 70839, 35708 Rennes Cedex 7, France
Email: Ghais.El-Zein@insa-rennes.fr and Gheorghe.Zaharia@insa-rennes.fr
Abstract—Based on channel measurements conducted at 5 GHz, this paper examines the impact of transmitting an-tennas on the Block Diagonalization (BD) capacity gain for I EEE 802.11ac Multi-User Multiple Input Multiple Output (MU-MIMO) in Home Networks. We study in details a system with two users with two antennas each by evaluating multiple numbers as well as various geometries of transmitting antennas. The experiments reveal that Crossed Circular Array (CCA) is recommended for small sized transmitter with 8 antennas (70% of MU-MIMO capacity gain over Single User MIMO (SU-MIMO) is achieved for a 20 dB of Signal-to-Noise Ratio (SNR)). In the context of a less congested system, it has been shown that using 6 transmitting antennas arranged in Uniform Linear Array (ULA) gives a gain close to that obtained with 8 antennas. We have also shown, using measured path loss values, that the capacity gain of MU-MIMO to SU-MIMO goes beyond the double when the difference between the received power of each user is high. This is obtained in comparison with the Carrier Sense Multiple Access/Collision Avoidance (CSMA/CA) as a channel access method, 130% of gain is achieved when the gap between the received powers of each user is around 40 dB.
Keywords—MU-MIMO; IEEE 802.11ac; capacity; antenna ar-rays; indoor propagation measurements.
I. INTRODUCTION
In a Downlink (DL) User Multiple Input Multi-ple Output (MU-MIMO) scenario, an Access Point (AP) is equipped with multiple antennas and is simultaneously trans-mitting several independent spatial streams to a group of users. Each of these users is also equipped with a single or multiple antennas. The management of multiple users generates a new interference called Inter User Interference (IUI). Several studies have focused on the MU-MIMO solutions to overcome multipath propagation and IUI.
In this context, the new IEEE 802.11ac standard rati-fied in January 2014 normalizes the MU-MIMO processing, namely precoding techniques [1]. The use of MU-MIMO methods aims to increase data rates above 1 Gbits/s and to improve capacity. The precoding methods can be classified according to several criteria [2]. The criterion that has been frequently used is whether the technique is linear or not.
The non-linear techniques are known to achieve optimum capacity. Actually, it has been proven that the capacity region of the DL MU-MIMO systems is achieved with Dirty Paper Coding (DPC) method [3]. This technique has, however, high computational complexity. The linear method that is most explored in the literature is Block Diagonalization (BD) [2]. The main principle of BD is to ensure zero IUI as a first step, and then to maximize capacity. Thus, with perfect Channel State Information (CSI) at the Transmitter (Tx), BD transforms a MU-MIMO system into several parallel Single User MIMO (SU-MIMO) systems after canceling the IUI. Transmit eigen-beamforming [4] is then applied to maximize capacity. In fact, when a perfect CSI is provided at the access point, zero IUI is achievable at every receiver, enabling thereby a simple receiver at each user. However, propagation channels change over time in actual radio environments and CSI is hence not perfect. A simple channel prediction scheme to provide CSI is proposed in [5], and its effectiveness is demonstrated through simulations of Bit Error Rate (BER) performance using a measurement campaign in a meeting room.
Few articles have studied MU-MIMO capacity based on measured indoor MU-MIMO propagation channels. In a nar-row indoor corridor environment, the authors in [6] have ana-lyzed DPC gain over linear processing for two single antenna receivers and reveal that this gain is almost insignificant for low and high user channel orthogonality. Studies in [7]–[9] have focused on achieving capacity or throughput improvement through the use of various transmitting antenna arrangements, antenna designs and antenna configurations. It has been shown in [9] by evaluating channel capacity that a compact tri-polarization antenna cube combined with a simplified pattern circuit are suitable for MU-MIMO systems with antenna selection. It has been shown in [7], using one transmitter with 8 antennas and four single antenna receivers, that constraining the antenna arrangement to7λ is beneficial (a gain of 12.8 % of spectral efficiency is achieved) in an indoor environment (room), whereλ indicates the wavelength of carrier frequency. However, none of these articles highlights the area of use of the MU-MIMO compared to SU-MIMO, or studies in details MU-MIMO capacity gain over SU-MIMO with multiple an-tennas receivers based on measurements in Homes Networks.
In this article, we evaluate the MU-MIMO capacity gain over SU-MIMO using system with various transmitting antenna array geometries and with two antennas at each Receiver (Rx) in an indoor frequency selective fading environment. This is based on propagation channel measurements. The measure-ment campaign has been conducted in the5.25 GHz frequency band in a residential environment typically encountered in home networks. The rest of this paper is organized as follows. Section II presents briefly the considered802.11ac system, the BD algorithm and gives the capacity computation method for MU-MIMO and SU-MIMO systems. Section III describes the experiment and the post processing of the data. The results are provided in Section IV. Finally, the conclusion is drawn in Section V.
II. IEEE 802.11ACMULTI-USERMIMO SYSTEM AND
RELATEDCHANNELCAPACITY
The studiedIEEE 802.11ac MU-MIMO system based on BD precoding and its capacity are detailed in [10]. Hereafter, we recall capacity formulas.
A. MU-MIMO Capacity
For a MU-MIMO system withK users and nRkreceiving
antennas for each userk, the channel capacity for a particular propagation channel sample is expressed for each Orthogonal Frequency-Division Multiplexing (OFDM) subcarrier by (1).
CM U −M IM O= K X k=1 nRk X i=1 log2(1 + pik σ2 n µ2 ik) (1)
where pik is the power dedicated to the ith antenna for the
kth user, µ2
ik are the eigenvalues of the effective channel for
the kth user after applying the IUI cancellation, and σ2 n is
the noise power. The total transmitted power over 20 M Hz bandwidth is equally shared amongpikand is scaled to satisfy
the Equivalent Isotropically Radiated Power (EIRP) constraint of Wireless Local Area Network (WLAN) [1], and K = 2 throughout this paper.
B. SU-MIMO Capacity
For the corresponding SU-MIMO systems and for relevant comparisons with MU-MIMO, the numbers of transmitting antennas nT and receiving antennas nRk remain unchanged.
The considered SU-MIMO system applies a singular value decomposition and its capacity is computed for each OFDM subcarrier as detailed in [4]. We denoteC1andC2the provided
capacities for two users respectively. The SU-MIMO capacity for a 2-user system is expressed according to the applied channel access method. We give the capacity for the following two channel access methods.
1) TDMA method: In the literature, the SU-MIMO sum capacity is often computed considering the deterministic Time Division Multiple Access (TDMA) which allows several users to share the same frequency channel by dividing the signal into equal time slots.The TDMA SU-MIMO sum capacity, denoted CSU,T DM A, is computed using the arithmetic mean ofC1and
C2as can be seen in (2).
CSU,T DM A= C 1+ C2
2 (2)
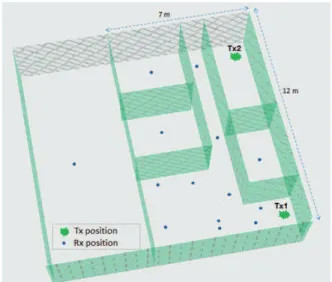
Figure 1. The indoor environment: 2 positions of Tx with 12 positions of Rx.
2) CSMA/CA method: The IEEE 802.11ac standard uses for the channel access the Carrier Sense Multiple Ac-cess/Collision Avoidance (CSMA/CA) method, where each user verifies the absence of other co-channel signals before transmitting a frame. The data frames are supposed to have equal size for each user, which implies a variable transmission duration [11]. The CSMA/CA SU-MIMO sum capacity is then equal to the harmonic mean of C1 andC2 expressed by (3).
CSU,CSM A= 1 2 C1 + 1 C2 (3) III. EXPERIMENT
In this section, we present the performed measurement for MU-MIMO channels, based on which we evaluate the performance. We first describe the measurement environment as well as the studied scenarios. Further, we introduce the measurement equipment and setup, and the post processing including the different types of transmitting antenna arrays.
A. Measurement Scenario
Fig. 1 represents the environment of the experiment. It displays a typical 3D indoor residential scene used to perform measurements [12]. It is a typical and real middle sized apartment with a 12m × 7m surface and European building materials and furniture. The ceiling is at2.53 m. Both Line-Of-Sight (LOS) and Non-Line-Of-Line-Of-Sight (NLOS) scenarios have been probed. Nevertheless, hereafter we do not study the two cases separately since both give almost identical results. Two locations of the Tx are considered, denoted as Tx1 and Tx2 in Fig. 1. For each position of Tx, multiple configurations of the two receivers are evaluated. We denote Rx1 andRx2 the
position for the first and the second user respectively. During the measurements, nothing moved in the environment of the experiment to keep the same measurement conditions. Finally, the obtained measurement data base corresponds to67 various 2−users configurations.
B. Channel Measurement Setup
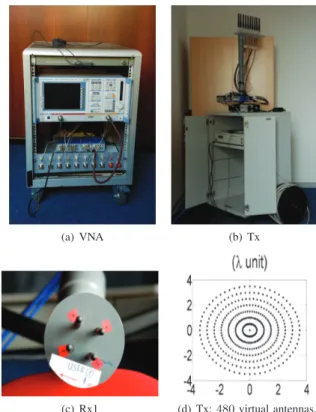
The MU-MIMO propagation channel is sounded using a Vector Network Analyzer (VNA) based on a frequency domain technique. We collect theS21parameter since the propagation
channel is the device under test. The VNA, depicted in Fig. 2(a), is connected by cables of10 m to the Tx and 20 m to each Rx. Hence, the maximum distance between the Tx and the Rx is 30 m. The VNA have probed 2048 frequency tones between 5.15 GHz and 5.40 GHz. This configuration permits a maximum propagation excess delay of8192 ns. This delay is well above the maximum propagation delay in such environment but it is useful to estimate the noise level of the measurement data for post-processing. The high number of frequency bins allows also to improve the dynamic of the Channel Impulse Response (CIR), which is between 20 dB and65 dB in our experiment.
We have used vertically polarized dipole antennas at the Tx and the Rx. The Tx is composed of 8 antennas arranged in Uniform Linear Array (ULA) spaced by λ/2. The trans-mitting antenna gain is5.13 dBi with 60 degrees of vertical beamwidth. Two additional transmitting antennas are located at both ends to have symmetrical coupling effects as can be seen in Fig. 2(b). The distance between the center of each transmitting antenna and the ground is 1.8 m. For each user as depicted in Fig. 2(c), four antennas are arranged in a square horizontal array with aλ/2 side. The receiving antenna gain is 1.6 dBi, and the distance between the antenna center and the ground is fixed to 1.1 m. The transmitting antennas are mounted on a rotating arm to measure different antenna geometries and to take into account fast fading effects as illustrated in Fig. 2(b). A rotation step of6 degrees is selected. We come up to a total of480 virtual transmitting antennas as shown in Fig. 2(d). For each position of the three devices, i.e. one Tx and two Rx, the channel is of dimension 480 × 8 for each subcarrier where 8 represents the total number of receiving antennas.
Two 8−to−1 switches at the Tx and the Rx respectively, are used to select the antennas. First, the channel is measured between the first transmitting antenna and the first receiving antenna by sweeping frequencies between 5.15 GHz and 5.40 GHz stepped by 122 kHz. The selected receiving antenna for measurement is then switched using the receiving switch. Afterwards, we select the second transmitting antenna using the switch at the Tx. Note that the switching time is 5 ms for switching at the Tx and the Rx . Finally, after the 8 × 8 switching steps, the rotating arm is turned by 6 degrees. We repeat the same processing till the rotating arm returns to the first position. It takes about20 min with the VNA to record one measurement consisting of 480 × 8 channel sweeps over 2048 tones. All equipment (switches, VNA and rotating arm) are controlled by one laptop and connected through Ethernet cables.
C. Post-Processing
The measured CIRs are afterwards calibrated using ref-erence measurements where the transmit and receive cables or switches are directly connected to the VNA Input-Output. For our analysis, the calibration takes into consideration the switches, the antenna connectors, and the cables.
(a) VNA (b) Tx
(c) Rx1 (d) Tx: 480 virtual antennas. Figure 2. Measurement equipment.
The collected CIRs have a dynamic arranged between 20 dB and 60 dB depending on whether the Rx is near or far from the Tx. The measurement noise level is estimated from the non physical delay area of the average Power Delay Profile (PDP). We force the corresponding CIR complex samples with an average power below this noise level to 0 and also the sample corresponding to a dynamic greater than 30 dB in order to process measurements with a comparable dynamic between 20 and 30 dB.
The IEEE 802.11ac OFDM signal is divided into sub-carriers with a subcarrier spacing equal to312.5 kHz. Since the indoor propagation channel is frequency flat on such a small bandwidth, we choose the first measured frequency sample to be the multiple of 122 kHz which is the closest to the subcarrier spacing of IEEE 802.11ac (312.5 kHz). We exploit multiple IEEE 802.11ac 20 M Hz subchannels (up to 10 bands for 250 M Hz probed by the VNA) as well as angular positions (up to 60 transmit angular positions) in order to have representative statistical results .
IV. EXPERIMENTALRESULTS
The measured data allows to study various types of trans-mitting antenna geometries. This article presents MU-MIMO results based on normalized and non-normalized propagation channels.
A. Impact of Transmitting Antennas considering a Normalized Channel
In this section, the effect of transmitting antennas (number and geometry of antennas) on MU-MIMO system with two
Figure 3. Average of MU-MIMO to SU-MIMO capacity ratio versus the number of transmitting antennas.
Figure 4. MU-MIMO and SU-MIMO capacity values.
receivers with two antennas each is analyzed based on a normalized channel. The reason of using the normalization is to keep only fast-fading effects so that the average Signal-to-Noise Ratio (SNR) at the receiving antennas is set to a fixed value and can be easily adjusted as a parameter. The applied channel normalization in this article implies that the average propagation loss is set to0 dB for both users [10]. The SNR is defined as SN R = EIRP/σ2
n whereEIRP = 23 dBm for
this study, and is set to20 dB. The aim is to assess the impact of transmitting antenna configuration on the BD capacity gain over SU-MIMO and to give recommendations to optimize MU-MIMO performance. To highlight the MU-MIMO capac-ity gain over SU-MIMO, most graphs below show the average of MU-MIMO to SU-MIMO capacity ratio. For 2 users, the optimal capacity gain value is2 [10] for TDMA system.
1) Number of transmitting antennas: Fig. 3 gives the average of MU-MIMO to SU-MIMO capacity ratio versus the number of transmitting antennas arranged in an ULA. It also includes 10% (q10) and 90% (q90) confidence intervals
as a reference. The first observation drawn from Fig. 3 is that the MU-MIMO capacity gain over SU-MIMO grows logarithmically with the number of transmitting antennas. It changes from 1.27 to 1.7 for the residential environment, i.e. around 43% of capacity gain. For 4 transmitting antennas, the quantile q10 of capacity gain is less than1. This can be
explained by the fact that we cannot benefit from transmit
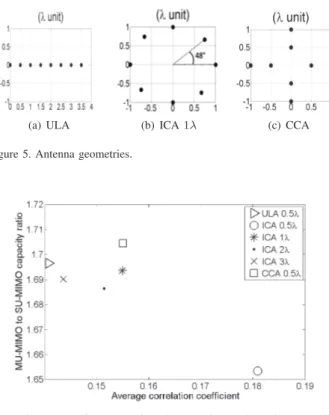
(a) ULA (b) ICA 1λ (c) CCA Figure 5. Antenna geometries.
Figure 6. Average of MU-MIMO to SU-MIMO capacity ratio versus the average correlation coefficient.
beamforming gain since the number of transmit antennas is the same as the total number of spatial streams.
Fig. 4 shows the average capacity values for MU-MIMO and SU-MIMO systems. The capacity value for MU-MIMO increases more rapidly than SU-MIMO. It achieves 24 bits/s/Hz versus 14 bits/s/Hz for SU-MIMO with 8 transmitting antennas. In order to optimize the MU-MIMO capacity gain and have a less congested system, we recommend using6 transmitting antennas in a system with two receivers and two antennas for each receiver. If we aim at reaching higher capacities, using 8 transmitting antennas allows2 bits/s/Hz of capacity increase.
2) Different antenna geometries for 8 transmitting
anten-nas: Before comparing the performance of MU-MIMO to SU-MIMO, we first define the analyzed antenna geometries. We evaluate a Tx with8 antennas arranged in ULA, Crossed Circular Array (CCA) with0.5λ spacing, and Irregular Circu-lar Array (ICA) with different radiuses as illustrated in Fig. 5. In Fig. 5(b), the antennas are placed on the same circle and 48 degrees is a multiple of the angular step of 6 degrees. Four radiuses are considered:0.5λ, 1λ, 2λ and 3λ. We denote them respectively: ICA 0.5λ, ICA 1λ, ICA 2λ, ICA 3λ. Note also that the results are presented based on the two-user channel correlation coefficient explored in [10].
Fig. 6 gives the average of MU-MIMO to SU-MIMO capacity ratio versus the average correlation coefficient. The highest MU-MIMO capacity gain over SU-MIMO is achieved with antennas arranged in CCA with relatively small corre-lation coefficient value. This confirms the results of [7] of reducing the span of an antenna array. All of the simulated geometries show small correlation. This is explained by the
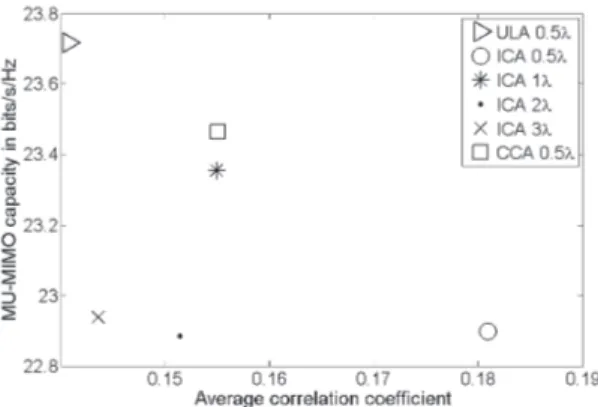
Figure 7. MU-MIMO capacity values versus the average correlation coefficient.
Figure 8. MU-MIMO to SU-MIMO capacity ratio versus ∆P .
number of the transmitting antennas [10]. In terms of capacity values, as in Fig. 7, we achieve 23.45 bits/s/Hz with the CCA geometry, which is very close to the highest one shown in the graph with ULA but with a greater span.
B. Non Normalized Channel using 6 transmitting antennas
arranged in ULA
In this section, we consider the propagation channel includ-ing its measured path loss on20 M Hz bandwidth. The EIRP is equal to23 dBm. The noise power is set to −93 dBm. The number of transmitting antennas is set to 6 arranged in ULA geometry. The SU-MIMO capacity is expressed considering the two channel access methods mentioned above: TDMA and CSMA/CA. We consider the average received power at each user indBm. Fig. 8 shows the average of MU-MIMO to SU-MIMO capacity ratio versus the difference of the received powers ∆P . We observe that when ∆P is below 15 dB, both channel access methods give almost the same results. Nevertheless, compared to SU-MIMO CSMA/CA method, it is advantageous to group users with larger ∆P and use MU-MIMO: the capacity gain can be greater than2. Actually, if C1 is very small compared to C2, then CSU,CSM A is
penalized byC1[11] which is not the case of CM U −M IM O.
We also notice that the capacity gain in all cases is higher than 60% in a 12m × 7m apartment with a 23 dBm EIRP. This proves the benefit of using the MU-MIMO method rather than
applying the classical eigen-beamforming of the SU-MIMO. V. CONCLUSION
We have investigated the impact of transmitting antenna geometry on the BD capacity gain for802.11ac MU-MIMO in home networks. The results are based on measured propagation channel for two users with two antennas each. We have given in this article recommendations to optimize MU-MIMO capac-ity in terms of number and geometry of transmitting antennas. We have also studied the advantage of path loss difference on the BD capacity gain over SU-MIMO. In particular, in a typical indoor apartment with a23 dBm EIRP, MU-MIMO is better than SU-MIMO based on CSMA/CA, the capacity gain goes beyond the double since SU-MIMO based on CSMA/CA is penalized when the gap between the received power of each user is high. Furthermore, we will perform a comparison between these results and the ones based on the MU-MIMO correlated channel model specified for802.11ac. Besides, the impact of the receiving antennas number might be analyzed.
REFERENCES
[1] K. Issiali, V. Guillet, G. El Zein and G. Zaharia, “Impact of EIRP Constraint on MU-MIMO 802.11ac Capacity Gain in Home Networks,” in Mediterranean Conf. On Inf. & Com. Techn. (MedICT), May 2015. [2] C. B. Peel, Q. H. Spencer, A. L. Swindlehurst, M. Haardt and B. M. Hochwald, Space-Time Processing for MIMO Communications
(chapter:Linear and Dirty-Paper Techniques for the Multi-User MIMO Downlink). Wiley, 2005.
[3] J. Lee and N. Jindal, “Dirty Paper Coding vs. Linear Precoding for MIMO Broadcast Channels,” in Asilomar Conf. on Signals, Systems
and Comp., ACSSC’06, 29 Oct.-1 Nov. 2006, pp. 779–783.
[4] A. Bouhlel, V. Guillet, G. El Zein and G. Zaharia, “Transmit Beamform-ing Analysis for MIMO Systems in Indoor Residential Environment Based on 3D Ray Tracing,” Springer Wireless Personal
Communica-tions, pp. 1–23, 2015.
[5] H. P. Bui, Y. Ogawa, T. Nishimura and T. Ohgane, “Performance Eval-uation of a Multi-User MIMO System With Prediction of Time-Varying Indoor Channels,” Antennas and Propagation, IEEE Transactions on, vol. 61, no. 1, pp. 371–379, Jan. 2013.
[6] F. Rusek, O. Edfors and F. Tufvesson, “Indoor multi-user MIMO: Measured user orthogonality and its impact on the choice of coding,” in European Conf. on Anten. and Propag. (EUCAP), March 2012, pp. 2289–2293.
[7] M. Fushiki, Y. Hatakawa and S. Konishi, “Experimental evaluations of multiuser MIMO with two-dimensional antenna configuration,” in
Wireless Com. and Mobile Computing Conf. (IWCMC), Aug. 2014, pp. 195–200.
[8] Y. Kakishima, T. Kawamura, Y. Kishiyama, H. Taoka and H. Andoh, “Indoor Experiments on 4-by-2 Multi-User MIMO Employing Various Transmitter Antenna Arrangements in LTE-Advanced Downlink,” in
IEEE Veh. Technol. Conf. (VTC Fall), Sept. 2012, pp. 1–5.
[9] J. Zheng, X. Gao, Z. Zhang and Z. Feng, “Performance examinations of Multi-User MIMO systems with a compact antenna cube,” in Antennas
and Propag. (APSURSI), 2011 IEEE Intern. Symp. on, July 2011, pp. 55–58.
[10] K. Issiali, V. Guillet, G. El Zein and G. Zaharia, “Impact of Antennas and Correlated Propagation Channel on BD Capacity Gain for 802.11ac Multi-User MIMO in Home Networks,” in WIreless Technologies,
embedded and Intelligent Systems (WITS), April 2015.
[11] M. Heusse, F. Rousseau, G. Berger-Sabbatel and A. Duda, “Per-formance anomaly of 802.11b,” in INFOCOM 2003. Twenty-Second
Annual Joint Conf. of the IEEE Comp. and Com. IEEE Societies, March 2003, pp. 836–843 vol.2.
[12] V. Guillet, “Over the air antenna measurement test-bed to assess and optimize WiFi performance,” in Anten. Measurements Applications