Science Arts & Métiers (SAM)
is an open access repository that collects the work of Arts et Métiers Institute of
Technology researchers and makes it freely available over the web where possible.
This is an author-deposited version published in: https://sam.ensam.eu Handle ID: .http://hdl.handle.net/10985/6519
To cite this version :
Yuan LIU, JeanPierre NIKOLOVSKI, Nazih MECHBAL, Moustapha HAFEZ, Michel VERGÉ -Tactile objects based on an amplitude disturbed diffraction pattern method - 2009
Any correspondence concerning this service should be sent to the repository Administrator : [email protected]
Tactile objects based on an amplitude disturbed diffraction pattern method
Yuan Liu,1,2Jean-Pierre Nikolovski,2,a兲 Nazih Mechbal,1Moustapha Hafez,2andMichel Vergé1
1
LMSP (CNRS 8106), Arts et Métiers ParisTech, 151 Boulevard de l’Hôpital-75013 Paris, France 2
CEA, LIST, Sensory Interfaces Laboratory, 18 Route du Panorama, 92265 Fontenay-aux-Roses, France 共Received 17 September 2009; accepted 25 November 2009; published online 23 December 2009兲 Tactile sensing is becoming widely used in human-computer interfaces. Recent advances in acoustic approaches demonstrated the possibilities to transform ordinary solid objects into interactive interfaces. This letter proposes a static finger contact localization process using an amplitude disturbed diffraction pattern method. The localization method is based on the following physical phenomenon: a finger contact modifies the energy distribution of acoustic wave in a solid; these variations depend on the wave frequency and the contact position. The presented method first consists of exciting the object with an acoustic signal with plural frequency components. In a second step, a measured acoustic signal is compared with prerecorded values to deduce the contact position. This position is then used for human-machine interaction共e.g., finger tracking on computer screen兲. The selection of excitation signals is discussed and a frequency choice criterion based on contrast value is proposed. Tests on a sandwich plate共liquid crystal display screen兲 prove the simplicity and easiness to apply the process in various solids. © 2009 American Institute of Physics.
关doi:10.1063/1.3276549兴
In their work, Ing et al.1,2 presented an acoustic time-reversal process for in solid localization of finger “impact.” Comparing with other acoustic approaches such as Rayleigh wave approach3,4 or time-of-flight techniques,5,6 the time-reversal technique can be applied to most solids without any prior knowledge of acoustic properties. However, many human-machine interfaces prefer “touch” sensing than im-pact localization, because touch is perceived as a more user-friendly interaction.7,8 Indeed, some modern interaction modes such as “multitouch”9 are difficult to achieve with “impacts,” since it requires generating several impacts simul-taneously on the tactile surface.
Recently, an alternative method based on the cross-correlation of selective absorption of the vibration modes has been presented.10 This process is suitable for static contact localization. However, this process based on an absorption technique cannot address some particular uses such as stylus tip localization. In that case, contact creates more diffraction effect of the propagating acoustic waves than absorption. In this letter, we propose a tactile process based on an ampli-tude disturbed diffraction pattern共ADDP兲 phenomenon of an impulse acoustic wave. It expresses the following physical phenomenon: a human finger共or stylus兲 in contact with the objects affects the acoustic wave propagation in the solid. These disturbances depend on the finger position and the frequency of excited signal. With analysis and a calibration procedure of this variation, we can locate precisely the con-tact position.
In the following examples, two emitters 共piezoelectric transducers Pz27 type by Ferroperm, Denmark兲 transmit re-petitive Lamb waves 共period 1 ms兲 in the solid Fig. 1. The excitation signals come from a Tektronix 3012 function gen-erator and are composed of 40 frequency components. These frequencies are uniformly distributed between 20 and 100
kHz with an interval of 2 kHz. When a human finger comes in contact with the object, after a short stabilization time, say less than 1 ms, the acoustic waves are measured with one or two piezoelectric receivers. Typically, acoustic signals are digitized with a Pico ADC 212/50 data acquisition card dur-ing a 4 ms time window at a sampldur-ing frequency of 195.31 kHz. A computer is used to drive the function generator and the data acquisition card. Signal processing and image ren-dering are carried out in the Matlab environment.
Analytically, the received acoustic signal r共t兲 can be ex-pressed as a function of emitted signal e共t兲, the object prop-erty and geometry G, the contact position P, and contact surface S at a given pressure
a兲Author to whom correspondence should be addressed. Electronic mail: [email protected].
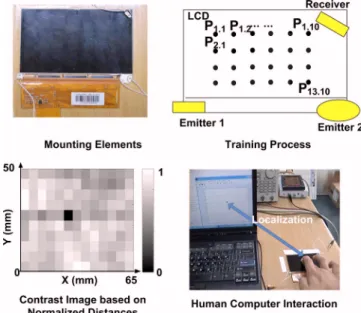
FIG. 1. 共Color online兲 Training step of the disturbed acoustic diffraction tactile process on a copper plate. 32⫻36 predefined positions are sequen-tially touched by an index; received reference signals from two PZT trans-ducers are stored according to the contact positions.
APPLIED PHYSICS LETTERS 95, 251904共2009兲
r共t兲 = F关e共t兲,G,P,S兴. 共1兲 The first step is a training step. The tactile surface of the object is divided into an array of predefined “contact points.” For a copper plate 100⫻75⫻0.45 mm3 large, 36⫻32
pre-defined points are sequentially touched by an artificial sili-cone finger. The contact surface, roughly 25 mm2, is assured by same contact pressure. The Fourier transform of received signal at each contact point Pi,jcan be expressed by Eq.共2兲 Ri,j共f兲 = F共E共f兲,G,Pi,j,S兲. 共2兲 In the following example, the E共f兲 and G are constants, as we maintain the same conditions during the training step. The variation of S is negligible, so we consider that the re-ceived signal r共t兲 is only function of contact position P
Ri,j共f兲 = F共Pi,j, f兲. 共3兲
In the second step, the user touches the copper plate, say at position P
⬘
. The measured acoustic signal r⬘
共t兲 is then com-pared with all stored training signals and an array of dis-tances is calculatedDi,j=
兺
f兩R
⬘
共f兲 − Ri,j共f兲兩. 共4兲 The contact position can be visualized on a figure represent-ing the normalized distances with a gray amplitude scale, as in Fig. 2. By using a recognition process of one measured signal among all the reference signals, we are able to find the position of contact.Compared to the acoustic time-reversal process in which the acoustic signal is produced from the finger impact, mean-ing the acoustic plate is passive, this method enhances an active acoustic plate featuring a process that continuously generates Lamb wave packets, 1000/s. This tactile technol-ogy is said “active” as regards Lamb wave generation, mean-ing excitation signals are fundamental to its reliability.
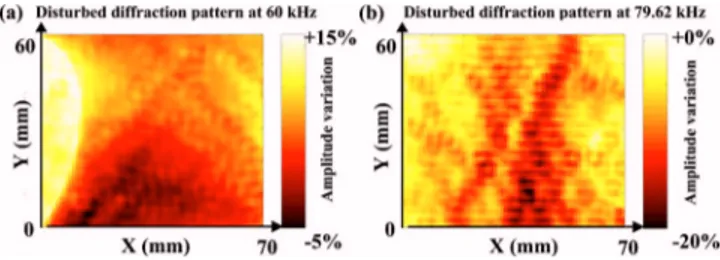
We define a disturbed diffracted pattern contrast value as criterion of frequency choice. For that matter which defines another step in the tactile process, the plate is excited with a sinusoidal signal and followed by 70⫻60 sequentially con-tacts on the surface with an interval of 1 mm. The recorded signals are compared with the original signal obtained with-out contact. Figure3 shows disturbed diffraction patterns at two different frequencies, one at 60 kHz, nonresonant, the other at 79.620 kHz, resonant. Images reveal different con-trast features which is quantified with the concon-trast value for-mula.
Beforehand we calculate with Eq.共5兲 the mean deriva-tive values of ADDP in the neighborhood of each contact
point, except at boundaries. The neighborhood consists of eight neighboring points surrounding the point of interest
di,j共f兲 =
兺
m=i−1 i+1兺
n=j−1 j+1 兩Rm,n共f兲 − Ri,j共f兲兩/关8 ⴱ Ri,j共f兲兴. 共5兲 Then a mean derivative contrast value C共f兲 for the entire ADDP image is calculated for one frequency which yieldsC共f兲 =
兺
i=2 69兺
j=2 59 di,j共f兲/共58ⴱ68兲. 共6兲 Applied to Fig. 3, the contrast values are 0.0134 at 60 kHz and 0.0247 at 79.62 kHz. This indicates that the ADDP is more spatially contrasted at resonance frequency. Uneven ADDP is not suitable for several reasons.First, ADDP at resonance frequencies depends a lot on boundary conditions of the object and also changes with am-bient temperature variations. This would make it difficult to ensure process reliability even if frequency shifts due to tem-perature variations can be calculated and compensated.11 However, it is not the case with boundary condition varia-tions which cannot be predicted and compensated.
Second, at resonance frequencies, as ADDP is highly inhomogeneous and spatially redundant, as shown in Fig.
3共b兲, many areas have the same amplitude variation values. As a consequence, it becomes difficult to clearly identify the contact position among several other eligible contact points. Intermediate C共f兲 values are associated with more regu-lar ADDP which allow establishing a relationship between an amplitude signal variation and a contact point.
Very small C共f兲 values are not suitable either, because it means uniform ADDP and then an impossibility to discrimi-nate one contact position from the other.
As a consequence, nonresonant intermediate C共f兲 values is the best criterion to validate a particular frequency. We propose a maximum threshold value of 0.02 and a minimum threshold value of 0.01, which have been tested and vali-dated in our experiments with a copper plate and a liquid crystal display共LCD兲 screen; however, these values may be adjusted according to the situation.
Once a particular frequency is selected, we propose a criterion based on correlating a prospective ADDP to previ-ously selected ones, to find out if adding another frequency f
⬘
helps improving the localization resolution. Following previous criterion, that frequency should first have a medium C共f兲 value, then, its associated ADDP spatial distribution should be significantly different from all previous ones, be-cause otherwise it would give similar information as regards discrimination of the contact point. Consequently, if there are already N frequency components in the excitation signal, theFIG. 2. Contrast images based on the normalized distances from one refer-ence signal to all others. The contact position appears in black. Neighboring points exhibit small distances which implies a limit to the spatial resolution of the learning process.
FIG. 3. 共Color online兲 ADDP based on relative amplitude variations accord-ing to the contact positions. With 共a兲 an emission signal at an arbitrary frequency 60 kHz; or共b兲 at a resonance frequency 79.620 kHz.
choice of adding a frequency component will depend on the value of a formula expressing the global correlation value between one prospective ADDP to all the others.
The correlation function between two ADDP is ex-pressed by Corr 关ADDP共f1兲 and ADDP共f2兲兴. Then global non correlation value共GNC兲 is expressed by the formula
冦
GNC共0兲 = 1, GNC共N + 1兲 = GNC共N兲ⴱ2Nⴱ兿
i=1 N 关1 − Corr共fi, f⬘
兲兴.冧
共7兲 Where GNC共N+1兲 is the revised value of GNC after adding a frequency. An additional frequency is accepted if the re-vised GNC value stays above 0.5.Amplitude variations of acoustic signals are analyzed to make fuzzy partitions of the tactile surface and to indicate which part of the object is touched by the finger. If different frequencies have different ADDP as shown in Fig.4, we can combine several fuzzy partitions to go back to the exact po-sition of contact with a high spatial resolution.
This ADDP tactile method is completely different from the absorption method1in previous work. Indeed, the absorp-tion method is based on amplitude variaabsorp-tions at resonance frequencies. With this method, working at resonance fre-quency is almost necessary because amplitudes of signal variation are easier to measure with thick materials. In this work we use only nonresonant frequencies as they have lower contrast values C共f兲.
Our tactile process has been tested with different objects, such as glass plates, curved copper shells, or the upper layer of LCD screen. Figure 5 共video兲 illustrates the process
ap-plied to a 4 in. LCD screen. We use two emitters and one PZT receiver, all arbitrary shaped. 13⫻10 predefined tactile points are calibrated in the training step, a matrix of refer-ence signals is then obtained.
The acoustic wave emitters and the receiver are placed on different layers, thus the acoustic waves propagate through the whole solid before being measured. This touch screen has a response time lower than 10 ms. As a mean of
comparison, a time reversal process requires as many bound-ary reflections as possible to increase reliability and then a longer time window in order to digitize and cross-correlate acoustic signals. It is therefore more time consuming. With the presented ADDP method, a 4 ms acquisition window is enough.
In this letter, a tactile acoustic process based on ADDP is proposed and tested to transform various solids such as metal plates or LCD screens to real-time, drag-and-drop capable interactive objects. A method to select the frequency of the excitation signals is suggested. It is based on the calculation of normalized distances and selects preferably nonresonant frequencies. It requires simple signal processing and its effi-ciency in various solids has been proved. As it is derived from a time reversal approach, both methods share almost the same advantages and the same physical limitations. How-ever, this active method allows the use of simple finger touch, which constitutes a real advance compared to previous work in state of the art.
1R. K. Ing, N. Quieffin, S. Catheline, and M. Fink,Appl. Phys. Lett. 87, 204104共2005兲.
2R. K. Ing, N. Quieffin, S. Catheline, and M. Fink, J. Acoust. Soc. Am.
117, 2560共2005兲.
3R. Adler and P. Desmares, IEEE Trans. Ultrason. Ferroelectr. Freq. Control 34, 195共1987兲.
4R. Johnson, U.S. Patent No. 3,673,327共1972兲.
5J. P. Nikolovski and D. Royer, Proc.-IEEE Ultrason. Symp. 1, 699共1997兲. 6E. Dieulesaint, D. Royer, and O. Legras, French Patent No. FR8903074,
Publication Nb: 2 644 309共1989兲.
7K. Nicol and E. M. C. Hennig, U.S. Patent No. 4,134,063共1979兲. 8S. Malik and J. Laszlo, Proceedings of the 6th International Conference
on Multimodal Interfaces共State College, PA, USA, October 13–15, 2004兲, Vol. 1, p 289.
9W. Westerman and J. G. Elias, U.S. Patent No. 6,323,846共2001兲. 10R. K. Ing, J. P. Nikolovski, D. Cassereau, and M. Fink,J. Acoust. Soc.
Am. 123, 3643共2008兲.
11G. Ribay, S. Catheline, D. Clorennec, R. K. Ing, N. Quieffin, and M. Fink, IEEE Trans. Ultrason. Ferroelectr. Freq. Control 54, 378共2007兲. FIG. 4.共Color online兲 Fuzzy partitions at different frequencies. Large
num-ber of diversified partitions makes it possible to find out a precise position of contact.
FIG. 5. 共Color online兲 Application of the disturbed diffraction pattern tactile method to a LCD screen. The map of normalized distances shows clear distinction between adjacent points 共enhanced online兲 关URL:
http://dx.doi.org/10.1063/1.3276549.1兴.