HAL Id: hal-02384256
https://hal.archives-ouvertes.fr/hal-02384256
Submitted on 2 Dec 2019
HAL is a multi-disciplinary open access
archive for the deposit and dissemination of
sci-entific research documents, whether they are
pub-lished or not. The documents may come from
teaching and research institutions in France or
abroad, or from public or private research centers.
L’archive ouverte pluridisciplinaire HAL, est
destinée au dépôt et à la diffusion de documents
scientifiques de niveau recherche, publiés ou non,
émanant des établissements d’enseignement et de
recherche français ou étrangers, des laboratoires
publics ou privés.
Modelling and experimental validation of a small-scale
trigenerative compressed air energy storage system
Mohamad Cheayb, Mylène Marin Gallego, Mohand Tazerout, Sébastien
Poncet
To cite this version:
Mohamad Cheayb, Mylène Marin Gallego, Mohand Tazerout, Sébastien Poncet. Modelling and
ex-perimental validation of a small-scale trigenerative compressed air energy storage system. Applied
Energy, Elsevier, 2019, �10.1016/j.apenergy.2019.01.222�. �hal-02384256�
Contents lists available atScienceDirect
Applied Energy
journal homepage:www.elsevier.com/locate/apenergy
Modelling and experimental validation of a small-scale trigenerative
compressed air energy storage system
Mohamad Cheayb
a,b, Mylène Marin Gallego
a, Mohand Tazerout
a, Sébastien Poncet
b,⁎aCNRS Joint Unit GEPEA, Department of Energy Systems and Environment, IMT Atlantique, Nantes, France bMechanical Engineering Department, Université de Sherbrooke, Sherbrooke, QC, Canada
H I G H L I G H T S
•
A thermodynamic model of a simple trigenerative-CAES is developed.•
The model is validated experimentally.•
The performances of the simple configuration are assessed.•
Technological issues on the trigenerative CAES are highlighted. A R T I C L E I N F OKeywords:
Compressed air energy storage Trigeneration
Thermodynamic modelling Industrial pilot unit Air motor
A B S T R A C T
New advances in compressed air energy storage systems have been recently made especially regarding the use of heat generated from compression. On this basis, the concept of the trigenerative compressed air energy storage (T-CAES) has recently been proposed. Many studies highlighted the feasibility and the benefits of this system to be placed close to the energy demand.
The aim of this study is to examine a simple configuration of this system by a coupled experimental/mod-elling approach. This paper presents a detailed thermodynamic model of both the main components and the whole system. An experimental bench is used to validate the model and to investigate the effect of the operating parameters on the system efficiency and the model accuracy.
The model predictions are consistent with the experimental measurements during the charge, storage and discharge phases. It has been found that the temperature drop across the pressure regulator should not be ignored and is governed by the Joule-Thomson effect. Besides, it has been observed that the input temperature of the air motor must be accounted for in the assessment of future improved configurations.
It was noted that the system efficiency increases significantly by adding the cooling and heating potentials.
However, the round trip efficiency remains low at 15.6%. Output values of the model are in good agreement
with the experimental results with an error less than 13.2%. The model can be applied as a basis for the
per-formance assessment of prospective configurations and improvements of trigenerative compressed air energy
storage.
1. Introduction
Growth in energy demand around the world would require an in-crease in the consumption of fossil fuels [1]. In order to deal with economic and environmental problems related to fossil fuels, the major current research focuses on integrating renewable energy resources (RES) [2]and promoting a new energy transition[1]. However, the inherent intermittent renewable energy generation is a central chal-lenging issue to be solved[2].
Electrical energy storage (EES) is becoming a vital aspect to ensure the balance between energy production and demand[2–5]and to deal with the intermittent nature of solar or wind energy sources. Moreover, in off-grid sites, EES appears as a key component to achieve a sufficient penetration of renewable energy resources [6,7]. As an example, in Québec, where electricity is cheap (7 cents/kWh in average) and pro-duced at 97% from hydroelectric dams[8], the major issues to be faced arefirstly the shift between production and demand for both cooling and heating and secondly the presence of remote communities in the
https://doi.org/10.1016/j.apenergy.2019.01.222
Received 3 August 2018; Received in revised form 15 November 2018; Accepted 26 January 2019
⁎Corresponding author.
E-mail address:[email protected](S. Poncet).
Applied Energy 239 (2019) 1371–1384
Available online 14 February 2019
0306-2619/ © 2019 Elsevier Ltd. All rights reserved.
North of the province, which do not have access to the main electrical network. In these communities, replacing diesel power station by EES appears as a particularly interesting solution, due to the large amount of available wind or solar.
Several EES such as pumped hydroelectric (PHS), compressed air energy storage (CAES), thermal energy storage (TES), chemical or electrochemical batteries,flywheel, capacitor and supercapacitor have been developed so far. Chen et al. [4]and Luo et al.[5]carried out detailed reviews of the main characteristics of each technology. Each system has certain advantages and limitations based on efficiency, en-ergy density, power range, time of response and investment cost[5]. The suitable technology depends mainly on its application.
Among EES technologies, PHS is the most widely implemented. It is technically mature with good efficiency (70–85%), long storage time and a more than 40 years lifetime [5]. Besides PHS, compressed air energy storage (CAES) has a strong potential due to its high reliability
[9,10], low capital and maintenance costs and good part-load perfor-mance[9,11]. In their recent review, Wang et al.[12]stated that PHS and CAES technologies exhibit rather similar characteristics in terms of scale and cost, while CAES is not so restricted to suitable geological locations.
The thermodynamic process in a conventional CAES (or Diabatic CAES) may be described as follows: during the period of excess energy production, ambient air is compressed via a multi-stage compressor with intercooling to increase the compression efficiency and the energy density[7,9]. Compressed air is stored in underground reservoirs such as saline dome caverns, porous rock formation or old mines[11,13]. During the period of high energy demand, the mechanical energy is converted again into electrical energy by expansion. Stored air is re-leased, heated by means of combustion before expanding into the gas turbine to generate electricity. The main drawback of D-CAES is the low round-trip efficiency which is around 42% for the Huntorf’s plant (Germany) and 54% for the McIntosh’s plant (USA)[9].
In order to overcome this limitation, the concept of adiabatic
compressed air energy storage (A-CAES) has been proposed. The main feature of A-CAES is to recover heat produced during compression to preheat the air during expansion, hence it eliminates the need for fossil fuels and promotes a cleaner technology. The main demonstration projects are the ongoing European project“ADELE-ING”[14], the pilot plant“TICC-500” designed by the Chinese Academy of Sciences[10]
and recently the pilot scale of underground A-CAES developed in Switzerland[15,16].
CAES is mainly applied to large-scale applications (tens or hundreds of MW). Recently, CAES using overground pressure vessel reservoir has been proposed[7,17]which enables to apply CAES at a smaller scale and closer to energy demand[18]. Besides, it has been demonstrated that CAES enables the cogeneration of heat and cooling demand so that the concept of T-CAES has been introduced[18–30].
For small scale applications, electrochemical batteries remain the most popular technology for EES and cogeneration plants such as ab-sorption chiller for heating/cooling production. By contrast, those technologies entail using toxic materials (such as LiBr in absorption chiller), chemical wastes (Li in batteries) that remain for a long time
[4,19]and batteries have been suffering from low lifetime[4]. Faced with this situation, CAES is considered as a very promising alternative solution to batteries for energy storage in remote areas [7,20] and especially small scale Trigenerative-CAES (T-CAES) to replace diesel power stations used by small housing groups. The literature on T-CAES is scarce[18–30]and mainly limited to large scale systems. Thus, it is worthwhile to put forward more studies on small scale T-CAES. The present work is besides part of a joined research project undergoing in IMT Atlantique (France) and Université de Sherbrooke (Canada) dedi-cated to the implementation of small scale T-CAES in a remote com-munity in the North of Québec.
Despite the difference between A-CAES and T-CAES in terms of preheating energy, technical and technological aspects, the thermo-dynamic and thermal modelling and analysis approach are similar.
Start with A-CAES, extensive studies have been conducted in recent Nomenclature
T temperature (°C) P pressure (bar)
Cp heat capacity (kJ kg−1°C−1)
r ideal gas constant (J K−1kg−1)
n polytropic coefficient
βc compression ratio
βe expansion ratio
Ẇ power (kW)
ṁ massflow rate (kg s−1) ε heat exchanger effectiveness ms masse stored (kg)
V volume (m3)
t time (s)
Nc number of compression stages
Nres number of storage tanks
Nu Nusselt number Ra Rayleigh number
h heat convection coefficient (W m−2K−1)
H height (m)
e thickness (m) D internal diameter (m)
Rth thermal resistance (W−1m K)
λ thermal conductivity (W m−1K−1)
μT Joule Thomson coefficient (°C/bar)
η efficiency
COP coefficient of performance
ηg comprehensive efficiency
Subscripts
c compression
e expansion
i stage number i or heat exchanger i out output in input d expansion valve el electrical m mechanical th thermodynamic
th,m thermodynamic to mechanical conversion l,tes cold thermal energy storage
h,tes hot thermal energy storage
ch charge
dis discharge
a air
w heat transfer medium res air reservoir max maximum pressure min minimum pressure
CAES compressed air energy storage A-CAES adiabatic CAES
T-CAES trigenerative CAES TES thermal energy storage AM compressed air motor I.DIS.S initial discharge state
years. A comprehensible and detailed literature review on the different concepts of CAES is conducted by Budt et al. [21]. Kim et al. [22]
carried out an energy and exergy analysis of different configurations of CAES to characterize each system. Hartman et al.[23]concluded that the efficiency of the polytropic configuration is at 60% higher than the adiabatic one of 70%. Budt and Wolf[24]pointed out that the tem-perature level of TES does not affect the ideal round-trip electrical ef-ficiency and they proposed a novel A-CAES with low-temperature thermal storage which is lower than 200 °C. Following this study, Luo et al. [11]modelled the components of the system and mainly in-vestigated on the effect of the efficiency and number of stages of compressors and turbines and the heat transfer rates of heat exchangers. The authors found a maximum value of 60% for the electric efficiency. Grazzini and Milazzo [25]identified a set of criteria optimizing the
design of A-CAES with focus on heat exchanger parameters. Thefirst experiment on A-CAES was published by Wang et al.[10], their system is at medium scale of 500 kW input and 315 kW power output, it was designed with 5 compression stages, 3 expansion stages, pressurized water as TES at a temperature of 120 °C and an overground steel air reservoir as compressed air storage. Their experimental results showed an electric efficiency of 22.6% which is lower than the designed of 40.7%. In addition, the dynamic variation of the most relevant oper-ating parameters were reported. A focus on the underground pilot is reported in Refs.[14,15]. Geissbühler et al.[15]experimentally eval-uated the effect of cycle of air charging/discharging on an unused tunnel as a compressed air reservoir. Becattini et al.[16]studied nu-merically and experimentally a combined sensible/latent TES system composed of stainless-steel tubes encapsulating an Al–Cu–Si alloy.
With regard to trigenerative-CAES, T-CAES has been studied at large scale with the intent to provide district heating and cooling. In this scope, Arabkooshar et al.[26]applied this concept to a wind farm of 300 MW power capacity. It was proven the potential of their proposed configuration to support district heating and cooling networks. The values of power to power, power-to-cooling and power-to-heat effi-ciencies of this system were 30.6%, 32.3% and 92.4%, respectively. Han and Guo[27]derived a configuration from A-CAES (with 80 MW power input and 100 MW power output) enabling to produce cooling energy from the last stage and distribute the excess of heat as heating energy. A variable expansion ratio was proposed to increase the electric efficiency which attained 44.5%.
Furthermore, Jannelli et al.[19]proposed a T-CAES for a small scale stand-alone photovoltaic power plant with 3.7 kW electric com-pressor input and 1.7 kW expander electric output. The system was able to satisfy the energy demand in terms of electricity and cooling for a radio base station with an electric efficiency of 57% and a performance
coefficient COP of 0.62. Facci et al.[18]proposed and studied a con-figuration of T-CAES to fulfill the needs of a power peak shaving for energy users with an electric power of 18 kW. The results proved the adaptability of the system for civil applications with an efficiency of 30%, besides they dissected the effect of design and operating para-meters via a sensitivity analysis, and addressed also the technological issues and technical constraints. Lv et al.[29]applied a thermodynamic model to evaluate the energy and economic performance on a monthly basis of T-CAES based on electrical energy peak load shifting for a hotel. The results, which are not confirmed experimentally, show that the trigeneration system works efficiently at relatively low pressure, and the efficiency can reach 76.3% at 15 bars. The T-CAES technology can represent an annual monetary cost saving of about 53.9%. Liu et al.
[30]introduced a configuration of T-CAES and focused on discharge
process formed by a scroll expander. They measured its polytropic ex-ponent as a function of the ambient temperature and discussed the ef-fect of expansion ratio and maximum storage pressure on the perfor-mances of the system. Li et al.[19]presented a novel tri-regenerative system able to meet the end’s user demands in terms of electricity, cooling and heating of a small office building in Chicago with a max-imum power of 52 kW. A global storage electric efficiency of 50% was achieved.
The different values of electric efficiency ranging from 30% to 57% in the above studies relies on how the heat stored is used and the choice of the design parameters such as the number of compression stage, the compression and expansion ratio, heat exchanger effectiveness…etc. Those results show that this generation of CAES has a good efficiencies and has a competitive performance index compared to conventional tri-generation systems[19].
Most of the literature mentioned above related to CAES focuses on theoretical modelling, parameter optimization and system configura-tions of T-CAES or A-CAES (see the review of Wang et al. [12]). Available experimental studies [10,14,15] concentrate on validating numerical models of sub-systems or showing the real behavior of the system. As an illustration, Geissbühler et al.[15]and Becattini et al.
[16]focused on the experimental validation of numerical models de-veloped for compressed air in cavern and thermal energy storage. In the second place, experimental data reported by Wang et al.[10]are in-sufficiently correlated with the developed models. Moreover, these experimental data concerns medium scale CAES, whereas very few experimental studies are focused on micro or small scale CAES. The present paper is an attempt tofill this gap.
In this work, an accurate causal steady-state model (input/output modelling) of a simple configuration of T-CAES is developed with a focus on airside components. Experimental small-scale pilot (4 kW
compressor’s power and 2 kW expander’s power) is described. Then, the model is validated experimentally by paying a careful attention to each component. To the best of the author’s knowledge, the present work is thefirst combined thermodynamic/experimental approach for a small scale CAES, which is a necessary step towards the implementation of CAES in remote communities.
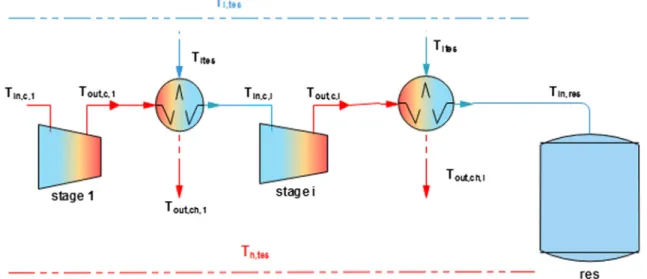
2. Modelling of the compressed air energy storage process CAES principle is divided into three phases: (1) charge or com-pression phase, (2) storage phase and (3) discharge or expansion pro-cess. Since the optimal system configuration is beyond the scope of this article and we focus on the thermodynamic modelling and its experi-mental validation, the proposed configuration remains relatively simple. It is based on the early commercialized configuration proposed by Energetix group (UK)[31]and that studied by Liu and Wang[30]. Heat removal from the compression is expected to fulfil the heating demand rather than reheat the expander during the discharge phase.
Figs. 1 and 2show the scheme of the proposed configuration during the charge and discharge phases, respectively.
The six main components of T-CAES are compressors, heat ex-changers, storage tank, regulation valve, expander and thermal energy storage. In this section, we present a detailed model of each component (except for TES).
A steady state approach is considered during the charge and dis-charge phases. The perspective of this study is to use this model for assessment of performances of prospective configurations and im-provements of T-CAES. A steady state approach allows a fast calculation time so it can be easily use in an optimization procedure. Furthermore, the next section will show that results are in good agreement with the current experimental performances. In order to reduce the modelling complexity, the following assumptions are introduced:
1. Pressure losses at the admission, through the discharge valve, and in the heat exchangers are not considered.
2. Compressed air is considered as a perfect gas, except in the reg-ulating valve.
3. Constant global compression ratio is considered.
2.1. Modelling of the charge phase 2.1.1. Compressors
Volumetric compressors are suitable for limited massflow rates and high-pressure ratios[32,33], and so are the most suitable compressors for our system. As mentioned above, multi-stage compression is needed to reduce the specific energy consumption for a certain air mass to be stored.
Though dynamic compressors whose efficiency reflects the internal heat and the isentropic term are the most commonly used, volumetric compressors are characterised by some amount of heat lost to the en-vironment which is implicitly expressed by a polytropic coefficient
<
nc γ.Thus, the output temperature of each stage is written as:
= − Tout c i, , Tin c i, ,.βc,i nc i nc i, 1 , (1)
whereβcis the compression ratio.
Thermodynamic work of one compression stage is calculated by integrating d P V( . )throughout the thermodynamic cycle which gives:
= − − W n n 1.m r. . [T .T ] th c i c i c i c out c i in c i , , , , , , , , (2) The thermodynamic power of one compression stage is deduced from Eq.(2)by introducing Eq.(1)and expressing the ideal gas con-stant as a function of heat capacity:
= − − ⎡ ⎣ ⎢ − ⎤ ⎦ ⎥ − W γ γ n n m C T β ̇ 1 1. ̇ . . . 1 th c i c i c i c p a in c i c , , , , , , , nc i nc i, 1 , (3) Input temperature of each stage depends only on the previous compression stage output temperature and previous heat exchanger. Heat exchanger effectiveness is defined by:
= − − + ε T T T T i out c i in c i out c i amb . , , , 1 , , (4) By reformulating Eq.(4): = + + Tin c i, , 1 Tamb ΔTi (5) = − − T ε T T
where Δ i (1 i)( out c i, , amb) (6)
Consequently, the input temperatures of the compressors are equal to the ambient temperature plus a value TΔ i, which expresses the effect
of heat exchanger effectiveness.
Adding the electrical efficiency and mechanical efficiency, and re-placing Eq.(6)in(3), the total electric power consumption forNcstages
is calculated as:
∑
= − − ⎛⎝ + − ⎞⎠ = − − W η η C m γ γ n n T T β ̇ 1 . .. . ̇ . 1 1 ( Δ ). 1 el e m p a c i Nc c i c i amb i c , 1 , , 1 ,i nc i nci, 1 (7) However, the electric power is delivered by renewable energy re-sources and it is imposed as an input parameter, so that the massflow rate is the output value. It is derived from Eq.(7)as:= ∑ ⎛ ⎝ + − ⎞⎠ = − − − − m η η W C T T β ̇ . ̇ . ( Δ ). ( 1) c e m el p a iNc γγ n n amb i c , 1 1 1 1 ,i c i c i nc i nci , , , 1 (8) 2.1.2. Air tank
The minimum pressure of the air storage is limited by the operating pressure of the air motor, thus a residual amount of air remains in the reservoir:
=
m N P V
r T.
residual res min res
res (9)
The air mass that could be stored is limited by the maximum pres-sure allowed in the storage tank and calculated by Eq.(10)using the ideal gas law. Furthermore, during the charge phase it is assumed that the temperature into the tanks is uniform. In other words, the tem-perature into a tank is the same as at the entrance of the tank:
= Tres Tin res, . = − m N P P V r T ( ). .
s res max min res
in res, (10)
The time required to completely charge the reservoir is calculated by:
= t m ṁ ch s c (11) 2.1.3. Heat exchangers
It is known that countercurrent heat exchangers have a better per-formance than concurrent heat exchangers so this type of heat ex-changers has been selected for this study. The thermal energy generated from compression is transmitted from the heat source (compressed air) to the heat sink, which is the heat transfer medium. The energy balance equation for each heat exchanger i writes:
= − + = −
Q̇ch i, m Ċ .c p a,. (Tout c i, ,, Tin c i, , 1) ṁh w, .Cp w, . (Tout ch i, , Tltes) (12) where w designates the heat transfer medium and the right side of the equation represents the heat absorbed by it. Tltes denotes the
tempera-ture of the incoming coolingfluid considered at the ambient tempera-ture.
Eq.(12)indicates that the thermal power can be computed from the air side. The total thermal energy that could be stored is calculated by:
∑
= − = = + Qs m Ċ . . (T T ).t i i Nc c p a out c i in c i ch 1 , , , , , 1 (13)2.2. Modelling of the storage phase
It should be noted that the reservoir insulation is not expected to account for the increasing energy density for a given storage pressure. Heat transfer between the environment and the compressed air occurs for any phase. Consequently, the air storage temperature and pressure variation are accounted for only during the storage phase. The fol-lowing assumptions are made:
1. The heat capacity of the compressed air is constant, independently of the pressure variation.
2. The temperature gradient inside the storage tank is negligible. 3. The thermal resistance of the wall thickness is negligible compared
to that due to natural convection.
Heat transfer to the environment induces a decrease of the air sto-rage temperature, which results in:
= − m C N dT dt T T R ( ) s pa res amb th (14)
Thefirst order differential Eq.(14)is solved. The time-temperature variation is expressed by Eq.(15.a)and the pressure is computed simply
by the ideal gas law:
= + = − − T t( ) Tamb (T(t 0) Tamb)e Nres t ms Cpa Rth . . . (15.a)
However, the ambient temperature may vary with time. In this case, by discretizing time, the new solution gets:
= − + − − − − − T(tj) Tamb t(j ) (T(tj ) Tamb t(j ))e Nres t ms Cpa Rth j ( ) ( 1) ( 1) ( 1) . . . ( 1) (15.b) The average thermal resistance of the natural boundary layer is defined as: = + R hπ D d H 1 ( 2 ) tha (16) The average heat convection coefficient for a cylinder is defined as: =
h λ Nu H
a (17)
where H is the height of the cylinder and Nu is the Nusselt number expressed by the empirical formula reported by Bejan[34].
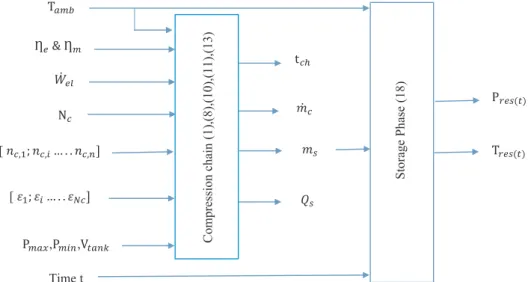
= ⎡ ⎣ ⎢ + ⎤ ⎦ ⎥ + + + Nu Ra Pr Pr Pr Pr D 4 3 7. . 5. (20 21. ) 4. (272 315. )H 35. (64 63. ). H 0.25 (18) To sum up,Fig. 3presents the block diagram of the mathematical model of the charge phase.
2.3. Modelling of the discharge phase
In the same way, as for the charge phase, the discharge time can be calculated by: = t m ṁ dis s e (19) 2.3.1. Pressure regulator
The physical law that governs the pressure reduction (throttling of compressed air) is the Joule-Thomson Law on which the enthalpy re-mains constant and the internal energy decreases as:
=
U PV
Δ Δ (20)
The majority of CAES modelling has considered compressed air as an ideal gas throughout this component which leads to constant tem-perature. However, this assumption is no longer true when the pressure reduction magnitude is important. Temperature variation may be ex-pressed by the Joule-Thomson coefficient:
= ⎛ ⎝ ∂ ∂ ⎞⎠ μ T P T h (21)
In order to find the isenthalpic curves and evaluate their slopes given by μT, experiments were conducted by Hoxton [35]. This last
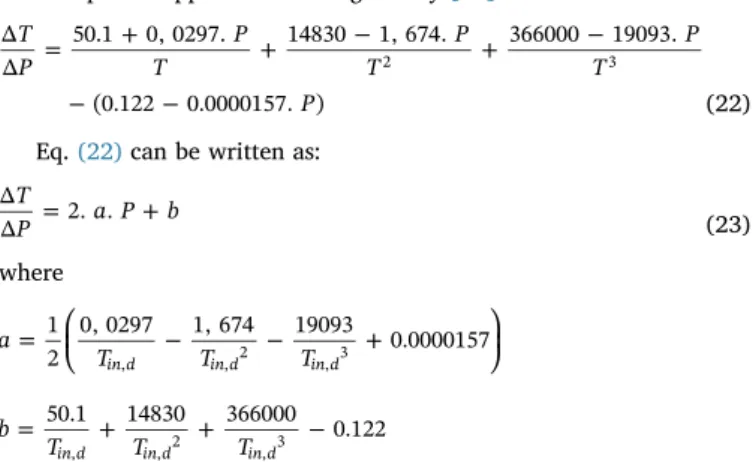
author covered a wide range of pressure (from 25 atm to 150 atm). His semi-empirical approximation is given by[35]:
= + + − + − − − T P P T P T P T P Δ Δ 50.1 0, 0297. 14830 1, 674. 366000 19093. (0.122 0.0000157. ) 2 3 (22) Eq.(22)can be written as:
= + T P a P b Δ Δ 2. . (23) where ⎜ ⎟ = ⎛ ⎝ − − + ⎞ ⎠ a T T T 1 2 0, 0297 1, 674 19093 0.0000157 in d, in d, 2 in d,3 = + + − b T T T 50.1 14830 366000 0.122 in d, in d,2 in d, 3
Temperature variation versus pressure is obtained by integration of Eq.(23).
= + +
T P( ) a P. 2 b P. c (24)
where c accounts for the family of isenthalpic curves and is calculated by:
= − −
c Tin d, a P. in d, 2 b P. in d, (25)
2.3.2. Air motor (AM)
For small-scale applications, the choice of the best expander tech-nology among the volumetric (piston, scroll)[36,37] or the even re-cently developed high-speed axial turbines[38]still remains an open research issue. Scroll machines exhibit higher performances [9,36], whereas they are restricted to small pressure ratios without handling high values of pressure and temperature[38]. On the other hand, piston expanders may be advantageous for CAES application where high-pressure input would be expected thanks to their low prices. In this perspective, the present study tested piston expander regardless of the fact that commercially available piston air motor (AM) are designed for maximum pressure input of 8 bar.
By analogy with compression, the output temperature and the thermodynamic power of the ideal expansion cycle are obtained as
follows: = − Tout e, Tin e,.βd ne ne 1 (26) = − − ⎡⎣ − ⎤⎦ − W γ γ n n m C T β ̇ 1 1. ̇ . . . 1 th e e e e p a in e e , , , ne ne 1 (27) whereβe=P P in e a , .
In order to account for the deviation between real and ideal ther-modynamic cycles and also mechanical losses, the therther-modynamic or pneumatic mechanical efficiency is introduced:
= = η η η W W . ̇ ̇ th m m th m e th e , , , (28)
Mechanical shaft power and massflow rate variations versus shaft rotation speed are generally provided for each operating pressure by the manufacturer. Thus, shaft power curves versus massflow rate can be deduced. By polynomial interpolation of the function Ẇm e, ( ̇ ,m Pin), the thermodynamic-mechanical efficiency is obtained via Eq.(28).
Finally, accounting for the electrical efficiency, the electrical power can be calculated as:
=
Ẇel e η .η .Ẇ
el e th m th e
, , , , (29)
Fig. 4shows a block diagram of the discharge phase model. Input
pressure and temperature of the expansion valve are equal to those of the air tank and decrease with time. However, as mentioned above, the present study is limited to a time-independent model. Therefore the model of each component is validated separately by experimental tests and an average value of the input temperature of the air motor is taken into account to validate the whole model for the discharge phase. 2.4. Performance criteria
T-CAES is not a simple technology, it has several roles such as an electrical storage technology and meets heating and cooling demands. In order to assess this system, the round trip electrical efficiency or simply the electrical efficiency and other performance index have been used. They are defined as follows:
= = η E E W t W t ̇ ̇ el out el in el el e dis el c ch , , , , (30) = + + COP Q Q E E g s cool out el in el , , (31)
whereQcoolis the cooling energy that can be produced by the exhaust
air of the air motor. For air conditioning, the cold airflow is mixed with the airflow at the ambient temperature so that the resulting air flow reaches the comfort temperature of the room. Thus, cooling energy is calculated by:
= −
Qcool m Ċ .e p a,. (Tcomfort Tout e,).tdis (32)
withTcomfort=21 C° .
However, the coefficient of performance defined above over-estimates the efficiency of our trigenerative system [19]. Thus the comprehensive efficiency defined by Li et al.[19]is also adopted.
= + + η E E g Q COP Q COP out el in el , , heat ref heat cool ref cool , , (33)
COPref heat, and COPref cool, are the performance coefficients of con-ventional heat pumps for heating and cooling, respectively. As afirst approximation, they are considered equal to 4 and 3 respectively as proposed by[28].
Thefirst two terms of the numerator of Eq.(33)show the equivalent electrical energy needed to produce the heating and cooling energy by a conventional heat pump. Hence, the index named by Li et al[18]as comprehensive efficiency reflects the ratio between the two following terms: (1) the sum of the output electrical energy and the equivalent electrical energy for heating and cooling, (2) the electrical energy input. We prefer to employ the term“global equivalent electrical efficiency” instead of “comprehensive efficiency”. We put the emphasis on this efficiency, which is the most important in order to compare the T-CAES technology with other storage technologies such as electrochemical batteries.
3. Material and methods
This section begins with a general layout of the experimental bench. Then, a detailed description of each component and the experimental procedure and operating parameters are presented.
3.1. Experimental setup
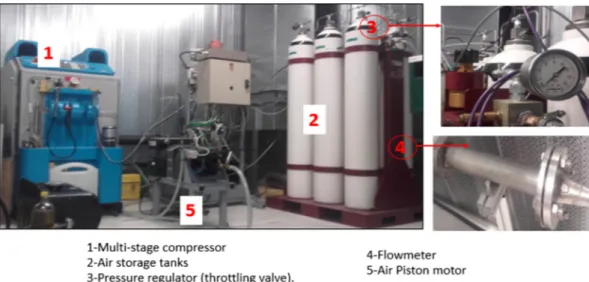
To study the characteristics of the CAES system, an industrial pilot unit has been built in GEPEA laboratory at the IMT Atlantique, France. The process instrumentation diagram and photograph are shown in
Figs. 5 and 6.
The rated power of the compressor driven-motor(1)is 4 kW with a maximum global compression ratio of 325. Compressed air is stored in six reservoirs (2) with a capacity of 50 L each. The air stored is
expanded through an air motor(5)coupled to a DC generator of 2 kW maximum power. The admission air motor pressure could vary in the range[2–8]bars (absolute values). The pressure at the entrance of the air motor is controlled manually via a pressure regulator(4). The pilot is equipped with sensors for continuous monitoring of power, pressure, temperature and massflowrate(5).
Experimental results are illustrated in Figs. 7–12. Experimental uncertainties associated with the measurements have been determined from the manufacturer’s data of the temperature captors ( ± 1.6 °C), pressure captors (between 0.05% and 0.1% of the measure range), and airflow captors (0.08% of the measure range).
3.2. Compressor chain
The piston reciprocating compressor is a three-stage compressor arranged in a W form, cooled by air-air heat exchanger between two consecutive stages. The cooling airflow is forced by one ventilator. The pressure ratios of thefirst 2 stages are 7.6 and 5.6 respectively but the pressure ratio of the third stage varies from 4.08 to 7.2 according to the state of charge. It should be noticed that for afixed global pressure ratio, the optimal distribution is symmetrical[39], which is different
from the manufactured compressor. This is due to a variable global pressure ratio. Air humidity is ignored because the compressor is equipped with a dehumidifier.Table 1shows the main characteristics of the compressor chain.
During the charge phase, the values of pressure, temperature, power and massflow rate are recorded every 20 min, which is accurate enough regarding their temporal variations.
Fig. 5. Photograph of the CAES pilot unit - IMT Atlantique, France.
The effectiveness of the heat exchanger is calculated using Eq.(4), and the polytropic coefficient, after algebraic manipulation, is calcu-lated as: = − ⎜ ⎟ ⎛ ⎝ ⎞ ⎠ n 1 1 c β ln ln( ) Tout i Tin i c , , (34) Unfortunately, we do not know the exact mechanical efficiency ηm
and electrical efficiency ηe. The latter depends on the nominal power
and standard efficiency of the motor. The electrical efficiency usually ranges between 0.75 and 0.83 for a 4 kW motor as proposed by[40]. An average value of 0.8 is then considered here. Similarly, a value of 0.9 is taken for the mechanical efficiency which is estimated in the range of [0.88–0.95] by [33]. It is important to mention that the different parameters displayed inTable 1are obtained for afixed pressure ratio.
3.3. Storage reservoir
The total capacity of the six tanks is 0.3 m3, and the maximum
al-lowed pressure is 350 bar. Nevertheless, for security purpose, the compressor stops automatically as soon as the air pressure reaches 315 bar. A high value of the storage pressure is chosen to account for the fact that to store a given air mass, the cost consequences of oper-ating at low maximum pressure is more severe than at too high pressure
[17]. The minimum operating pressure of the air storage is chosen at 5 bar to help and facilitate the control of the pressure manually.
During the storage phase, the air temperature and pressure inside the tank are collected to validate the model.
3.4. Air motor and pressure regulator
Three types of experiments were carried out:
– Firstly, the pressure input of the air motor (AM) was manually
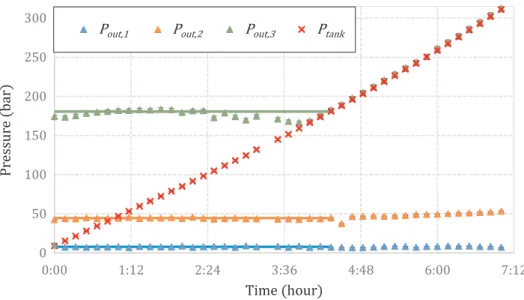
Fig. 7. Pressure variations during the charge phase.
monitored and regulated to 5 bar throughout the discharge phase. The procedure for obtaining the physical variables is the same as for the charge phase with a record frequency of 1 min, which is ac-ceptable compared to the discharge time (around 2 h).
– Secondly, we focused on the temperature change across the throt-tling valve. It was rigorously accounted and acquired once the pressure of the air tanks varies, allowing a validation of the model. – Finally, the impact of pressure, temperature and mass flow are at the
inlet of the AM on its efficiency was investigated.
For these two later experiments, the operating conditions in terms of pressure and temperature are obtained according to the state of dis-charge of the stored air while the valve is constantly regulated. The massflow rate or in other words the speed of rotation of the air motor shaft is controlled by changing the load electric resistance.
It is noticeable that a significant unavoidable amount of heat transfer occurs from the environment to the air flowing in the flow meter, inducing an unpredicted value of the air temperature at the entrance of the air motor. For validation purpose, an average value of this temperature is taken into account.
The electrical efficiency of the generator used is 0.83.Table 2shows the characteristics of the discharge phase. The polytropic coefficient of
the air motor is determined by: = + n 1 1 e ln( )β ln( ) e Tout e Tin , ,e (35)
4. Results and discussions
Model and experiment results are compared and summarised in
Tables 3 and 4. It can be seen that the reservoir is completely charged at a maximum pressure of 181 bar after 4 h and 20 min, compressors consume 13.72 kWh with a heating energy that can be stored of 5.72 kWh. The air motor provides 0.437 kW for one hour and 8 min while the reservoir is completely discharged. The electrical round trip e ffi-ciency is very low (3.6%), whereas the comprehensive effiffi-ciency or the global equivalent electrical efficiency is higher and equal to 15.16% owning the values of heating energy and cooling energy (0.8 kWh).
The parameters predicted by the model such as the air massflow rate in the compressor, the charge and discharge times and also the electrical and comprehensive efficiencies are in good agreement with the experimental results. The maximum error is 13.1%, which is cal-culated by:
Fig. 9. Air massflow and compressor power during the charge phase.
= −
error model result experimental result Maximum model result experimental result
(%) | |
( , ) (36)
Finally, a detailed analysis for the charge, storage and discharge phases was conducted to study and illustrate the behaviour of each component.
4.1. Charge phase
The charge phase was conducted at the room temperature of around 22 °C.Figs. 7 and 8present respectively the input and output pressure and temperature variations during the charge phase. Two operation periods can be identified according to the global pressure ratio varia-tions.
During thefirst period, the pressure output of each stage is constant with a small fluctuation at the outlet of the third stage due to
instabilities when opening and closing the exhaust valve.
According toFig. 8, the temperatures of each component and of the stored air increase, then stabilize. This transitional period for the compressor and heat exchangers lasts around 40 min and is due to the heat exchange taking place with the environment.
The stabilization duration of the compressed air temperature is longer (around two hours) due to the fact that the initial amount of air (at 8.8 bar and ambient temperature) acts to cool the stored air. The constant value of the temperature after 2 h proves that the heat ex-change with the environment could be neglected compared to the mass heat transfer through the charge airflow, as proposed in the model.
Similar behaviours for the temperature and pressure profiles can be found in the experimental results reported by Wang et al.[10]though the stabilization of the air temperature inside the reservoir was not achieved in their case. This can be explained by a more important initial
Fig. 11. Pressure variations during the discharge phase.
air mass in the study of Wang et al.[10](around 38% of the total mass stored).
As it can be seen onFig. 9, the absorbed electric power is constant as well as the air mass flow (apart from weak fluctuations). The air pressure in the reservoir increases linearly from 8.8 bar to 181 bar in 4 h and 20 min, which demonstrates the adequacy of the perfect gas rela-tion to model the stored air.
According toTable 3, the values of the airflow and charge time predicted by the model are accurate with an error which does not ex-ceed 12%. These errors are caused by the pressure losses not being accounted, uncertainties regarding the mechanical and electric e ffi-ciencies and mostly by the transitional regime which is not considered by the model.
During the second period, the pressure ratio of thefirst stage re-mains constant and that of the second stage slowly increases. At the same time, this ratio increases according to the reservoir pressure for the third stage (Fig. 7).
As shown inFig. 8, the outlet temperatures of the last two com-pression stages raise which implies an increase of the outlet tempera-ture of all HEX since the efficiency of each HEX remains almost con-stant.
The driven motor is asynchronous, the increase in global pressure ratio means an increase of the shaft torque and a slow decrease in the rotation speed. Thus, as it can be observed inFig. 9, the air massflow slightly decreases until 13.6 kg/h and the input power increases reaching a maximum value of 3.6 kW for an air pressure of 315 bar.
4.2. Storage phase
The experimental and modeling results are illustrated inFig. 10for the storage phase. The predicted temperature and pressure variations are in line with the measured ones. The stored air temperature de-creases exponentially and achieved the ambient temperature after a storage duration of around 5 h. The pressure drop is similar and reaches 296 bar which is slightly lower than the predicted one (301 bars),
representing an error of 1.6%.
It should be noticed that the change of heat capacity with pressure was introduced and investigated and it is found that it reduces insig-nificantly the percentage of error. Hence, potential error sources could be identified as:
– Storage tanks are closely placed and natural boundary layers may be mixed contrary to the model assumptions.
– Real air properties and humidity (even if partial humidification occurs) are not taken into consideration.
4.3. Discharge phase
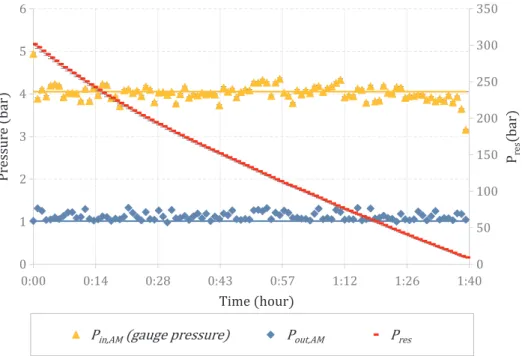
The discharge phase is examined at the room temperature of 26.4 °C. As outlined previously, the input pressure of the air motor is regulated continuously at 4 bar (gauge pressure), itsfluctuation can be observed inFig. 11. In practice, the air pressure does not expand to the atmospheric pressure. Consequently, the pressure output of the AM remains always above this level (Fig. 11). The air reservoir pressure decreases almost linearly from 301 bar to around 9 bar during this phase which takes 1 h and 40 min.
Fig. 12displays the temperature variations with time. Two types of profiles can be observed. During the first 10 min, the outlet tempera-tures of the expansion valve and consequently of the AM decrease which is inconsistent with the Joule-Thomson law, saying that the
Table 1
Experimental characteristics of compression chain. (*) refers to calculated va-lues.
Parameter 1-stage 2-stage 3-stage Pipe connection
Storage tank Inlet pressure [bar] 1.013 7.9 44.4 181–315 Outlet pressure [bar] 7.7 44.4 181–315
Pressure ratio (*) 7.6 5.6 4.08–7.2 Inlet temperature [°C] 22 62.0 58.0 43.3 33 Outlet temperature [°C] 118.0 198.7 152.0 33 Mechanical efficiency 0.88–0.95 (0.9) Electric efficiency 0.75–0.83 (0.8) Shaft Power [kW] 3.19 Polytropic coefficient (*) 1.16 1.25 1.22 Heat exchangers
Parameter 1-stage 2-stage 3-stage Effectiveness, ε (*) 0.583 0.796 0.836
Table 2
Experimental characteristics of the discharge phase. (*) refers to calculated values.
Parameter Expansion valve Flow meter Air Motor Inlet pressure [bar] 300–9 (max 300) 5 5
Outlet pressure [bar] 5 5 1.031
Inlet temperature [°C] 24 –22 < T < 14 −5 < T < 24 (10 on average) Outlet temperature [°C] –22 < T < 14 −5 < T < 24 (10 on average)
Massflow rate [kg/h] 49.28 49.28
Polytropic coefficient 1.1 (*)
Table 3
Experimental and model results of the charge phase.
F.CH.S @ 181 bar First period
F.CH.S @ 315 bar Second period Parameters Experimental Model Error (%) Experimental Airflow rate [kg/h] 14.4 15.09 4.6 14.18 Charge time [h] 4.3 3.79 11.9 7 Consumed electric
energy [kWh]
13.72 12.09 11.9 22.86 Potential heating energy
[kWh]
5.27 4.87 7.6 8.61
Table 4
Experimental and model results of the discharge phase.
I.DIS.S @ 181 bar Experiment n°1
I.DISCH.S @ 300 bar Experiment n°2 Parameters Experimental Model Error (%) Experimental Average power [kW] 0.437 0.432 1.1 0.435 Discharge time [h] 1.13 1.16 2.6 1.66 Produced electric energy
[kWh]
0.49 0.50 1.5 0.72 Cooling energy [kWh] 0.80 0.78 1.9 1.14 Round trip electric
efficiency (%) 3.6 4.1 13.1 3.2 COP 0.48 0.51 6.0 0.46 Comprehensive efficiency (%) 15.16 16.4 7.5 14.24
temperature should rise when the pressure input increases. This var-iation can be explained by the fact that the exhaust air serves to cool the stored air as it can be noticed from its temperature profile. Afterwards, the temperature rises as expected.
Concerning thefirst experiment, the initial pressure was set to181 bar, despite the fact that the average air mass flow rate equals to 49.28 kg/h is higher than that of compression. The power output was equal to 0.437 kW (seeTable 4). It is even lower than the power input since the electric efficiency is very low (3.6%). The poor performance of the system ( =ηel 0.032;COP=0.48)is justified by the difference of the operating pressures during the compression and expansion processes and is clearly apparent in the exergy losses or the irreversibilities in the throttling valve. It should be noted that the real performance is higher since the cooling potential between the expansion valve and the air motor input is not evaluated.
Errors in terms of the discharge phase and the power output are very low (maximum 2.6%) caused by the average value of the input air temperature of the air motor introduced in the model and the fluctua-tion of the pressure input due to the manual regulafluctua-tion. Owning the error during the charge phase, the maximum error was for the round trip efficiency (13.1%), which remains quite acceptable.
Finally, when the discharge occurs from the initial state of 300 bar (experiment n°2), the electric efficiency and comprehensive efficiency are slightly lower (3.2% and 14.24% respectively). These values result from two effects: a higher value of compression ratio lowers the per-formance meanwhile, the variable compression ratio contributes to an increase of the efficiency.
4.4. Focus on the throttling valve and the air motor
In this section, we investigate more in-depth the effect of the op-eration characteristics of these two components.
4.4.1. Throttling valve
Using the approximation of Noel[32]expressed in Eqs.(24) and (25), isenthalpic curves are plotted and compared to the experimental results inFig. 13. By throttling the stored air to 5 bar, higher the initial pressure is, larger the temperature drops. The maximum error of the calculated values is around 11% and is recorded when the initial pressure at 245 bar is out of the range of this approximation [25 atm; 150 atm]. Nonetheless, this error means an insignificant difference of 1 °C or 2 °C. As a result, the approximation of Noel remains accurate enough to model the pressure regulator for the pressure range con-sidered here.
4.4.2. Air motor
Since the polytropic coefficient is associated with the amount of heat transfer from the environment to the expanding air, it depends on several factors such as the ambient temperature and the input pressure and temperature. The effect of the ambient temperature is not explored in this study since it did not substantially change during the experi-mental campaign. By comparison of the different values of the poly-tropic factor, it is found that ne is independent of the operating
condi-tions. For instance, it is equal to 1.12 for(Pin e, =4bar; Tin e,= °1 C)and 1.1 for(Pin e, =6bar; Tin e,=13 C)° . Consequently, the value of 1.1 was selected.
In order to examine the effects of the operating conditions of the air motor on the output power provided by the manufacturer, these curves are compared to the experimental results inFig. 14for different mass
flows, input pressures and temperatures. The experimental values are consistent with the power curves with a difference varying between 0.7% and 16.8% according to the input temperature. As detailed in
Table 5, when the temperature approaches the ambient temperature,
the error is reduced. This is because the manufacturer curves of the air motor are made for industrial applications for which the maximum air storage pressure does not exceed 30 bar and therefore the input tem-perature is close to the room temtem-perature.
It is of great importance to derive the thermodynamic to electrical efficiency conversion independently of the temperature input, which is done inFig. 14using Eq.(28). Regardless the operating pressure, the efficiency is optimal for a certain value of RPM, denoted RPMoptimalbut
still not high enough (around 25%) and lower than the value achieved with a scroll expander (reported as higher than 70%[36]). Similar conclusions and values can be found in the works of Yu et al.[41]and Lemoufet-Gasti [42]. The low-efficiency values can be attributed
mainly to the air leaks at small RPM[43]and to mechanical losses at high RPM.
Low operation pressures are linked to an efficient thermodynamic electrical conversion due to fact that the displacement volume is no longer sufficient to expand the air to the atmospheric pressure. For instance, the air expands to 1.05 bar when the input pressure is 3 bar whereas it expands to 1.12 bar for 4 bar pressure input (seeTable 5). 5. Conclusions and perspectives
In this paper, we presented a steady state input/output model of a simple configuration of the recently proposed concept of compressed air energy storage system named as trigenerative compressed air energy storage system (T-CAES). An industrial pilot unit was described. Several experimental tests were carried out in order to investigate the real
behaviour of our system, focusing on the discharge phase. Experimental results were found to be in good agreement with the model results, with an error which does not exceed 13.2%.
Since a significant difference between the charge pressure at 181 bars and discharge pressure at 5 bars takes place, the round trip elec-trical efficiency is very low at 3.6% and the comprehensive efficiency which represents the equivalent electrical storage efficiency reaches 15.6% underlying the importance of the trigeneration concept.
During the charge phase, the consumed electric energy of 13.72 kWh was 12% higher than the model of 12.1 kWh. The error was caused mainly by the transitional regime required to stabilize compressed air temperature.
The transitional regime during the charge phase takes about 40 min. Pressure and temperature in the air tank during this phase were ac-counted, the temperature stabilises at a particular level which differs from the results of Wang et al.[10]. It highlights in particular the prime importance of the initial mass of stored air.
During the storage phase, the air temperature as well as the pressure were modelled and found in good agreement with the experimental measurements. Unfortunately, it has not been possible to provide those variations during the discharge phase because of the influence of the cold exhaust air of the air motorflowing around our system.
During the discharge process, the output electric energy of 0.49 kWh was 1.5% less than the model of 0.5 kWh. A particular attention was paid to the behavior of each system component during this phase. It has been demonstrated that the Joule-Thomson effect governs the temperature change across the pressure regulator and the assumption of constant temperature is no longer true as stated in previous models of compressed air energy storage system.
A comprehensive analysis of the air motor efficiency was presented to clarify its performance curves. The reported high values of the power output associated with higher input temperatures provide afirst evi-dence of the benefit of preheating.
The model developed is expressed directly in terms of design and thermodynamic parameters and enables an accurate prediction of the system performance and provides relevant output parameters for
practical applications. It is thefirst reliable model validated with ex-perimental data for small-scale compressed air energy storage system, which can be applied for prospective trigenerative system studies.
On the other hand, such a steady-state modelling is limited and is not sufficient when the compression ratio is variable. In addition, the transient nature of the discharge process should be accounted to assess properly the cooling potential and the output power.
As the efficiency of such a compressed air energy storage system remains low, future work will be devoted to the optimisation in terms of system configuration and design parameters taking into account op-erational and technological aspects.
Finally, three different potential strategies would be applied also in a future work to reduce losses in the throttling valve and improve the performance of the system:
1 Increasing the expansion ratio until 25 by introducing the recently developed micro-turbines[44].
2 Replacing the throttling valve by a Ranque-Hilsch vortex tube or a cascade of vortex tubes. These devices have indeed the capability to relax the air to reduce the maximum inlet pressure allowed by current microturbines, while producing a hot and a cold stream. The produced cooling power would be then reinjected within some heat exchangers of the compressed air energy storage system.
3 Adding a supersonic ejector after the throttling valve to mix the air from tanks at different pressures (which would reduce the cost of the storage tanks) and guarantee a more constant pressure at the inlet of the turbine. It has been successfully applied by Chen et al.[45]for a large-scale adiabatic compressed air energy storage system. Acknowledgement
M.C. and S.P. acknowledge the financial support of the Natural Sciences and Engineering Research Council of Canada (NSERC) and the company Sigma Energy Storage Inc. through a Collaborative Research and Development grant (386141936).
References
[1] Zou C, Zhao Q, Zhang G, Xiong B. Energy revolution: from a fossil energy era to a new energy era. Nat Gas Ind B 2016;3(1):1–11.
[2] Weitemeyer S, Kleinhans D, Vogt T, Agert C. Integration of renewable energy sources in future power systems: the role of storage. Renew Energy 2015;75:14–20. [3] Beaudin M, Zareipour H, Schellenberglabe A, Rosehart W. Energy storage for
mi-tigating the variability of renewable electricity sources: an updated review. Energy Sustain Dev 2010;14(4):302–14.
[4] Chen H, Cong TN, Yang W, Tan C, Li Y, Ding Y. Progress in electrical energy storage system: a critical review. Prog Nat Sci 2009;19(3):291–312.
[5] Luo X, Wang J, Dooner M, Clarke J. Overview of current development in electrical energy storage technologies and the application potential in power system
Fig. 14. Power versus RPM of the air motor (left) and thermodynamic to electrical conversion (right).
Table 5
Power and pressure output of the air motor for different operating conditions.
Pin(bar) Tin(°C) RPM PowerEXP
(kW)
Powermodel(kW) Pout(bar) Error (%)
3 19 897 0.3 0.34 1.05 11.8 3 5.6 892 0.283 0.34 1.05 16.8 4 18.5 898 0.447 0.45 1.12 0.7 4 −2 881 0.39 0.45 1.12 13.3
operation. Appl Energy 2015;137:511–36.
[6] Papathanassiou SA, Boulaxis NG. Power limitations and energy yield evaluation for wind farms operating in island systems. Renew Energy 2006;31(4):457–79. [7] Ibrahim H, Bourji A, Ghandour M, Merabet A. Optimization of compressed air
storage’s volume for a stand-alone wind-diesel hybrid system. In: Electrical Power & Energy Conference (EPEC), Halifax; 2013. p. 1–7.
[8] Anjos MF, Gabriel SA, Guerra C.“L’énergie au Québec et au Canada : un document pour engager la conversation“, Report, Institut de l’énergie Trottier, Polytechnique Montréal; 2015.
[9] Luo X, Wang J, Dooner M, Clarke J, Krupke C. Overview of current development in compressed air energy storage technology. Energy Proc 2014;62:603–11. [10] Wang S, Zhang X, Yang L, Zhou Y, Wang J. Experimental study of compressed air
energy storage system with thermal energy storage. Energy 2016;103:182–91. [11] Luo X, Wang J, Dooner M, Clarke J, Krupke C. Modelling study, efficiency analysis
and optimisation of large-scale adiabatic compressed air energy storage systems with low-temperature thermal storage. Appl Energy 2016;162:589–600. [12] Wang J, Lu K, Ma L, Wang J, Dooner M, Miao S, et al. Overview of compressed air
energy storage and technology development. Energies 2017;10(991):1–22. [13] Wolf D. Methods for design and application of adiabatic compressed air energy:
storage based on dynamic modeling. Laufen: Oberhausen; 2011.
[14] Sciacovelli A, Li Y, Chen H, Wu Y, Wang J, Garvey S, et al. Dynamic simulation of adiabatic compressed air energy storage (A-CAES) plant with integrated thermal storage– link between components performance and plant performance. Appl Energy 2017;185:16–28.
[15] Geissbühler L, Becattini V, Zanganeh G, Zavattoni S, Barbato M, Haselbacher A, et al. Pilot-scale demonstration of advanced adiabatic compressed air energy sto-rage, Part 1: Plant description and tests with sensible thermal-energy storage. J Storage Mater 2018;17:129–39.
[16] Becattini V, Geissbühler L, Zanganeh G, Haselbacher A, Steinfeld A. Pilot-scale demonstration of advanced adiabatic compressed air energy storage, Part 2: Tests with combined sensible/latent thermal-energy storage. J Energy Storage J 2018;17:140–52.
[17] Proczka JJ, Muralidharan K, Villela D, Simmons JH, Frantziskonis G. Guidelines for the pressure and efficient sizing of pressure vessels for compressed air energy sto-rage. Energy Convers Manage 2013;65:597–605.
[18] Facci AL, Sánchez D, Jannelli E, Ubertini S. Trigenerative micro compressed air energy storage: concept and thermodynamic assessment. Appl Energy 2015;158:243–54.
[19] Li Y, Wang X, Li D, Ding Y. A trigeneration system based on compressed air and thermal energy storage. Appl Energy 2012;99:316–23.
[20] Zafirakis D, Kaldellis JK. Autonomous dual-mode CAES systems for maximum wind energy contribution in remote island networks. Energy Convers Manage 2010;51(11):2150–61.
[21] Budt M, Wolf D, Span R, Yan J. A review on compressed air energy storage: basic principles, past milestones and recent developments. Applied Energy
2016;170:250–68.
[22] Kim YM, Shin DG, Favrat D. Operating characteristics of constant-pressure com-pressed air energy storage (CAES) system combined with pumped hydro storage based on energy and exergy analysis. Energy 2011;36(10):6220–33.
[23] Hartmann N, Vöhringer O, Kruck C, Eltrop L. Simulation and analysis of different adiabatic compressed air energy storage plant configurations. Appl Energy 2012;93:541–8.
[24] Wolf D, Budt M. LTA-CAES– a low-temperature approach to adiabatic compressed air energy storage. Appl Energy 2014;125:158–64.
[25] Grazzini G, Milazzo A. A thermodynamic analysis of multistage adiabatic CAES. In: Proceedings of the IEEE, vol. 100, no. 2; 2012. p. 461–72.
[26] Arabkoohsar A, Dremark-Larsen M, Lorentzen R, Andresen GB. Subcooled com-pressed air energy storage system for coproduction of heat, cooling and electricity. Appl Energy 2017;205:602–14.
[27] Han Z, Guo S. Investigation of discharge characteristics of a tri-generative system based on advanced adiabatic compressed air energy storage. Energy Convers Manage 2018;176:110–22.
[28] Jannelli E, Minutillo M, Lubrano Lavadera A, Falcucci G. A small-scale CAES (compressed air energy storage) system for stand-alone renewable energy power plant for a radio base station: a sizing-design methodology. Energy
2014;78:313–22.
[29] Lv S, He W, Zhang A, Li G, Luo B, Liu X. Modelling and analysis of a novel com-pressed air energy storage system for trigeneration based on electrical energy peak load shifting. Energy Convers Manage 2017;135:394–401.
[30] Liu J-L, Wang J-H. Thermodynamic analysis of a novel tri-generation system based on compressed air energy storage and pneumatic motor. Energy 2015;91:420–9. [31] Goodwin JDA, Derby J. Compressed air batteries. Energize 2011:26–8. [32] Robison DH, Beaty PJ. Compressor types, classifications, and applications, In:
Proceedings of the 21st Turbomachinery Symposium, Texas A&M University; 1992. [33] Bloch HP. A practical guide to compressor technology. 2nd ed. Hoboken, N.J:
Wiley-Interscience; 2006.
[34] Bejan A. Convection heat transfer. fourth ed. Hoboken, New Jersey: Wiley; 2013. [35] Hoxton LG. The Joule-Thompson effect for air at moderate temperatures and
pressures. Phys Rev 1919;13(6):438.
[36] Lemort V, Guillaume L, Legros A, Declaye S, Quoilin S. A comparison of piston, screw and scroll expanders for small scale Rankine cycle systems. In: Proceedings of the 3rd international conference on microgeneration and related technologies in buildings, Naples; 2013.
[37] He W, Wang J. Optimal selection of air expansion machine in compressed air energy storage: a review. Renew Sustain Energy Rev 2018;87:77–95.
[38] WeiBs AP. Volumetric expander versus turbine–which is the better choice for small ORC plants. In: 3rd ASME ORC conference, Brussels (Belgium); 2015.
[39] Vadasz P, Weiner D. The optimal intercooling of compressors by afinite number of intercoolers. J Energy Res Technol 1992;114(3):255–60.
[40] Burt CM, Piao X, Gaudi F, Busch B, Taufik NF. Electric motor efficiency under variable frequencies and loads. J Irrig Drain Eng 2008;134(2):129–36. [41] Yu Q, Cai M. Experimental analysis of a compressed air engine. J Flow Control,
Measur Visual 2015;03(04):144–53.
[42] Lemofouet-Gatsi S. Investigation and optimisation of hybrid electricity storage systems based on compressed air and supercapacitors. PhD thesis, EPFL, Lausanne; 2006.
[43] Beater P. Pneumatic drives: system design, modelling and control. Berlin, London: Springer; 2007.
[44] Weiss Andreas P, Zinn Gerd. Micro turbine generators for waste heat recovery and compressed air energy storage. In: no. 15th conference on power system en-gineering, thermodynamics &fluid flow-ES 2016, Pilsen, Czech Republic; 2016. [45] Chen LX, Hu P, Zhao PP, Xie MN, Wang DX, Wang FX. A novel throttling strategy
for adiabatic compressed air energy storage system based on an ejector. Energy Convers Manage 2018;158:50–9.