OATAO is an open access repository that collects the work of Toulouse
researchers and makes it freely available over the web where possible
Any correspondence concerning this service should be sent
to the repository administrator:
[email protected]
This is an author’s version published in:
http://oatao.univ-toulouse.fr/25065
To cite this version:
Gineste, Stéphane and Di Cola, Emanuela and Amouroux, Baptiste and Till,
Ugo and Marty, Jean-Daniel and Mingotaud, Anne-Françoise and Mingotaud,
Christophe and Violleau, Frédéric
and Berti, Debora and Parigi, Giacomo
and Luchinat, Claudio and Balor, Stéphanie and Sztucki, Michael and Lonetti,
Barbara Mechanistic Insights into Polyion Complex Associations. (2018)
Macromolecules, 51 (4). 1427-1440. ISSN 0024-9297
Mechanistic Insights into Polyion Complex Associations
Stéphane Gineste,
†Emanuela Di Cola,
‡Baptiste Amouroux,
†Ugo Till,
†,§Jean-Daniel Marty,
†Anne-Françoise Mingotaud,
†Christophe Mingotaud,
†Frédéric Violleau,
∥Debora Berti,
⊥Giacomo Parigi,
#Claudio Luchinat,
#Stéphanie Balor,
%Michael Sztucki,
&and Barbara Lonetti
*
,† †Laboratoire des IMRCP, Université de Toulouse, CNRS UMR 5623, Université Toulouse III - Paul Sabatier, 118 route deNarbonne, Cedex 9 F-31062, Toulouse, France
‡BioSoftMatter Laboratorio Dip CBBM LITA, Universita di Milano, Via F lli Cervi 93 MI IT, 20090 Segrate, Italy
§Département Sciences Agronomiques et Agroalimentaires, Université de Toulouse, Institut National Polytechnique de Toulouse
-Ecole d’Ingénieurs de Purpan, 75 voie du TOEC, BP 57611, Cedex 03 F-31076 Toulouse, France
∥Laboratoire de Chimie Agro-industrielle (LCA), Université de Toulouse, INRA, INPT, INP-EI PURPAN, Toulouse, France ⊥Department of Chemistry“Ugo Schiff”, University of Florence and CSGI, Via della Lastruccia 3, 50019 Sesto Fiorentino Firenze,
Italy
#Department of Chemistry Ugo Schiff and Magnetic Resonance Center (CERM), University of Florence, Via della Lastruccia 3,
50019 Sesto Fiorentino Firenze, Italy
%
Plateforme METi, Centre de Biologie Intégrative (CBI), Université de Toulouse, CNRS, UPS, Toulouse, France
&
European Synchrotron Radiation Facility-71, avenue des Martyrs, CS 40220, Cedex 9 38043 Grenoble, France
*
S Supporting InformationABSTRACT: Polyion complex (PIC) micelles formed from the electrostatic interaction between oppositely charged polymers have been studied for their promising applications in the biomedical field as drug carriers or vectors for gene delivery. In spite of their asset of possible high drug loading, their formation process remains poorly studied. In this work, we investigate the properties of a series of PICs based on poly(ethylene oxide-b-acrylic acid) (PEO− PAA)/dendrigraft poly(L-lysine) (DGL3), using PEO−PAA with different compositions and average molecular weights. For each PEO−PAA/DGL3 pair, the complexes were characterized as a function of the ratios between acid and amine moieties combining different techniques: dynamic light scattering (DLS), flow field-flow fractionation (FlFFF), small-angle X-ray scattering (SAXS), and relaxometry. The coupling of batch techniques, i.e., DLS, SAXS, and relaxometry, together with a soft separation technique like FlFFF enabled afiner analysis to elucidate subtle details of the association process and of the polydispersity of the complexes. We
show that the formation of PICs is more complex than previously described. In particular, we demonstrate that PICs with stoichiometry 1:1 may form at low ratios provided that the acidic block is long enough to neutralize the cationic dendrigraft with few polymer chains. Moreover, in such conditions, PICs with stoichiometry 1:1 often coexist with free dendritic polymers and other associated complex species.
■
INTRODUCTIONPolyelectrolytes are widely present and essential molecules in living systems. As such, their behavior has been studied for decades.1 The characterization of the association between different oppositely charged polyelectrolytes has expanded thanks to the extensive work of Kabanov in the early 1990s dealing with so-called interpolyelectrolyte complexes.2 Associ-ation of a cAssoci-ationic polyelectrolyte to a negatively charged one was shown to lead to soluble complexes only when the ratio between charged groups was different from 1 and the
polyelectrolyte characterized by the higher degree of polymer-ization (also called the“host”) was in excess with respect to the other (also called the“guest”).3At the equimolar stoichiometry, macroscopic precipitation always occurred. For the soluble host−guest IPEC salt addition induced disproportionation; i.e., insoluble IPEC with equimolar stoichiometry precipitated, and
soluble IPEC with a composition different from the parent one, depleted in the short polyelectrolyte, formed. The discovery that such a precipitation could be avoided when using block copolymers instead of homopolymers led Kataoka and co-workers4−8to develop the modern version of such assemblies, namely, polyion complex micelles (PICs) also called block ionomer complexes (BICs), micellar interpolyelectrolyte complexes,9 or complex coacervate core micelles.10,11 With the development of controlled radical polymerization and polymer engineering, the number of achievable block copolymers has exploded, leading to a burst of new PICs assemblies, thanks also to their potential application in nanomedicine as nanovectors for charged drugs or nanoplexes in DNA in gene therapy.12−14
PIC assemblies are generally formed using at least one double hydrophilic block copolymer with afirst neutral block and a second one charged. The other PIC partner consists either in a homopolyelectrolyte or another double hydrophilic block copolymer with a charged block opposite in sign. PICs’ assembly is typically monitored with turbidimetry,15 static (SLS) or dynamic light scattering (DLS),5,11,16 cryo-trans-mission electron microscopy (cryo-TEM),11and recently two-dimensional proton nuclear magnetic resonance nuclear Overhauser effect spectroscopy.17
Based on the published studies on the PIC physical− chemical properties, several points of interest for applicative purposes and for the present study can be highlighted. (i) First, the formation and the structural properties of PIC assemblies strongly depend on the balance between the positive and negative charges and the relative length of each segment of the copolymers.9(ii) PICs have been observed to be soluble for any ratio or only for specific ones, depending on the parameters of the copolymers.18−21 (iii) A third point is their general instability in the presence of salt due to the screening of the electrostatic interactions that drive PICs’ formation.20,22 Disassembly is typically observed through static light scattering measurements, where the decrease of the scattered light intensity is associated with a decrease in size of the scattering objects. This drawback was overcome either by cross-linking7,16,18,23,24 or through introduction of hydrophobic moieties that provide further favorable contribution to self-assembly.25
Although PICs have been widely studied, some open questions still exist regarding for instance the existence of a critical aggregation concentration.5,19,20,23,26,27The mechanism of association has been rarely addressed, while it is of utmost importance to exert structural control and to fully exploit the applicative potential of PICs. For complexes whose formation is driven by charge compensation, it has been observed that the structure and composition of the aggregates depend on the order of addition, i.e., on the instantaneous composition of the mixture and not on the equilibrium one.28−30For PICs based on poly(ethylene glycol-b-α,β-aspartic acid), PEO-P(Asp), and chicken egg white lysozyme, Kataoka suggested they could form through two alternative processes: cooperative (closed association) and noncooperative (open association).5,6 In excess of lysozyme, the cooperative process led to PICs with stoichiometry 1:1 of the charged groups even before the macroscopic charge balance was reached; at the molecular level, complete complexation of the charged macromolecular chain to its opposite partner always took place.5 In excess of PEO-P(Asp), the noncooperative process led to PICs which decreased in size when the macroscopic stoichiometry 1:1 of
the charged groups was approached; then a partial complex-ation of the chain with the presence of uncomplexed charged moieties occurred.6 Formation through a cooperative process was also claimed by Gohy et al. for poly(2-vinylpyridinium-b-ethylene oxide) and sodium poly(4-styrenesulfonate), for all compositions.22 In this example, sodium poly(4-styrenesulfo-nate) in excess adsorbed on charged balanced micelles.
It is clear that the path followed during formation has a dramatic impact on the final structure of the assemblies. This contribution addresses the above-mentioned structural and mechanistic aspects for a PICs family based on poly(ethylene oxide-b-acrylic acid), PEO−PAA, and dendrigraft polylysine (DGL3) through a broad multitechnique approach. Very few examples exist on PICs formed by branched molecules. They mostly dealt with the characterization of the complexes at stoichiometry 1:1,31their resistance to solution conditions.32,33 Recently, Nguyen et al.34 described the formation of PICs at pH 7 between insoluble polystyrene-graf t-poly(2-vinylpyri-dine), G0PS-g-P2VP, and soluble poly(acrylic acid)-b-poly(2-hydroxyethyl acrylate), PAA-b-PHEA, at different ratios. They formed the assembliesfirst at pH 4.7 in order to guarantee the protonation of a portion of the amine groups of P2VP (pKa= 5); then the solution pH was adjusted to 7. They observed a better stability of the assemblies for shorter PAA chains in block copolymers with the same length of the neutral block. The increase of the neutral block length was necessary in order to stabilize the assemblies with lower PAA content. Besides, very recently the possible tuning of the self-assemblies properties was nicely demonstrated, i.e., their morphology by varying the number of arms of the star polyelectrolyte35 and their formation kinetics by using thermoresponsive nonionic block.36 Here we selected a dendrigraft polylysine and varied the relative length of the anionic block in a poly(ethylene oxide)-b-poly(acrylic acid) (PEO−PAA) set. In a previous work, we characterized PICs formed at equal quantities of acid and amine groups with batch DLS and frit-inlet asymmetricflow field-flow fractionation (FI-AsFlFFF),37 and we demonstrated the importance of a multitechnique approach to gain a clear picture of the structure of the complexes. Batch DLS showed one single broad size distribution, whereas the fractionation provided by FI-AsFlFFF before light scattering analysis revealed the presence of several populations in some of the systems. This analysis highlighted the importance of using FI-AsFlFFF, with its soft injection protocol before separation, in order to properly characterize the self-assemblies. Furthermore, it provided an estimation of the radius of gyration (Rg) and the
hydrodynamic radius (Rh), and it opened some questions about
the self-assemblies composition and their formation processes. In the present work, in order to address these questions, we focus on the effect of PEO−PAA composition. For each PEO− PAA/DGL3 pair, we varied the ratio between the cationic and anionic groups to follow the formation of the complexes and discern the mechanism of adduct formation. This process was monitored with a variety of techniques, including light scattering, but also flow field flow fractionation, small-angle X-ray scattering, and NMR relaxometry.
■
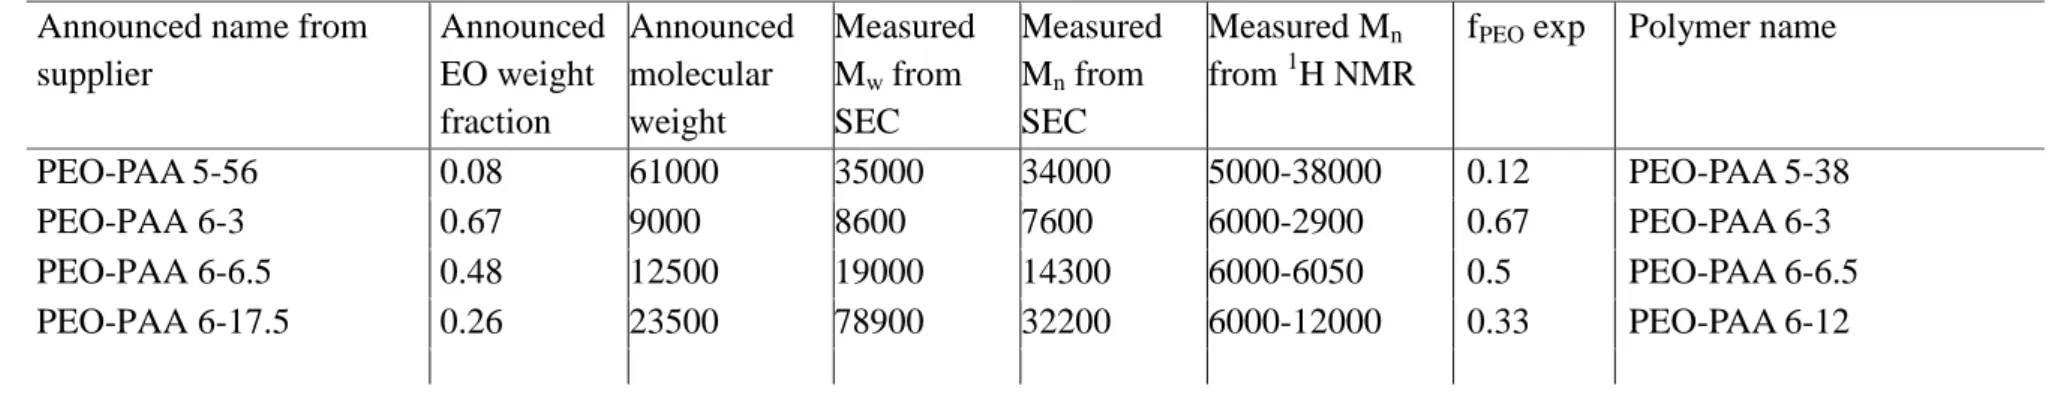
MATERIALS AND METHODSChemicals. Poly(ethylene oxide)-b-poly(acrylic acid) (PEO−PAA) was purchased from Polymer Source Inc. (Dorval Montréal, Canada) and was characterized by1H NMR and size exclusion chromatography;
the obtained number-average molecular weights of the polymers are reported in Table 1. Third-generation dendrigraft polylysine
trifluoroacetate (DGL3) was kindly provided by Colcom (Montpellier, France). Water was purified through a filter and ion-exchange resin using a Purite device (resistivity 18.2 MΩ cm).
2.2. Formation of PICs. First, a stock solution of DGL3 (5 mg mL−1, pH 7) was diluted with the adequate amount of water and then variable volumes of PEO−PAA (1 mg mL−1) stock solution at pH 7
(adjusted with NaOH) were added. The samples have afinal DGL3 concentration of 0.1 wt % and variable PEO−PAA/DGL3 ratios. We define the molar ratio R as the ratio between the concentration of PEO−PAA carboxylic groups and DGL3 amine groups ([AA]/ [NH2]). In the case of 1H NMR experiments the polymer stock
solutions and NaOH solution were prepared in D2O.
2.3. Dynamic Light Scattering (DLS). DLS measurements were carried out at 25°C on a Malvern (Orsay, France) Zetasizer NanoZS. Solutions were analyzed in triplicate without beingfiltered in order to characterize the plain samples. Data were analyzed with a custom-made program named STORMS37 using the general-purpose
non-negative least-squares (NNLS) method. This treatment provided residuals lower than 5× 10⁻³. Both intensity- and number-weighted results are presented here in order to provide a more complete overview of the assemblies’ populations. The assumptions and hypotheses leading to number-weighted results are further described in theSupporting Information(SI.1). The typical accuracy for these measurements was 10−20% for systems exhibiting a polydispersity index lower than 0.4. This was determined from repeated experiments associated with different fit treatments. Zeta-potential measurements were carried out using the Smoluchowski model.
2.4. Frit-Inlet Asymmetrical Flow Field-Flow Fractionation (FI-AsFlFFF). A FI-AsFlFFF channel was linked to an Eclipse 3 system (Wyatt Technology Europe, Dernbach, Germany,Scheme SI 4.1). The accumulation wall was a 1 kDa cutoff regenerated cellulose ultrafiltration membrane (ConSenxuS, Ober-Hilbersheim, Germany). An Agilent 1100 Series isocratic pump (Agilent Technologies,
Waldbronn, Germany) with an in-line vacuum degasser and an Agilent 1100 Autosampler delivered the carrier flow and handled sample injection into the frit inlet AsFlFFF channel. A 0.1 mm in-line filter (VVLP, Millipore, Germany) was installed between the pump and the FFF channel. An aqueous 0.02% sodium azide solution was filtered (vacuum filtration system using 0.1 mm Gelman filters) before use as eluent. The spacer type was 250W or 350W (250 or 350μm, respectively). Samples were injected at 0.1 wt % concentration. The elution program used for injectionflow Viof 0.2 mL min−1and for
detectorflow Voutof 1 mL min−1for cross-flow Vxwas 0.5 mL min−1
for 2 min, 2 mL min−1for 38 min, decreased to 0.5 mL min−1in 10 min followed by 0.5 mL min−1 for 40 min. The eluted sample components were detected with a multiangle light scattering (MALS) DAWN Heleos II (Wyatt Technology, Santa Barbara, CA) equipped with QELS (i.e., DLS) at 90° and an OptilabRex Refractometer (Wyatt Technology, Santa Barbara, CA) detectors. The MALS detector was normalized with bovine serum albumin (BSA). Calibration of scattering intensity was performed with HPLC-grade filtered toluene.
2.5. Small-Angle X-ray Scattering (SAXS). SAXS was performed at the high brilliance beamline ID02 at the European Synchrotron Radiation Facility (ESRF) in Grenoble, France. The 2D SAXS patterns were collected using a Rayonix MX-170HS ccd detector. The measured SAXS profiles were normalized to an absolute scale using the standard procedure reported elsewhere.39 A combination of two sample-to-detector distances (10 and 1 m) was employed, covering a total q-range from 0.01 to 6 nm−1. q is the scattering wave vector defined as q = (4π/λ) sin ϑ/2, λ being the wavelength (λ ∼ 1 Å) and ϑ the scattering angle. The solutions were loaded in a flow through capillary of 2 mm diameter to ensure an accurate subtraction of the background (water) and to minimize beam damage of the samples.
2.6. 1H Nuclear Magnetic Relaxation Dispersion (NMRD).
NMRD profiles were acquired at 298 K using a high sensitivity fast field cycling relaxometer (Stelar, Mede, Italy). The longitudinal relaxation rates were extracted by single-exponential fitting of magnetization decay or magnetization buildup curves at1H Larmor
frequencies ranging from 0.01 to 40 MHz. The errors of the collected relaxation rates were below 1%.1H NMRD profiles were collected for
PEO−PAA 5-38 and PEO−PAA 6-3 based PICs.1H NMRD profiles
for water solutions of DGL3 0.1 wt %, PEO−PAA 5-38 0.04 wt %, and PEO−PAA 6-3 0.09 wt % were also acquired for reference. These block copolymer concentrations were the maximum values used in the PICs solutions (the same as at R = 1).
1H NMR spectra were recorded in D
2O on a Bruker Avance 500
MHz. The DGL3 concentration wasfixed to 0.1 wt %.
2.7. Cryo-Electron Microscopy (Cryo-EM). 3μL of sample was deposited onto glow-discharged lacey carbon grids and placed in the
Table 1. Molar Masses of the Polymers Used As Characterized by1H NMR and Size Exclusion Chromatography name MnPEO or dendrigraft DGL3 (g mol−1) DPn PEO MnPAA (g mol−1) DPn PAA PEO−PAA 6-3 6000 136 3000 41 PEO−PAA 6-6.5 6000 136 6500 90 PEO−PAA 6-12 6000 136 12000 165 PEO−PAA 5-38 5000 114 38000 524 DGL3a 22200 aDP
nor number of NH2groups per DGL3 is 123.
thermostatic chamber of a Leica EM-GP automatic plunge freezer, set at 20°C and 95% humidity. Excess solution was removed by blotting with Whatman no. 1filter paper for 1 and 2 s, and the grids were immediately flash frozen in liquid ethane at −185 °C. The frozen specimens were placed in a Gatan 626 cryo-holder, and cryo-EM was carried out on a Jeol 2100 microscope, equipped with a LaB6cathode
and operating at 200 kV, under low dose conditions. Images were acquired with SerialEM software, with defocus of 1.5−3 μm, on a Gatan US4000 CCD camera. This device was placed at the end of a GIF Quantum energyfilter (Gatan, Inc.), operated in zero-energy-loss mode, with a slit width of 25 eV. Images were recorded at a nominal magnification of 4000 corresponding to calibrated pixel sizes of 1.71 Å. Images were analyzed with ImageJ software from which we inferred the average diameter and corresponding standard deviation (con-fidence intervals were given as average diameter ± twice standard deviation).
■
RESULTSAll the PICs presented here are based on poly(ethylene oxide)-b-poly(acrylic acid) (PEO−PAA)/dendrigraft polylysine (DGL3) (Scheme 1 and Table 1). Different PEO−PAA copolymers were selected in order to have a variety of molar masses and ratios between the two blocks. On the other hand, only dendrigraft polylysine generation three was used, with a molar mass of 22 200 g mol−1.
PICs were formed by adding the PEO−PAA stock solution to the diluted DGL3 solution. All PICs were formed at pH 7 with a ratio R = [AA]/[NH2] between 0.1 and 1. A comment is
noteworthy regarding the chosen range of R used here. The pKa
of DGL3α- and ε-amine functions can be estimated equal to 7 and 10, respectively,40ensuring that amine groups are mostly positively charged at pH 7. One has, however, to keep in mind that the pKavalue of PAA acid functions is highly dependent on
its environment; values between 4.641and 6.5 are reported in the literature. In the case of multilayer assemblies the apparent
pKavalue of PAA diminished to ca. 4 for only two layers and as much as 4 pH units for six layers.42In our case, we can thus reasonably assume that all the PAA units are in the carboxylate form, and therefore they would associate to the available DGL3 ammonium units.
In the following, we present the characterization of mixtures of PEO−PAA and DGL3 varying their ratios. Different complementary batch techniques (DLS, SAXS, NMRD, 1H
NMR) and a soft chromatographic separation method (FI-AsFlFFF) are discussed and compared.
Dynamic Light Scattering (DLS). Batch DLS results are presented inFigure 1. We typically titrated DGL3 with PEO− PAA varying R from 0 to 1. For all samples, the DLS analysis was performed only if the scattered light intensity was higher than 1000 counts per second (background level). Indeed, for poorly scattering solutions, the DLS curves were not analyzed. The evolution of the scattered light intensity (Figure 1A,B) exhibits two distinct types of behavior, either a regular increase over a large ratio range for PEO−PAA 5-38 or a lag phase followed by a sudden increase for all the other systems.
For PEO−PAA 5-38, the size of the objects did not significantly change between ratios 0.2 and 1 (Figure 1C,D), and polydispersity index slightly decreased (Table 3), while the scattered intensity regularly increased with R. This behavior can be associated with an increase of the number density of the scattering objects, the size of which does not evolve. This trend has been already observed in the literature5and is indicative of the presence in solution of complexes with a well-defined stoichiometry irrespectively of the R ratio. In this case, we can assume that objects of a well-defined size and composition are formed even for low ratios: their concentration, but not their nature, depends on R. The fact that the polydispersity index decreases while R increases is probably due to the presence of
Figure 1.Evolution of the scattering properties as a function of R ([AA]/[NH2]) for a solution of DGL3 0.1 wt % titrated with PEO−PAA: (A)
scattered light intensity at 173°; (B) zoom of the low value region of the scattered light intensity highlighted by a rectangle in (A); (C) intensity weighted hydrodynamic diameter; (D) number weighted hydrodynamic diameter. Lines are guides for the eye.
free DGL3 molecules in solution whose concentration diminishes.
For PEO−PAA 6-3 and PEO−PAA 6-6.5, the scattered light intensity increased suddenly at ratios close to 0.7−0.8. At this same ratio, the correlation function can be analyzed (seeFigure S1.1) to extract hydrodynamic sizes. This behavior could be indicative of complexes formed only close to R = 1. Further experimental evidence are required to conclude on the low mixing ratios.
On the other hand, for PEO−PAA 6-12, the scattered light intensity presented two linear regions with a boundary close to 0.7−0.8. The hydrodynamic radius could be extracted starting from R = 0.4; the number weighted size moderately increased with increasing R, whereas the intensity weighted size was roughly constant and the polydispersity index slightly decreased. These results suggest that PICs with well-defined stoichiometry formed even at low ratios as in the case of PEO− PAA 5-38.
Zeta Potentials. Zeta potentials (ζ) were also determined by electrophoretic light scattering (ELS) and are shown in
Figure 2as a function of the AA/NH2ratio.ζ is defined as the
potential of the plane where slip between the object and the bulk solution is assumed to occur.44It postulates nonporous objects exhibiting a hard surface and therefore not deformable upon shear. This is naturally doubtful for PICs. Furthermore, even the very existence of a slip plane is questioned for soft objects.44
Going beyond this issue, we consider here the qualitative trend ofζ as a function of R. ELS implies the detection of light scattered from the objects. The presence of a scattering intensity roughly 1 order of magnitude higher than that of the solvent is a prerequisite for reliable zeta potentials values. Therefore, we do not report the values for all the low R ratios. For all samples, a regular decrease ofζ is observed (Figure 2), leading to values close to zero when approaching R = 1. It means that for all investigated systems at R = 1 electrostatic charge is balanced in the nano-objects. For a pure DGL3 solution in the same conditions (0.01 wt % at pH 7)ζ could be measured equal to 42 mV, and this is in agreement with the extrapolation at R = 0 of straight lines ofFigure 2. On the other hand, the ζ trend cannot alone discriminate PICs formation processes. In the case of PEO−PAA 5-38 and PEO−PAA 6-12, from previously discussed DLS results, we observed that PICs
objects with well-defined stoichiometry formed already below R = 1. Indeed, for R below 1, ELS measures an average of free DGL3 molecules and PICs assemblies. For the other systems, the same trend could also originate from objects possessing a net positive charge on their surface, which decreases progressively with increasing the PEO−PAA quantity in an open association mechanism.
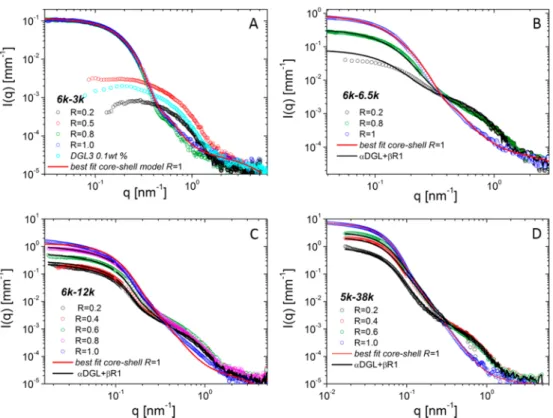
Small-Angle X-ray Scattering. In order to get further insight into the formation process of the assemblies, we performed a structural characterization study with SAXS.Figure 3shows the SAXS profiles of DGL3 0.1 wt % solution in the presence of the different PEO−PAA block copolymers at different ratios, andTable 2reports the fit results.
Wefirst discuss the peculiar case of PE0-PAA 6-3 presented inFigure 3A.
At low PEO−PAA content, the SAXS curves show a pronounced interaction peak at low q due to electrostatic repulsions between the charged molecules of DGL3. Then, the scattering intensity increases with the PEO−PAA content as the interactions between the two polymers diminish the effective DGL3 charge. The evolution of the scattering signal shows a clear transition between R= 0.5 and 0.8 when larger structures are present in solution. This is confirmed by the Guinier analysis of the scattering curves, which allows extracting the radius of gyration of the scattering objects for the different ratios (Table 3).
Above R = 0.8, the scattering curves could be described using a core−shell sphere form factor (eqs 4, 6, and 7 inSI.2), which includes also a term for the scattering at high q originating from the chain statistics and the interchain interactions of the polymer inside the shell. This intracorona contribution is well reproduced by an Ornstein−Zernike type term45 with an exponent typical for swollen polymer chains in good solvent. The scattering length densities (SLD) for lysine, PAA, and PEO calculated according to their molecular composition are 0.001 09, 0.001 32, and 0.001 04 nm−2, respectively. Assuming NH3+:AA− interactions in the core of the assemblies, we can
estimate for the SLD of the core an average starting value of 0.0012 nm−2, which was adjusted in the fitting procedure to 0.001 29 nm −2, in good accordance with theoretical expect-ations. The resulting value is higher than that of pure lysine molecules, indicating that the latter is not hydrated and mainly formed by DGL3 interacting with AA−groups, while the shell is mostly made by the hydrated PEO chains. The average size for the micellar core and shell was found equal to 5.3 and 6.6 nm, respectively (Table 2).
The values of the radius of gyration for R ≤ 0.5 are comparable with the size of the DGL3 alone. Nevertheless, their scattering curves change with respect to pure DGL3. In order to better understand the origin of the scattering signal, the curves have been modeled with linear combination of the experimental scattering intensity of noninteracting DGL3 and PEO−PAA (Figure SI.2.1 in SI.2in the case of R = 0.5). The curves could be described neither as the sum of noninteracting DGL3 and PEO−PAA nor as pure micelles (R = 1) or a mixture of micelles (R = 1) and DGL3 alone. This suggests that when PEO−PAA is added in solution, it starts interacting with DGL3. The observed increase of the low-q intensity can be explained with the decrease of the net DGL3 charge (correspondingly less repulsive interactions), the corresponding increase of the SLD of the core with respect to DGL3 alone due to NH3+:AA− electrostatic screening, and the increase of
the total molar mass.
Figure 2. Zeta potentials of PICs self-assemblies. The ratios correspond to that of acrylic acid units over amine units. (○) PEO−PAA 5-38, (■) PEO−PAA 6-12, PEO−PAA 6-6.5, (◆) PEO− PAA 6-3.
We can then conclude that in analogy to “monodendrimer” complexes already observed by Gelissen et al.,46at low R values, DGL3: PAA complexes are present in solution; the PEO block in the shell is highly solvated so only the DGL3 size is clearly resolved by SAXS.
Micelles with a coacervate core and a PEO shell form only approaching R = 1. A further experimental proof of the presence of NH3+: AA−interactions at ratios lower than 0.8 was
then gained by recording 1H NMR spectra on solutions
containing DGL3 and PEO−PAA 6-3 at different ratios (see subsequent part).
Let us now consider the other block copolymers, PEO−PAA 6-6.5, PEO−PAA 6-12, and PEO−PAA 5-38, whose scattering curves are shown inFigures 3B−D. In the case of R = 1 all the objects formed are spherical. The homogeneous sphere model is usually employed in the literature,48 and the core contribution is more often the dominant one due to the shell solvation. In our case, the core−shell model works well for the shorter PAA block; for the longer ones the model under-estimates both the size and the SLD of the core, toward unphysical values. For this reason, we preferred using a homogeneous sphere model (eqs 5−7 inSI.2) with a value of
the contrast balanced between the one of the NH3+: AA−
adducts and PEO. Thefit results are reported inTable 2. For R smaller than 1 (see Figures 3B−D), the scattering curves present two different features in the q range investigated: (a) the scattering signal at low q increases with R, (b) at high q it decreases, and the second shoulder disappears when R = 1. The analysis of SAXS data proves that the solutions can be better described as a mixture of micelles with 1:1 stoichiometry and free DGL3 molecules rather than micelles growing when the PEO−PAA content increases. This is well illustrated in the case of PEO−PAA 6-6.5: when using the core−shell model (eq 4 inSI.2) tofit the experimental data at different R values, the scattering signal in the high-q region cannot be only described by thefluctuations of the polymeric chains in the corona and in order to compensate for the high-q scattering signal a too high and unphysical value for the SLD of the core is demanded. On the contrary, the scattering curves are well described by a mixture of charge balanced micelles (stoichiometry 1:1) and free DGL3 molecules. With increasing the amount of PEO− PAA, the micelles number density in solution increases (the scattering intensity increases at low q), and correspondingly the content of free DGL3 decreases (the scattering intensity decreases at high q until disappearing at R = 1). We consider that the concentration of the block copolymer free in solution is negligible, and the scattering curves are modeled with a linear combination of the scattering signals from free DGL3 and the core−shell micelles completely formed at R = 1 (charge balanced micelles):
α β
= + =
I q( ) I q( )DGL3 I q( )R 1
The best values of parametersα and β are reported inTable SI.2.2, and the corresponding curves are showed in Figures 3B−D. In all cases the solution is mainly constituted by
Figure 3.Small-angle X-ray scattering as a function of the scattering vector for PEO−PAA/DGL3 solutions. The DGL3 concentration is constant and equal to 0.1 wt %; PEO−PAA is added at different R = AA/NH2ratios in the case of (A) PEO−PAA 6-3, (B) PEO−PAA 6-6.5, (C) PEO−PAA
6-12, and (D) PEO−PAA 5-38.
Table 2. Fitting Parameters for the Core−Shell Model Described inSI.2 (Eqs 4, 6, and 7) in the Case ofR = 1a
Rcore(nm) Rshell(nm) Rsphere
PEO−PAA 6-3 5.3± 1 6.6 PEO−PAA 6-6.5 7.8± 2 9.2
PEO−PAA 6-12 15± 5
PEO−PAA 5-38 30± 9
aR
coreand Rshellare respectively the core radius and the shell radius of
the assemblies.ρcore andρshare 0.001 29 nm−2 and 0.001 04 nm−2
noninteracting DGL3 molecules until R = 0.8. This is in agreement with the sudden increase of the light scattering intensity signal observed inFigures 1A,B around this value of R for the three copolymers.
It should be noted that the above-cited model does not perfectly describe the behavior of the scattering curves in the low q range for R = 0.2 of PEO−PAA 6-6.5 and the intermediate q region of PEO-PAA 6-12 and PEO−PAA 5-38. Additional structural information might contribute to the overall scattering signal. This will be discussed later in text in comparison with the results from the other experimental techniques. In conclusion, structural investigation with SAXS indicates that for PEO−PAA 5-38, PEO−PAA 6-12 and PEO− PAA 6-6.5 micelles already form at low R values, but all DGL3 molecules are incorporated in micelles only at 1:1 stoichio-metric ratio. These results are more in accordance with a close association type mechanism, but we cannot exclude the presence of micelles with stoichiometry different from 1:1.
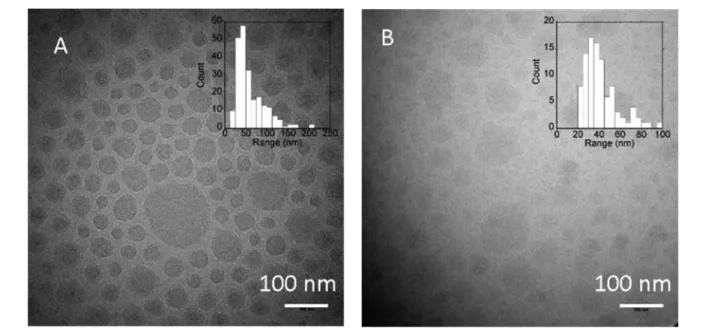
Cryo-EM. Cryo-EM was also employed to characterize some PICs at R = 1 (Figure 4). However, due to poor contrast, only PEO−PAA 5-38 and PEO−PAA 6-12 images could be analyzed. It must be underlined that in cryo-TEM no contrast agent is used, so the contrast of the objects depends on their chemical nature and density. PEO−PAA 6-12 based PICs possessed lower contrast than PEO−PAA 5-38, possibly because they were more hydrated. The statistical analysis provides an average diameter of 60± 34 and 42 ± 16 nm for PEO−PAA 5-38 and PEO−PAA 6-12, respectively, consistent with the SAXS (60± 19 and 30 ± 10 nm) and DLS (92 ± 18 and 68± 15 nm) analyses.
1H NMR. As discussed in the previous paragraphs, charged
balanced micelles are formed at all mixing ratios in the case of all used PEO−PAA with the exception of PEO−PAA 6-3. SAXS experiments suggested that an interaction between the groups of opposite charge already occurred at low mixing ratios.
1H NMR spectra were then recorded at different mixing ratios.
Table 3. Comparison of PICs Size Obtained from Different Techniques
PEO− PAA R RgbSAXS (nm) ReSAXS (nm) Rg(n)cFFF (nm) Rh(n)cFFF (nm) Rg/RhFFF (n) Rhnumber DLSd (nm) RhInt DLSd (nm) cumulant PDI RgSAXS/Rh DLS 5-38 0.2 33 43 53 0.16 0.62 0.4 31.5 36 43 0.14 0.73 0.6 31.5 39 48 0.10 0.66 0.8 40 49 0.07 1 34 30.6 26/46a 38/53 0.68/0.87 35 46 0.07 0.7 6-12 0.2 17 n.d n.d n.d 0.4 18.5 31 38 0.55 24 37 0.11 0.5 0.6 18 16 28 0.57 27 33 0.12 0.55 0.8 18.7 17/27a 20/41a 0.85/0.66a 27 33 0.09 0.57 1 19 16.5 25 35 0.71 30 34 0.06 0.56 6-3 0.2 2.4 0.4 3.3 0.5 3.3 0.6 3.3 0.8 10 12.6 12 18 0.67 15 30.5 0.3 0.33 1 9.8 11.9 17 27 0.63 21 28 0.1 0.35
aBimodal.b30% error.cThe error for each sample is provided inTable SI.4.1; in most cases, this was below 15%.dAs discussed in theMaterials and
Methodssection, the error was estimated in the 10−20% range.eThe radius of the object as obtained from thefitting procedure.
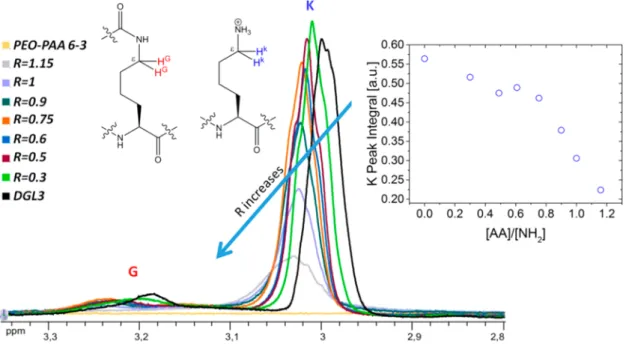
Figure 5presents a zoom of protons K and G of the polylysine polymer and shows a downfield shift of the signals by increasing the amount of carboxylic groups. The evolution of the K peak integral is shown in the inset of Figure 5. The signal integral decreases slowly until R = 0.6, when a dramatic decrease starts, which can be attributed to the micelle formation.
Therefore, NMR experiments confirm that PEO−PAA 6-3 interacts with DGL3 already at low ratios, even if micelles are not formed yet.
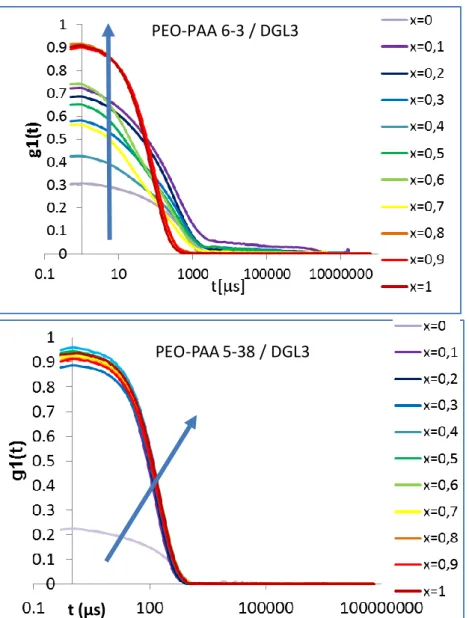
1H NMRD. Relaxometry profiles were collected at 298 K for
water solutions of DGL3, and for PEO−PAA 5-38 and PEO− PAA 6-3 based PICs (Figure 6). The measured1H relaxation rates are due tofluctuations in energy of the proton−proton dipole−dipole interactions and depend on the time constants of the motions modulating such interactions. Therefore, they can provide information on the characteristic time constants of such motions.49−51The profiles of DGL3 and the two block copolymers showed a single dispersion at high fields, corresponding to a correlation time of about 3 ns (Figure SI.3.1 inSI.3).
When PEO−PAA 6-3 was added with R = 0.2, only a very small difference could be detected with respect to the NMRD profile of DGL3 alone; on the other hand, the relaxation rates increased appreciably at R = 0.5, without any dispersion appearing below 1 MHz. Only at R = 1, a lowfield dispersion (at about 0.1 MHz) appeared, indicating the presence of slow reorienting aggregates. The NMRD profiles were fitted using eq 1 described inSI.3.52−54Three correlation times were needed for the fit of the curve obtained at R = 1, whereas two correlation times were enough for thefit of the curves at lower ratio (Table SI.3.1 in SI.3). The fastest correlation time was fixed to 3 ns, as obtained from the DGL3 profile, and in agreement with the average value obtained from the bestfit τ3
values obtained from all collected profiles (see Table SI.3.1 in
SI.3). The intermediate correlation times ranged from 60 (R = 0.2 and R = 0.5) to 130 ns (R = 1), indicating the presence of motions slower than 3 ns (observed for DGL3 and for the two block copolymers), presumably arising for the presence of NH3+:AA−interactions. The slowest correlation time at R = 1
was about 1100 ns.
Figure 5.Evolution of1H NMR spectra of polylysine protons. Spectra are registered in D
2O with DGL3 0.1 wt % with different PEO−PAA 6-3
amounts of stock solution at pH 7 (adjusted with NaOH). Insets: scheme of lysine residues interested in the NH3+: AA−interactions; evolution of K
polylysine protons integral in1H NMR spectra while increasing R = [AA]/[NH 2].
Figure 6.1H NMRD profiles for PICs solution at different acid/amine ratios: (A) PEO−PAA 6-3:DGL3 at 0.2:1 (+), 0.5:1 (○), and 1:1 (●) ratios;
(B) PEO−PAA 5-38:DGL3 at 0.2:1 (◇) and 1.1 (◆) ratios. In all solutions, the DGL3 concentration wasfixed to 0.1 wt %. The lines are the best fit profiles calculated with the parameters reported inTable S1 3.
In PEO−PAA 5-38 based PICs, the low field relaxation rates appreciably increased even for a small ratio (R = 0.2), and the presence of a lowfield dispersion (between 0.01 and 0.1 MHz), corresponding to a slow correlation time, could be clearly appreciated. This indicates the presence of slow reorienting aggregates already at low R values. When R was increased to 1, the increase in the lowfield relaxation rates became higher as a result of the larger contribution from the slow reorienting aggregates, with an inflection positioned basically at the same field. This indicated that the size of the formed aggregates did not increase with increasing R; only their concentration did. The NMRD profiles were fitted using eq 1 described in SI.3
and three correlation times, after checking that two correlation times were not sufficient to satisfactorily reproduce the profiles. Since the obtained bestfit values of the correlation times τi(i =
1, 2, 3) were very similar when an unconstrained fit was performed,τ1andτ2were constrained to have the same values in thefit of the two PEO−PAA 5-38 based PICs profiles. As for PEO−PAA 6-3 based PICs, τ3wasfixed to 3 ns. The fit was in
good agreement with the experimental data and indicated the presence of a fast correlation time of about 2200 ns and an intermediate one of 120 ns for both 0.2 and 1 ratios. The contributions of these correlation times increased with increasing R, as a result of the larger fraction of protons in the aggregates. We can then conclude that the slow reorienting aggregates characterized by the high correlation times are the micelles described in the SAXS section. This indicated the presence of the micelles only at R = 1 in the case of PEO−PAA
6-3, even if the sign of interactions are already present for lower R values. Instead, in the case of PEO−PAA 5-38 micelles are present already at R = 0.2, and their concentration increases with the copolymer content. It should be stressed that the slowest correlation time obtained for PEO−PAA 5-38 is a factor 2 smaller than the slowest time obtained for PEO−PAA 6-3. This finding is in line with the smallest hydrodynamic radius measured for PEO−PAA 6-3.
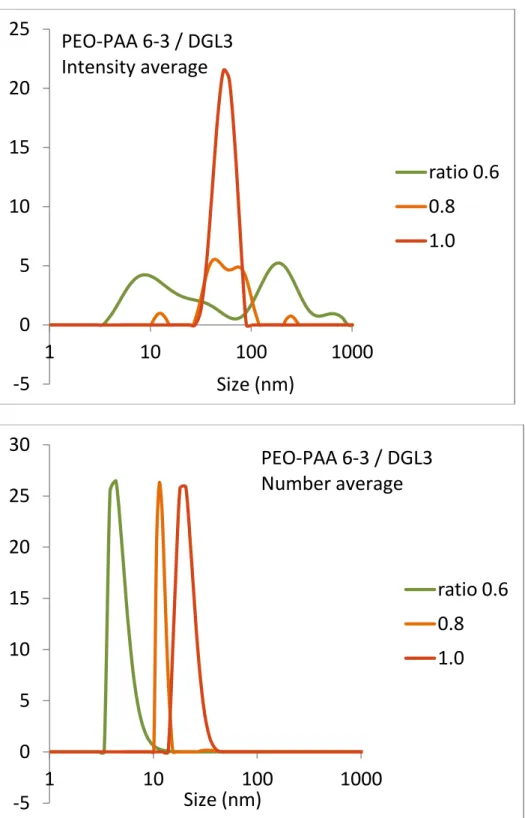
Field Flow Fractionation. We performed experiments usingfield flow fractionation which allows for a separation of nano-objects according to their size. Figure 7 shows the fractograms relative to PEO−PAA 6-3 and PEO−PAA 6-12 which represent well the two different behaviors. The fractograms relative to the other polymers are reported in the
Supporting Information(Figure SI.4.2).
Figures 7A,C show the refractive index signal, which is more sensitive to species concentration. For both PEO−PAA 6-3 and PEO−PAA 6-12, a low retention time peak (t = 6.5 min), corresponding to DGL3 molecules, was present for all ratios, and it drastically diminished at R = 0.8.
For PEO−PAA 6-3 a peak at retention time around 30 min appeared at R = 0.8. According to the DLS signal (Figure 7B), this peak belongs to scattering objects with Rh= 30 nm. They are the core−shell micelles revealed with SAXS. For PEO−PAA 6-12 a peak at retention time around 25 min appeared at R = 1 in the refractive index signal, and it corresponded to nano-objects with a 43 nm hydrodynamic radius; they are the spherical micelles revealed by SAXS (Figure 3). It must be
Figure 7.Characterization of PEO−PAA/DGL3 PICs by FI-AsFlFFF at different ratios. The ratios correspond to that of acrylic acid units over amine units. (○) ratio 0.2, (□) ratio 0.4, (◇) ratio 0.6, (×) ratio 0.8, (▽) ratio 1.0. (A) PEO−PAA 6-12 RI signal, (B) PEO−PAA 6-12 DLS signal, (C) PEO−PAA 6-3 RI signal,(D)PEO−PAA 6-3 DLS signal.
stressed that PEO−PAA 6-12 SAXS data showed the presence of PICs at 1:1 stoichiometry already at low R values: from 13% to 55% of the scattering signal at R = 0.2 and R = 0.8, respectively (Table SI.2.2). From FI-AsFlFFF, it looked like the complexes were concentrated enough to be detected by the refractive index signal only at R = 1. On the other hand, a very small DLS signal appeared already at R = 0.2, and it could be exploited from R = 0.4. It indicated objects with size increasing up to ratio 1. In particular, at R = 0.6 the DLS signal was a large peak corresponding to a mean Rh= 28 nm, and at R = 0.8 two
populations with Rh equal to 22 and 38 nm appeared, while
only the biggest one (Rh= 43 nm) was present at R = 1. The presence of different populations can account for the difficulties in describing the intermediate-q SAXS spectra as the sum of DGL3 molecules and nano-objects with 1:1 stoichiometry (Figure 3C).
■
DISCUSSIONPICs Size and Structure: Insights from the Different Experimental Techniques. Table 3 (and Table SI.4.2) compares the size values obtained from the different techniques. As for Rh determination, in most cases, a good
agreement between FlFFF and DLS was observed. Regarding Rg values, those obtained from FlFFF are often higher than
those obtained from SAXS data. The differences are within the experimental errors and the bigger discrepancies are found in the case of PEO−PAA 6-3, the smallest polymer, whose size is at the limit of light scattering resolution. Nevertheless, the trend of objects’ sizes is the same whichever the technique was; i.e., the overall micellar size decreases while the size of the PAA, the core forming block, decreases. Correspondingly, the Rg/Rh ratio diminishes. Rg/Rhratios for the PICs of this study fall well
in the quite wide range, from 0.3 to 1.3, reported in the literature. These values have been attributed to core−shell morphology and the density of the core whose size is generally linked to the Rg.15Indeed, inhomogeneity in mass density (a
core much denser than the shell, for example) can lead to differences in Rg/Rhvalues which are difficult to predict. In our case, the more important differences changing the PAA size are found in the Rg values, they diminish more strongly than Rh: the lower Rg/Rh values in the case of PEO−PAA 6-3 based
PICs indicate a dense core; instead, for PEO−PAA 5-38 based PICs, the higher Rg/Rh values suggest a more homogeneous structure. Such a trend is indeed in agreement with the angular analysis of the scattering intensity: the nature of the self-assemblies at R = 1 depends on the block copolymer composition. SAXS data could be modeled with a core−shell morphology only in the case of the PEO−PAA 6-3 and PEO− PAA 6-6.5, i.e. copolymers with the smaller PAA block. The size of the core extracted for PAA 6-3 and PEO−PAA -6.5 (5.3 and 7.8 nm, respectively) allows reasonable assumption that
more than one DGL3 is present in the core and seems dictated by the number of carboxylic groups on the same polymer chain which can interact with DGL3 molecules. Nevertheless, the absolute number of DGL3 is difficult to extract owing to the expected compaction of the objects core, like in the case of DNA vectors.
For the two other copolymers, PAA 6-12 and PEO−PAA 5-38, the number of AA groups in a polymer chain is higher than the number of amine groups on a DGL3 molecule; then more than one DGL3 can interact with the same polymer chain. As a consequence, a higher number of block copolymer is necessary in order to stabilize the coacervate complex, which leads to the formation of larger self-assemblies. The complex is probably more hydrated and less compact than in the case of the smaller copolymers; then the self-assemblies are better described as a homogeneous sphere. This is also confirmed by the cryo-EM images where no density gradient could be detected (Figure 4). Processes of PICs Formation. Table 4 summarizes the observations of the different experimental techniques. In the case of PEO−PAA 6-3 the steep increase of the scattering intensity and the fast decrease of the1H NMR peak integrals
above R = 0.7 indicate the threshold for PIC micelles formation. At this R value, scattering objects with well-defined size are observed with DLS, the SAXS curve can be analyzed with a core−shell sphere model, a large time retention peak is detected with FlFFF, and a third correlation time appears in the
1H NMRD spectrum: the ensemble of the results indicates the
formation of well-defined PICs objects. Below R = 0.8, no well-defined Rhvalue can be determined by DLS, and no retention
peak associated with micelle formation could be detected by FlFFF. Nevertheless, SAXS and NMR give clear experimental evidence of the association of carboxylate and ammonium groups even below R = 0.7: Rgincreases with R (Table 3), the
K proton integrals diminish, and a second correlation time appears already at R ≤ 0.5 (Table SI.3.1 in SI.3). The low retention time observed in the FlFFF fractograms brings the same conclusion: free DGL3 molecules or DGL3 interacting with few, highly hydrated PEO−PAA chains (whose charges are not completely balanced) exist before the appearance of 1:1 stoichiometry complexes at R = 0.8.
The observed self-assembling mechanism is then different from the closed association one usually observed for amphiphilic molecules with critical micellar concentration.
Referring toTable 4, for the other block copolymers, SAXS detects the presence of 1:1 stoichiometry PICs already at R = 0.2, while the size and concentration of the assemblies are high enough to be detected by DLS at this ratio only in the case of PEO−PAA 5-38. For this latter block copolymer, also 1H
NMRD detects the presence of species with the same correlation times as at R = 1. FI-AsFlFFF brings interesting information (Figure SI.4.2): the peak in the fractogram at R = 1 Table 4. Comparison of the Behavior Observed for All PICs with the Different Methods of Characterization as a Function of R
PEO− PAA
scattered light
intensity size by DLS FI-AsFlFFF SAXS 1H NMRD 1H NMR
6-3 ↑ for R > 0.7 R > 0.7 PICs detected at R = 0.8 low retention
time peak R < 1 ↑ for R > 0.7
evolution of PICs up to R = 1
abrupt change∼ R = 0.7 6-6.5 ↑ for R > 0.7 ↑ for R > 0.7 increases above R = 0.8 PICs detected at
R = 0.2 6-12 ↑ for R > 0.6 ∼ constant for
R≥ 0.4
PICs detected at R = 0.2 low retention time peak R < 1
PICs detected at R = 0.2 5-38 linear ∼ constant PICs detected at
R = 0.2
PICs detected at R = 0.2
reveals the presence of two populations. SAXS cannot distinguish between 30% polydisperse spheres with mean Rg
of 30 nm and the two populations evidenced by FI-AsFlFFF (Rg 26 and 46 nm). These two populations indicate a mixture of PICs with different AA−:NH3 + ratios. The presence of
different species may explain the lower agreement of the linear combination approach in the low-q region for R < 1 in SAXS spectra (Figure 3D).
In the case of PEO−PAA 6-12, the presence of charge-balanced PICs could be detected by DLS only from R = 0.4. This is not surprising since from the linear combination of SAXS curves it results that their contribution to scattering signal is still quite low, ca. 16%. As for FI-AsFlFFF, the peak in the fractogram is quite large at R = 0.6 and reveals the presence of two populations at R = 0.8. In both cases the linear combination of the scattering curve of DGL3 and of micelles at R = 1 does not perfectly describe the data in the intermediate q range (Figure 3C). This is indeed related to the presence of more PICs species detected through FI-AsFlFFF analysis of the solutions. Also in this case from SAXS only, it is difficult to distinguish between quite polydisperse micelles and two close populations when even free small species, i.e., DGL3, are present in solution (Rg = 18.7 nm with about 30%
polydispersity according to SAXS and two populations with most probable values of Rgof 17 and 27 nm according to
FI-AsFlFFF, as in the case of R = 0.8, Table 3). Therefore, FI-AsFlFFF helps to distinguish among the two circumstances.
In the case of PEO−PAA 6-6.5 at R = 0.2 big assemblies clearly exist according to SAXS results, but the linear combination approach does not fully describe the curve, which means that other species different from the charge balanced micelles and DGL3 molecules already form at this ratio. These species exist at very low concentration and their
presence can be detected by DLS only from R = 0.7 when their scattering contribution is near 50% (seeTable SI.2.1).
Therefore, the complementarity of different techniques indicates a complex scenario where for all ratios smaller than 1, free DGL3 molecules (or DGL3 interacting with few, highly hydrated PEO−PAA chains) coexist with 1:1 stoichiometry micelles and slightly smaller micelles, whose charge is probably not balanced.
The concepts of open and closed association processes are somehow misleading and insufficient to describe such complex scenarios.
■
CONCLUSIONPICs self-assemblies are complex systems, highly responsive to the external medium conditions like ionic strength and pH, which are inherent to their electrostatic nature. Nevertheless, they are quite interesting and versatile systems easily prepared, directly in water. In this work, we have demonstrated that by combining several experimental approaches, valuable informa-tion explaining the formainforma-tion process and the nature of these objects may be obtained. Self-assemblies with a homogeneous structure were formed when the PAA block size exceeded that of the PEO block, and more than one DGL3 can interact with one block copolymer chain. Instead, core−shell micelles with a dense core were formed when the number of AA units in the block copolymer was lower than or equal to the charged groups in DGL3. The mechanism of formation seems also to depend on the length of the PAA chain in the block copolymer.
Two representative cases of processes for the formation of the PICs (Scheme 2) can be highlighted: For PEO−PAA 6-3, loose interactions between AA−and NH3+ moieties exist even
for low R ratios. These interactions are not strong enough to lead to the formation of nano-objects. Well-defined PICs, Scheme 2. Proposed Mechanism of PIC Formation in the Extreme Cases of Short or Long PAAa
aIn both cases at R = 1 PIC assemblies characterized by 1:1 stoichiometry are formed. Below R = 1 different species are simultaneously present in
however, form as soon as a threshold of 0.7 is passed. In the final PIC, several DGL3 chains are reasonably present in the core as determined by SAXS. The other case is that of the other copolymers for which 1:1 stoichiometry objects are formed even for low R ratios and their concentration increases with increasing R. These charge-balanced PICs coexist with free DGL3 molecules and/or nano-objects with different stoichi-ometry (whose charge is not balanced), the size and the concentration of which increase with R.
This is reminiscent of “host−guest” soluble IPECs which form when the host chain is larger and in big excess with respect to the guest one (the case of PEO−PAA 6-3 at small R).3 On the contrary, insoluble IPEC forms when the concentration of the guest chain (the increase of R in the case of PEO−PAA 6-3) or its size (the case of PEO−PAA 5-38 at small R) is increased. In our case the presence of PEO chains guarantees colloidal stability so precipitation is avoided in all cases.
The previously described open or closed processes seem then inadequate to fully describe the mechanisms of formation in the case of charge-driven self-assembly, and the processes involved in traditional inter polyelectrolyte complexes have to be considered.
■
ASSOCIATED CONTENT*
S Supporting InformationThe Supporting Information is available free of charge on the
ACS Publications website at DOI: 10.1021/acs.macro-mol.7b02391.
Characterization of commercial PEO−PAA copolymers, relaxometry results, FI-AsFlFFF (PDF)
■
AUTHOR INFORMATION Corresponding Author *(B.L.) Fax (33) (0)5 61 55 81 55; Tel (33) (0)5 61 55 68 04; [email protected]. ORCID Debora Berti: 0000-0001-8967-560X Giacomo Parigi:0000-0002-1989-4644 Claudio Luchinat: 0000-0003-2271-8921 Barbara Lonetti: 0000-0003-4291-6861 NotesThe authors declare no competingfinancial interest.
■
ACKNOWLEDGMENTSThis work was funded by the Midi-Pyrénées region and University of Toulouse. ESRF is acknowledged for the provision of beam time for SAXS measurements, Vanessa Soldan for help in cryo-EM experiments, and Colcom (Montpellier, France) for the kind DGL gift. Besides, the authors thank N. Lauth-de Viguerie, H. H. Nguyen, and L. Garrelly for fruitful discussions. G.P. and C.L. acknowledge the COST Action CA15209 “European Network on NMR Relaxometry”, Fondazione Cassa di Risparmio di Firenze, Consorzio Interuniversitario CIRMMP, and Instruct, part of the European Strategy Forum on Research Infrastructures (ESFRI); specifically, we thank the ESFRI Core Centre CERM, Italy.
■
REFERENCES(1) Thünemann, A. F.; Müller, M.; Dautzenberg, H.; Joanny, J.-F.; Löwen, H. Polyelectrolyte complexes. Adv. Polym. Sci. 2004, 166, 113− 171.
(2) Kabanov, V. A. Basic Properties of Soluble Interpolyelectrolyte Complexes Applied to Bioengineering and Cell Transformations. In Macromolecular Complexes in Chemistry and Biology; Dubin, P., Bock, J., Davis, R., Schulz, D. N., Thies, C., Eds.; Springer: Berlin, 1994; pp 151−174.
(3) Kabanov, V. A.; Zezin, A. B. Soluble interpolymeric complexes as a new class of synthetic polyelectrolytes. Pure Appl. Chem. 1984, 56 (3), 343−354.
(4) Harada, A.; Kataoka, K. Formation of Polyion Complex Micelles in an Aqueous Milieu from a Pair of Oppositely-Charged Block Copolymers with Poly(ethylene glycol) Segments. Macromolecules 1995, 28 (15), 5294−5299.
(5) Harada, A.; Kataoka, K. Novel Polyion Complex Micelles Entrapping Enzyme Molecules in the Core: Preparation of Narrowly-Distributed Micelles from Lysozyme and Poly(ethylene glycol)− Poly(aspartic acid) Block Copolymer in Aqueous Medium. Macro-molecules 1998, 31 (2), 288−294.
(6) Harada, A.; Kataoka, K. Novel Polyion Complex Micelles Entrapping Enzyme Molecules in the Core. 2. Characterization of the Micelles Prepared at Nonstoichiometric Mixing Ratios. Langmuir 1999, 15 (12), 4208−4212.
(7) Kakizawa, Y.; Harada, A.; Kataoka, K. Environment-Sensitive Stabilization of Core−Shell Structured Polyion Complex Micelle by Reversible Cross-Linking of the Core through Disulfide Bond. J. Am. Chem. Soc. 1999, 121 (48), 11247−11248.
(8) Harada, A.; Kataoka, K. Polyion complex micelles with core-shell structure: their physicochemical properties and utilities as functional materials. Macromol. Symp. 2001, 172 (1), 1−10.
(9) Pergushov, D. V.; Muller, A. H. E.; Schacher, F. H. Micellar interpolyelectrolyte complexes. Chem. Soc. Rev. 2012, 41 (21), 6888− 6901.
(10) Voets, I. K.; Moll, P. M.; Aqil, A.; Jérôme, C.; Detrembleur, C.; de Waard, P.; de Keizer, A.; Cohen Stuart, M. A. Temperature Responsive Complex Coacervate Core Micelles With a PEO and PNIPAAm Corona. J. Phys. Chem. B 2008, 112 (35), 10833−10840.
(11) Bourouina, N.; de Kort, D. W.; Hoeben, F. J. M.; Janssen, H. M.; Van As, H.; Hohlbein, J.; van Duynhoven, J. P. M.; Kleijn, J. M. Complex Coacervate Core Micelles with Spectroscopic Labels for Diffusometric Probing of Biopolymer Networks. Langmuir 2015, 31 (46), 12635−12643.
(12) Kim, W.; Yamasaki, Y.; Jang, W.-D.; Kataoka, K. Thermody-namics of DNA Condensation Induced by Poly(ethylene glycol)-block-polylysine through Polyion Complex Micelle Formation. Biomacromo-lecules 2010, 11 (5), 1180−1186.
(13) Marín-Menéndez, A.; Montis, C.; Díaz-Calvo, T.; Carta, D.; Hatzixanthis, K.; Morris, C. J.; McArthur, M.; Berti, D. Antimicrobial Nanoplexes meet Model Bacterial Membranes: the key role of Cardiolipin. Sci. Rep. 2017, 7, 41242.
(14) Chen, H.; Xiao, L.; Anraku, Y.; Mi, P.; Liu, X.; Cabral, H.; Inoue, A.; Nomoto, T.; Kishimura, A.; Nishiyama, N.; Kataoka, K. Polyion Complex Vesicles for Photoinduced Intracellular Delivery of Amphiphilic Photosensitizer. J. Am. Chem. Soc. 2014, 136 (1), 157− 163.
(15) Warnant, J.; Marcotte, N.; Reboul, J.; Layrac, G.; Aqil, A.; Jerôme, C.; Lerner, D. A.; Gérardin, C. Physicochemical properties of pH-controlled polyion complex (PIC) micelles of poly(acrylic acid)-based double hydrophilic block copolymers and various polyamines. Anal. Bioanal. Chem. 2012, 403 (5), 1395−1404.
(16) Han, Y.; Li, J.; Zan, M.; Luo, S.; Ge, Z.; Liu, S. Redox-responsive core cross-linked micelles based on cypate and cisplatin prodrugs-conjugated block copolymers for synergistic photothermal-chemo-therapy of cancer. Polym. Chem. 2014, 5 (11), 3707−3718.
(17) Bayati, S.; Bergquist, K.-E.; Zhu, K.; Nyström, B.; Skov Pedersen, J.; Galantini, L.; Schillén, K. Mixed micelles of oppositely
charged poly(N-isopropylacrylamide) diblock copolymers. J. Polym. Sci., Part B: Polym. Phys. 2017, 55 (19), 1457−1470.
(18) Maggi, F.; Ciccarelli, S.; Diociaiuti, M.; Casciardi, S.; Masci, G. Chitosan Nanogels by Template Chemical Cross-Linking in Polyion Complex Micelle Nanoreactors. Biomacromolecules 2011, 12 (10), 3499−3507.
(19) Harada, A.; Kataoka, K. Effect of Charged Segment Length on Physicochemical Properties of Core−Shell Type Polyion Complex Micelles from Block Ionomers. Macromolecules 2003, 36 (13), 4995− 5001.
(20) De Santis, S.; Diana Ladogana, R.; Diociaiuti, M.; Masci, G. Pegylated and Thermosensitive Polyion Complex Micelles by Self-Assembly of Two Oppositely and Permanently Charged Diblock Copolymers. Macromolecules 2010, 43 (4), 1992−2001.
(21) Chelushkin, P. S.; Lysenko, E. A.; Bronich, T. K.; Eisenberg, A.; Kabanov, V. A.; Kabanov, A. V. Polyion Complex Nanomaterials from Block Polyelectrolyte Micelles and Linear Polyelectrolytes of Opposite Charge: 1. Solution Behavior†. J. Phys. Chem. B 2007, 111 (29), 8419− 8425.
(22) Gohy, J.-F.; Varshney, S. K.; Antoun, S.; Jérôme, R. Water-Soluble Complexes Formed by Sodium Poly(4-styrenesulfonate) and a Poly(2-vinylpyridinium)-block-poly(ethyleneoxide) Copolymer. Mac-romolecules 2000, 33 (25), 9298−9305.
(23) Herlambang, S.; Kumagai, M.; Nomoto, T.; Horie, S.; Fukushima, S.; Oba, M.; Miyazaki, K.; Morimoto, Y.; Nishiyama, N.; Kataoka, K. Disulfide crosslinked polyion complex micelles encapsulat-ing dendrimer phthalocyanine directed to improved efficiency of photodynamic therapy. J. Controlled Release 2011, 155 (3), 449−457. (24) Wang, J.; Zhao, D.; Wang, Y.; Wu, G. Imine bond cross-linked poly(ethylene glycol)-block-poly(aspartamide) complex micelle as a carrier to deliver anticancer drugs. RSC Adv. 2014, 4 (22), 11244− 11250.
(25) Chuanoi, S.; Anraku, Y.; Hori, M.; Kishimura, A.; Kataoka, K. Fabrication of Polyion Complex Vesicles with Enhanced Salt and Temperature Resistance and Their Potential Applications as Enzymatic Nanoreactors. Biomacromolecules 2014, 15 (7), 2389−2397. (26) Luo, Y.-L.; Yuan, J.-F.; Shi, J.-H.; Gao, Q.-Y. Synthesis and characterization of polyion complex micelles and their controlled release of folic acid. J. Colloid Interface Sci. 2010, 350 (1), 140−147.
(27) Park, J.-S.; Akiyama, Y.; Yamasaki, Y.; Kataoka, K. Preparation and Characterization of Polyion Complex Micelles with a Novel Thermosensitive Poly(2-isopropyl-2-oxazoline) Shell via the Complex-ation of Oppositely Charged Block Ionomers†. Langmuir 2007, 23 (1), 138−146.
(28) Lefevre, N.; Fustin, C.-A.; Gohy, J.-F. Polymeric Micelles Induced by Interpolymer Complexation. Macromol. Rapid Commun. 2009, 30, 1871−1888.
(29) Zhang, J.; Chen, S.; Zhu, Z.; Liu, S. Stooped-flow kinetic studies of the formation and disintegration of polyion complex micelles in aqueous solution. Phys. Chem. Chem. Phys. 2014, 16, 117.
(30) Monteserín, M.; Burrows, H. D.; Mallavia, R.; Di Paolo, R. E.; Maçanita, A. L.; Tapia, M. J. How to Change the Aggregation in the DNA/Surfactant/Cationic Conjugated Polyelectrolyte System through the Order of Component Addition: Anionic versus Neutral Surfactants. Langmuir 2010, 26 (14), 11705−11714.
(31) Pergushov, D. V.; Babin, I. A.; Zezin, A. B.; Müller, A. H. E. Water-soluble macromolecular co-assemblies of star-shaped polyelec-trolytes. Polym. Int. 2013, 62 (1), 13−21.
(32) Sousa-Herves, A.; Fernandez-Megia, E.; Riguera, R. Synthesis and supramolecular assembly of clicked anionic dendritic polymers into polyion complex micelles. Chem. Commun. 2008, 27, 3136−3138. (33) Naoyama, K.; Mori, T.; Katayama, Y.; Kishimura, A. Fabrication of Dendrimer-Based Polyion Complex Submicrometer-Scaled Struc-tures with Enhanced Stability under Physiological Conditions. Macromol. Rapid Commun. 2016, 37 (13), 1087−1093.
(34) Nguyen, V. T. A.; De Pauw-Gillet, M.-C.; Sandre, O.; Gauthier, M. Biocompatible Polyion Complex Micelles Synthesized from Arborescent Polymers. Langmuir 2016, 32 (50), 13482−13492.
(35) Steinschulte, A. A.; Gelissen, A. P. H.; Jung, A.; Brugnoni, M.; Caumanns, T.; Lotze, G.; Mayer, J.; Pergushov, D. V.; Plamper, F. A. Facile Screening of Various Micellar Morphologies by Blending Miktoarm Stars and Diblock Copolymers. ACS Macro Lett. 2017, 6 (7), 711−715.
(36) Dähling, C.; Lotze, G.; Mori, H.; Pergushov, D. V.; Plamper, F. A. Thermoresponsive Segments Retard the Formation of Equilibrium Micellar Interpolyelectrolyte Complexes by Detouring to Various Intermediate Structures. J. Phys. Chem. B 2017, 121 (27), 6739−6748. (37) Till, U.; Gaucher, M.; Amouroux, B.; Gineste, S.; Lonetti, B.; Marty, J.-D.; Mingotaud, C.; Bria, C. R. M.; Williams, S. K. R.; Violleau, F.; Mingotaud, A. F. Frit Inlet Field-flow fractionation techniques for the characterization of polyion complex self-assemblies. J. Chromatogr.A 2017, 1481, 101.
(38) Till, U.; Gibot, L.; Mingotaud, C.; Vicendo, P.; Rols, M. P.; Gaucher, M.; Violleau, F.; Mingotaud, A. F. Self-assembled polymeric vectors mixtures: characterization of the polymorphism and existence of synergetic effects in photodynamic therapy. Nanotechnology 2016, 27, 315102.
(39) Sztucki, M.; Narayanan, T. Development of an ultra-small-angle X-ray scattering instrument for probing the microstructure and the dynamics of soft matter. J. Appl. Crystallogr. 2007, 40, s459−s462.
(40) Rossi, J. C.; Maret, B.; Vidot, K.; Francoia, J. P.; Cangiotti, M.; Lucchi, S.; Coppola, C.; Ottaviani, M. F. Multi-Technique Character-ization of Poly-L-lysine Dendrigrafts-Cu(II) Complexes for Biocatal-ysis. Macromol. Biosci. 2015, 15 (2), 275−290.
(41) Costa, T.; Seixas de Melo, J. A resonance Rayleigh scattering study of unlabeled and pyrene-labeled poly(acrylic acid) polymers. J. Mol. Struct. 2009, 920 (1−3), 142−148.
(42) Burke, S. E.; Barrett, C. J. Acid−Base Equilibria of Weak Polyelectrolytes in Multilayer Thin Films. Langmuir 2003, 19 (8), 3297−3303.
(43) Katayose, S.; Kataoka, K. Water-Soluble Polyion Complex Associates of DNA and Poly(ethylene glycol)−Poly(l-lysine) Block Copolymer. Bioconjugate Chem. 1997, 8 (5), 702−707.
(44) Delgado, A. V.; González-Caballero, F.; Hunter, R. J.; Koopal, L. K.; Lyklema, J. Measurement and interpretation of electrokinetic phenomena. J. Colloid Interface Sci. 2007, 309 (2), 194−224.
(45) Okabe, S.; Seno, K.-i.; Kanaoka, S.; Aoshima, S.; Shibayama, M. Small-angle neutron scattering study on block and gradient copolymer aqueous solutions. Polymer 2006, 47 (21), 7572−7579.
(46) Gelissen, A. P. H.; Pergushov, D. V.; Plamper, F. A. Janus-like interpolyelectrolyte complexes based on miktoarm stars. Polymer 2013, 54 (26), 6877−6881.
(47) Voets, I. K.; de Vries, R.; Fokkink, R.; Sprakel, J.; May, R. P.; de Keizer, A.; Cohen Stuart, M. A. Towards a structural characterization of charge-driven polymer micelles. Eur. Phys. J. E: Soft Matter Biol. Phys. 2009, 30 (4), 351−359.
(48) Voets, I. K.; van der Burgh, S.; Farago, B.; Fokkink, R.; Kovacevic, D.; Hellweg, T.; de Keizer, A.; Cohen Stuart, M. A. Electrostatically Driven Coassembly of a Diblock Copolymer and an Oppositely Charged Homopolymer in Aqueous Solutions. Macro-molecules 2007, 40 (23), 8476−8482.
(49) Kimmich, R.; Anoardo, E. Field-cycling NMR relaxometry. Prog. Nucl. Magn. Reson. Spectrosc. 2004, 44 (3), 257−320.
(50) Kruk, D.; Florek-Wojciechowska, M.; Jakubas, R.; Chaurasia, S. K.; Brym, S. Dynamics of Molecular Crystals by Means of 1H NMR Relaxometry: Dynamical Heterogeneity versus Homogenous Motion. ChemPhysChem 2016, 17 (15), 2329−2339.
(51) Luchinat, C.; Parigi, G. Collective Relaxation of Protein Protons at Very Low Magnetic Field: A New Window on Protein Dynamics and Aggregation. J. Am. Chem. Soc. 2007, 129 (5), 1055−1064.
(52) Gottschalk, M.; Nilsson, H.; Roos, H.; Halle, B. Protein self-association in solution: The bovine β -lactoglobulin dimer and octamer. Protein Science: A Publication of the Protein Society 2003, 12 (11), 2404−2411.
(53) Ravera, E.; Parigi, G.; Mainz, A.; Religa, T. L.; Reif, B.; Luchinat, C. Experimental Determination of Microsecond Reorientation
Correlation Times in Protein Solutions. J. Phys. Chem. B 2013, 117 (13), 3548−3553.
(54) Ravera, E.; Fragai, M.; Parigi, G.; Luchinat, C. Differences in Dynamics between Crosslinked and Non-Crosslinked Hyaluronates Measured by using Fast Field-Cycling Relaxometry. ChemPhysChem 2015, 16 (13), 2803−2809.
(55) Harada, A.; Kataoka, K. Switching by Pulse Electric Field of the Elevated Enzymatic Reaction in the Core of Polyion Complex Micelles. J. Am. Chem. Soc. 2003, 125 (50), 15306−15307.
(56) Ma, R.; Wang, B.; Liu, X.; An, Y.; Li, Y.; He, Z.; Shi, L. Pyranine-Induced Micellization of Poly(ethylene glycol)-block-poly(4-vinyl-pyridine) and pH-Triggered Release of Pyranine from the Complex Micelles. Langmuir 2007, 23 (14), 7498−7504.
Supplementary information for
Mechanistic insights into Poly Ion Complex association.
Stéphane Gineste
a, Emanuela Di Cola
b, Baptiste Amouroux
a, Ugo Till
a,c, Jean-Daniel Marty
a, Anne-Françoise Mingotaud
a, Frédéric Violleau
d,
Christophe Mingotaud
a, Debora Berti
e, Giacomo Parigi
f, Claudio Luchinat
f, Michael Sztucki
g, Stéphanie Balor
h, Barbara Lonetti
a*
SI.0.1 Block-copolymer characterization
SI.1 DLS characterization
Figure SI.1.1 Typical correlogram functions for PICs at different acid/amine ratios
Figure SI.1.2 Evolution of PEO-PAA 6-3 /DGL 3 size measured by DLS, as a function of acid/amine ratio
Figure SI.1.3 Evolution of PEO-PAA 5-38 /DGL 3 size measured by DLS, as a function of acid/amine ratio
SI.2 SAXS Model. Theoretical Background
Figure SI.2.1. Small Angle X-ray scattering as a function of the scattering vector for DGL3 0.1%wt, PEO-PAA 6-3 0.09% wt (same
concentration as in the sample DGL3/PEO-PAA 6-3 at R=AA/NH
2=1), DGL3/PEO-PAA 6-3 solution with R=AA/NH
2=0.5.
Table SI.2.1. Best values of
and
parameters in order to describe the experimental data with R < 1 as the contribution of micelles (completely
formed at R=1) and free DGL3 present in the solutions.
SI.3.
1H Nuclear Magnetic Relaxation Dispersion
Table SI.3.1 Best fit values obtained from the analysis of the
1H NMRD profiles reported in Figure 7.
Figure SI.3.1.
1H NMRD profiles for PEO-PAA 6-3 0.09% wt, PEO-PAA 5-38 0.04% wt and DGL3 0.1% wt.
SI.4 Field Flow Fractionation
Figure SI.4.1. Experimental set-up for Frit Inlet Asymmetrical FFF
Figure SI.4.2. Characterization of PEO-PAA 5-38 / DGL3 PIC by FI-AsFlFFF at stoichiometric ratio 1/1
Figure SI.4.3. Characterization of PEO-PAA 6-6.5/ DGL3 PICs by FI-AsFlFFF (QELS signal) at different ratios. The ratios correspond to that
of acrylic acid units over amine units.
Table SI4.1. Analysis of FlFFF fractogramms
SI.0.1 Block-copolymer characterization
Table SI.0.1 Characterization of commercial PEO-PAA copolymers
a

![Figure 1. Evolution of the scattering properties as a function of R ([AA]/[NH 2 ]) for a solution of DGL3 0.1 wt % titrated with PEO −PAA: (A)](https://thumb-eu.123doks.com/thumbv2/123doknet/2999728.84175/5.938.227.718.99.506/figure-evolution-scattering-properties-function-solution-dgl-titrated.webp)